A Global Fit Determination of Effective
from Baseline Dependence of Reactor Disappearance
Abstract
Recently, three reactor neutrino experiments, Daya Bay, Double Chooz and RENO have directly measured the neutrino mixing angle . In this paper, another important oscillation parameter, effective (= ) is measured using baseline dependence of the reactor neutrino disappearances. A global fit is applied to publicly available data and eV2, are obtained by setting both parameters free. This result is complementary to to be measured by spectrum shape analysis. The measured is consistent with measured by disappearance in MINOS, T2K and atmospheric neutrino experiments within errors. The minimum is small, which means the results from the three reactor neutrino experiments are consistent with each other.
I Introduction
Neutrino oscillation is a phenomenon which is not accounted for by the Standard Model of elementary particles, which assumes neutrinos as massless. There are six parameters in standard three flavor neutrino oscillation PDG10 : three mixing angles between flavor eigenstates and mass eigenstates (, and ), one CP violating imaginary phase (), and two independent squared mass differences: , where are neutrino masses (, , ) of the three mass eigenstates (, , ) which correspond to the largest component of (, , ), respectively. and have been measured by solar neutrino disappearance experiments and long baseline reactor neutrino disappearance experiments . and have been measured by disappearance experiments at accelerators and atmospheric experiments. All these measurements are summarized in PDG10 . Here, is a weighted average of and , called effective as described in detail later in this section. Recently, finite was finally measured by short baseline reactor neutrino experiments DC12 ; DB12 ; RENO12 and long baseline accelerator experiments MINOS_th13_11 ; T2K11 .
Another effective mass squared difference can be measured by energy spectrum distortion and baseline dependence of the reactor- experiments. This paper is to measure by baseline dependence of the reactor neutrino- experiments.
In reactor- experiments, usually the neutrino disappearance is analysed by a two flavor neutrino oscillation formula;
| (1) |
where is baseline which is 1 km and is neutrino energy, which is around a few MeV. is a weighted average of the two mass square differences, and of the standard parametrization,
| (2) |
with and representing and , respectively Nunokawa05 . In the analyses of reactor- experiments so far published, is extracted assuming , which is measured by MINOS experiment MINOS_dm32_11 . can be expressed as,
| (3) |
where Nunokawa05 . Since there is a relation
| (4) |
in the standard three neutrino flavor scheme, the difference between and is expressed as follows,
| (5) |
where the overall sign depends on mass hierarchy, and the term comes from the ambiguity of . The difference is much smaller than the current precisions of measurements and can be treated practically equivalent. A precision better than 1% is necessary to distinguish the mass hierarchy. However, if and are separately measured and if they turn out to be significantly different, it means the standard three flavour neutrino scheme is wrong. Thus it is important to measure independently from to test the standard three flavour neutrino oscillation.
The dependence and dependence analyses to extract use independent information, namely energy distortion and normalization and thus are complementary. Some of the authors demonstrated measurement using dependence of deficit value of each reactor- experiment in 2012 Thiago12 ; Thiago12_Nu12 . In this paper the analysis is significantly improved by applying a detailed global fit making use of the publicly available information of the three reactor neutrino experiments.
In next section we re-analyze the published data of each experiment and compare with the results written in the papers in order to demonstrate our analysis produces identical result. Section-III discusses about possible correlations between the experiments. In section-IV, most recent Double Chooz, Daya Bay and RENO results DC12 ; DB12_II ; RENO12 are combined and is extracted. Finally, a summary of this study is presented in section-V.
II Reactor Neutrino Data
Details of each experiment and their data are presented in this section and they are re-analysed by the authors in order to demonstrate that the analysis methods used in this work are consistent with the publications from the experimental groups. The used in this section will be used to form global function in section-IV.
II.1 Daya Bay
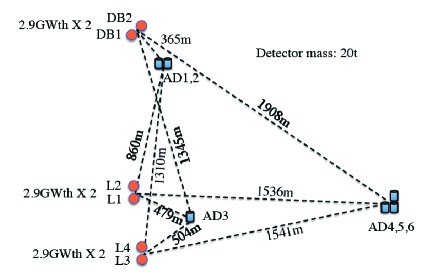
The Daya Bay (DB) reactor neutrino experiment consists of three experimental halls (EH), containing one or more antineutrino detectors (AD). The AD array sees 6 reactors clustered into 3 pairs: Daya Bay (DB1, DB2), Ling Ao (L1, L2) and Ling Ao-II (L3, L4) power stations. Fig.-1 shows the relative locations of reactors and AD and table-1 shows the distance between each combination of reactor and detector. All reactors are functionally identical pressurized water reactors with maximum thermal power of 2.9 GW DB12 .
In DB publication, the is defined as
| (6) |
where are the measured neutrino candidate events of the -th AD with background subtracted, is the corresponding background, is the prediction from neutrino flux, Monte Carlo simulation (MC) and neutrino oscillation. is the fraction of neutrino event contribution of the -th reactor to the -th AD determined by baselines and reactor fluxes. The uncorrelated reactor uncertainty is . is the uncorrelated detection uncertainty, and is the background uncertainty, with the corresponding pull-terms (). An absolute normalization factor is determined from the fit to the data.
The values of are not shown in Daya Bay publications and was estimated using
| (7) |
where is the thermal power of each reactor and is the baseline of -th reactor to -th detector. In this analysis, the value of is considered 1/6 since all reactors have same nominal thermal power. The calculated is shown in table-2. All the others terms are shown in table-3.
By using equation-(6) and the data from tables-2 and -3, we were able to reproduce Daya Bay’s result, where was multiplied by the value of the deficit probability (), defined as:
| (8) |
with being measured in eV2, in meters and in MeV. is the expected energy spectrum of the observed neutrinos which is calculated by . is the energy spectrum of the reactor neutrinos, which is a sum of the energy spectrum of neutrinos from the four fissile elements:
| (9) |
where is reactor neutrino spectrum per fission from fissile element and is a fraction of fission rate of fissile element . For equilibrium light water reactors, are similar and we use the values of Bugey paper Bugey94 , namely = 0.538 : 0.078 : 0.328 : 0.056. In this study, is approximated as an exponential of a polynomial function which is defined in Mueller11 ,
| (10) |
is the cross section of the inverse process of neutron -decay (IBD), that can be precisely calculated from the neutron lifetime Vogel99 . The energy dependence of the IBD cross section is,
| (11) |
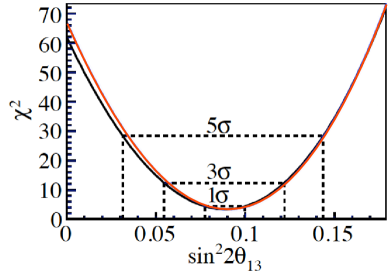
is extracted by fixing as the MINOS MINOS_dm32_11 . The distributions of the Daya Bay paper and our calculation are compared in fig.-2. The Daya Bay central value and uncertainty is while our analysis showed , in good agreement with the published value. We also verified how different values for the fission rates coefficients of equation-(10) and different assumptions for equation-(7), affect the final result. Dependence on the burn-up values is less than 0.001, as it was determined by replacing the burn-up assumption with that of the Chooz reactors at the beginning and end of the reactor cycle. Extreme assumptions on equation-(7) (one or two reactors off for the whole data period, for example) had an effect of less than 0.002 on the central value, with no change on the sensitivity. Moreover, the good agreement between the distributions, shows that the assumptions are reasonable.
II.2 RENO
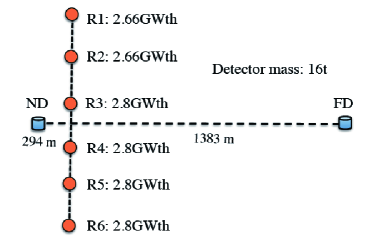
The Reactor Experiment for Neutrino Oscillation (RENO) is located in South Korea and has two identical detectors, one near (ND) and one far (FD) from an array of six commercial nuclear reactors, as shown in fig.-3.
Together with the distances of each detector reactor pair, the contribution of each reactor flux to each detector for the period of their first analysis is available RENO_Nu12 and are summarized in table-4.
The RENO is defined as:
| (12) |
where is the number of observed IBD candidates in each detector after background subtraction and is the number of expected neutrino events, including detection efficiency, neutrino oscillations and contribution from the th reactor to each detector determined from baseline distances and reactor fluxes. A global normalization is taken free and determined from the fit to the data. The uncorrelated reactor uncertainty is , is the uncorrelated detection uncertainty, and is the background uncertainty, and the corresponding pull parameters are . The values of these variables are shown in the table-5.
The expected number of events for both detectors are not present in the RENO paper, but the ratio between data and expectation is shown. This ratio and the quantities of table-4 were used to calculate the expectation value ().
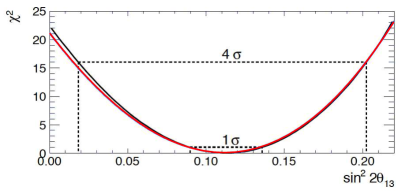
Using the data in the table-5, equation-(8) and the MINOS , we obtained which is in good agreement with their published value of . The distributions are also very similar as shown in fig.-4.
II.3 Double Chooz
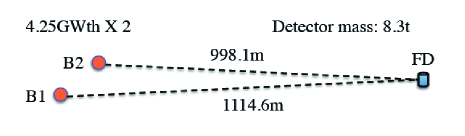
The Double Chooz (DC) experiment uses the two Chooz B reactors with thermal power of each. Currently, the experiment is using only the far detector, since its near detector is not complete yet. The Bugey-4 measurement Bugey94 is used as a reference of the absolute neutrino flux in the analysis, and the relative location of the far detector and reactors are shown in fig.-5, where the distances from the detector to each reactor are 998.1 and 1114.6 meters CHOOZ99 .
The Double Chooz collaboration published a rate plus shape analysis result DC12 . An effect of the shape analysis in this case is an evaluation of main backgrounds of 9Li and fast-neutron from the energy spectrum beyond the reactor neutrino energy range. Since information of detailed energy spectrum, which is necessary to reproduce the analysis, are not publicly available, we do not consider here the shape analysis but restrict only to the rate analysis. After the second publication on the measurement, the Double Chooz group published a result of the direct measurement of backgrounds by making use of 7.53 days reactor-OFF period DCoff . We used these data in addition to the background evaluation inputs written in DC12 to improve the background estimation instead of the energy spectrum analysis. The relative neutrino-flux uncertainty for reactor-OFF period is much larger than reactor-ON period. The dominant uncertainty comes from long-life isotopes whose abundance are not well known. It has negligible contribution in reactor-ON period DCoff . Therefore, we regard the error correlation on neutrino flux between the reactor ON and OFF periods to be uncorrelated. We performed a similar analysis as Daya Bay and RENO cases, assuming that the detector and background related uncertainties of DCoff and DC12 are fully correlated.
| (13) |
where is the number of the observed neutrino event candidates. The subscript “” represents reactor-ON and OFF period. is the number of expected neutrino events, including detection efficiency and oscillation effects, and is the total expected number of background events. The , , and are the reactor, detection and background uncertainties, respectively. The corresponding pull parameters are . Using the parameters shown in table-6, we obtained which is consistent with the result of the DC publication, , although the background evaluation methods are different using different data sets. We also did a rate only analysis of the Double Chooz data, which result agreed with the published one.
III Correlation Evaluation of Systematic Uncertainties
In reactor neutrino experiments, the expected number of observed events () is defined by:
| (14) |
where is the reactor-detector baseline, is the number of targets in the detector, is the detector efficiency, is the reactor thermal power, is the mean energy released per fission, and is the cross-section per fission defined as:
| (15) |
For each experiment, , , , and terms are determined independently. Therefore they can be assumed to be uncorrelated. On the other hand, and terms are taken from the same references and the uncertainties of these terms are correlated between the experiments. From the Bugey and Chooz experimental results, the total uncertainty on spectrum prediction is 2.7%, where a 2% correlation is expected between the experiments as treated in ReactorAnomaly . Fully correlated signal prediction uncertainties between experiments, which come from neutrino flux and detection efficiency, can be cancelled by overall normalization factors used in the analyses of the Daya Bay and RENO. It allows us only to take into account remaining uncertainties between detectors or periods for each experiment. Daya Bay and RENO treat the remaining uncertainties as uncorrelated in their publications.
IV Combined Analysis
As explained before, the main method of this work is to combine all the data of the current neutrino reactor experiments in a single function. Then we look for the minimum value, calculate the distribution, and determine the confidence level regions. The function used for such analysis was chosen so as to use the data from tables-1 to -6 as well as the correlation as described in section-III. The definition of our global is,
| (16) |
with the of each experiment defined as in section-II. Therefore, this function has 32 pull terms: 18 for Daya Bay (6 reactors, 6 detectors and 6 backgrounds), 10 for RENO (6 reactors, 2 detectors and 2 backgrounds) and 4 for Double Chooz (2 reactors, 1 detector and 1 background). It also contains the two overall normalization factors, one for Daya Bay and the other for RENO data set.
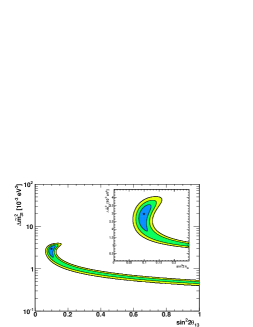
For all combinations of and , the is minimized with respect to the pull terms. Fig.-6 shows a map of the absolute and fig.-7 shows the contour map near the , obtained by such procedure. From the minimum point and the 1 error region in the 1-D distribution,
are obtained. This is consistent with measured by accelerator experiments MINOS_dm32_11 ; T2K_dm32_12 , confirming the standard three flavor neutrino oscillation within the error. The obtained here is independent from . The small /DoF means the data from the three reactor neutrino experiments are consistent with each other.

All the pull terms output were within 1 from the input value, and the normalization factors obtained from the fit to the data, were both less than 1%.
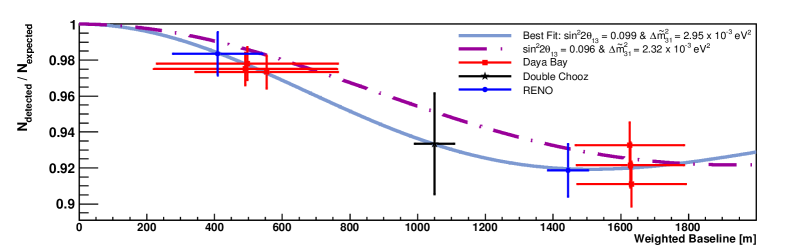
In fig.-8 the baseline dependence of the disappearance probability of each detector is shown, where the probability is calculated using the parameters output which give the best fit. The Double Chooz has a large effect on this determination because it locates at a baseline where the slope of the oscillation is large. In the near future, when the near detector of the Double Chooz experiment starts operation, the accuracy of this measurement is expected to improve much.
Complementary to this study, we demonstrated a similar, but simpler and robust measurement of the effective from the baseline dependence of the disappearance probabilities of the three reactor- experiments Thiago12 ; Thiago12_Nu12 . The result obtained on that work of , is compatible with the value obtained in this paper. In addition, a similar distribution is presented in (ThomasGlobalFit, , fig.-4). However, the central value of could not be compared since only the distribution is presented.
V Summary
In this work, a global fit of the data from all the current reactor- experiments was performed to measure . The combination of the data from Daya Bay, RENO and Double Chooz resulted in . This is consistent with and it confirms that the experiments are observing standard three flavor neutrino oscillations within the error. The mixing angle obtained this analysis is . The small value indicates that the data from the three reactor experiments are consistent with each other. This analysis uses independent information from the energy spectrum distortion and it is possible to improve the accuracy of combining with results from energy spectrum analysis. It will be important to perform this kind of analysis to improve accuracy and to check the consistency of the results from the reactor- experiments.
Acknowledgement
This work was supported by Ministry of Education, Culture, Sport and Technology of Japan; Grant-in-Aid for Specially Promoted Research (20001002) and GCOE and focused research project programs of Tohoku University. We appreciate, Dr. H. Nunokawa, Dr. G. Mention, Dr. D. Lhuillier, the DC and DCJapan groups for useful discussions and comments. We also appreciate Daya Bay, RENO and Double Chooz members who have taken great effort to produce the precious data.
Tables
| DB1 | DB2 | L1 | L2 | L3 | L4 | |
|---|---|---|---|---|---|---|
| AD1 | 362 | 372 | 903 | 817 | 1354 | 1265 |
| AD2 | 358 | 368 | 903 | 817 | 1354 | 1266 |
| AD3 | 1332 | 1358 | 468 | 490 | 558 | 499 |
| AD4 | 1920 | 1894 | 1533 | 1534 | 1551 | 1525 |
| AD5 | 1918 | 1892 | 1535 | 1535 | 1555 | 1528 |
| AD6 | 1925 | 1900 | 1539 | 1539 | 1556 | 1530 |
| DB1 | DB2 | L1 | L2 | L3 | L4 | |
|---|---|---|---|---|---|---|
| AD1 | 0.4069 | 0.3854 | 0.0654 | 0.0799 | 0.0291 | 0.0333 |
| AD2 | 0.4089 | 0.3870 | 0.0643 | 0.0785 | 0.0286 | 0.0327 |
| AD3 | 0.0330 | 0.0318 | 0.2676 | 0.2441 | 0.1882 | 0.2354 |
| AD4 | 0.1208 | 0.1241 | 0.1894 | 0.1892 | 0.1851 | 0.1914 |
| AD5 | 0.1201 | 0.1248 | 0.1895 | 0.1895 | 0.1847 | 0.1913 |
| AD6 | 0.1209 | 0.1241 | 0.1892 | 0.1892 | 0.1851 | 0.1914 |
| AD1 | AD2 | AD3 | AD4 | AD5 | AD6 | |
| candidate | 69121 | 69714 | 66473 | 9788 | 9669 | 9452 |
| 68613 | 69595 | 66402 | 9922.9 | 9940.2 | 9837.7 | |
| Total BKG [day-1] | ||||||
| Live Time [days] | 127.5470 | 127.5470 | 127.3763 | 126.2646 | 126.2646 | 126.2646 |
| Efficiency | 0.8015 | 0.7986 | 0.8364 | 0.9555 | 0.9552 | 0.9547 |
| 67723.59 | 68334.17 | 65363.96 | 9358.7 | 9240.98 | 9037.24 | |
| 157.43 | 156.86 | 124.65 | 28.95 | 28.94 | 28.93 | |
| 0.002 | 0.002 | 0.002 | 0.002 | 0.002 | 0.002 | |
| 0.008 | 0.008 | 0.008 | 0.008 | 0.008 | 0.008 |
| R1 | R2 | R3 | R4 | R5 | R6 | |
|---|---|---|---|---|---|---|
| FD baseline [m] | 1556.5 | 1456.2 | 1395.9 | 1381.3 | 1413.8 | 1490.1 |
| FD contribution | 0.1373 | 0.1574 | 0.1809 | 0.1856 | 0.1780 | 0.1608 |
| ND baseline [m] | 667.9 | 451.8 | 304.8 | 336.1 | 513.9 | 739.1 |
| ND contribution | 0.0678 | 0.1493 | 0.3419 | 0.2701 | 0.1150 | 0.0558 |
| ND | FD | |
|---|---|---|
| IBD candidates | 154088 | 17102 |
| 151723.54 | 17565.72 | |
| Total BKG [day-1] | ||
| Live Time [days] | 192.42 | 222.06 |
| Efficiency | 0.647 | 0.745 |
| 149902.86 | 16160.46 | |
| 0.002 | 0.002 | |
| 0.009 | 0.009 | |
| 1141.05 | 166.54 |
| Reactor-On | Reactor-Off | |
| IBD candidates | 8249 | 8 |
| IBD prediction | 8439.6 | 1.42 |
| Total BKG [day-1] | ||
| Live Time [days] | 227.93 | 6.84 |
| 0.010 | 0.010 | |
| 0.017 | 0.40 |
References
- (1) K. Nakamura et al. (Particle Data Group), J. Phys. G 37: 075021 (2010).
- (2) Y. Abe et al. (Double Chooz Collaboration), Phys. Rev. D 86: 052008 (2012).
- (3) F.P. An et al. (Daya Bay Collaboration), Phys. Rev. Lett. 108: 171803 (2012).
- (4) J.K. Ahn et al. (RENO Collaboration), Phys. Rev. Lett. 108: 191802 (2012).
- (5) P. Adamson et al. (MINOS Collaboration), Phys. Rev. D 82: 051102 (2011).
- (6) K. Abe et al. (T2K Collaboration), Phys. Rev. Lett. 107: 041801 (2011).
- (7) H. Nunokawa et al. Phys. Rev. D 72: 013009 (2005).
- (8) P. Adamson et al. (MINOS Collaboration), Phys. Rev. Lett. 106: 181801, (2011).
-
(9)
T.J.C. Bezerra, H. Furuta and F. Suekane,
arXiv 1206.6017[Hep-ex], 26/June/2012. - (10) T.J.C. Bezerra, H. Furuta and F. Suekane, Neutrino2012, Poster ID.250-1, 4.June.2012, http://neu2012.kek.jp/.
- (11) F.P. An et al. (Daya Bay Collaboration), Chinese Phys. C 37: 011001 (2013).
- (12) Y. Declais et al. Phys. Lett. B 338 (1994).
- (13) Th.A. Mueller et al. Phys. Rev. C83: 054615 (2011).
- (14) P. Vogel and J.F. Beacom, Phys. Rev. D 60: 053003 (1999).
-
(15)
S-B. Kim, Invited talk on ‘Results from RENO’,
http://neu2012.kek.jp/. - (16) M. Apollonio et al. (Chooz Collaboration), Phys. Lett. B 466: 415 (1999).
- (17) Y. Abe et al. (Double Chooz Collaboration), Phys. Rev. D 87: 011102 (2013).
- (18) G. Mention et al. Phys. Rev. D 83: 073006 (2011).
- (19) K. Abe et al. (T2K Collaboration), Phys. Rev. D 85: 031103 (2012).
- (20) M.C. Gonzalez-Garcia et al., J. High Energy Phys. 12: 1-24 (2012).