Doping Dependence of the Plasmon Dispersion in -TaSe2
Abstract
Inelastic electron scattering is applied to investigate the impact of potassium intercalation on the charge-carrier plasmon energy and dispersion in the charge-density wave (CDW) bearing compound -TaSe2. We observe an unususal doping dependence of the plasmon dispersion, which even changes sign on alkali addition.
In contrast to the continous energy shift of the plasmon position on doping at lowest momentum transfer, its dispersion changes in a rather discontinuous manner. We argue that the observed dynamics can be explained only in a picture, where complex phenomena are taken into account including the suppression of the CDW on doping as well as the interplay of the CDW and the plasma resonance.
pacs:
79.20.Uv, 71.45.Lr, 71.20.BeI Introduction
For decades the layered transition-metal dichalcogenides (TMDCs) have attracted considerable interest of researchers in different fields of physics and materials science. Besides the various anisotropic properties, Brown and Beerntsen (1965); Quinn et al. (1966); van Maaren and Schaeffer (1967); Wilson and Yoffe (1969) the layered structure also exhibits a charge-density wave (CDW) phase transition within the plane of the crystal. Wilson et al. (1975); Moncton et al. (1975, 1977) For -TaSe2 a detailed study of this phase transition—exhibiting an incommensurate superstructure followed by a lock-in transition to a commensurate ordering vector—has been, for example, proven by neutron scattering Moncton et al. (1977) or x-ray diffraction experiments. Leininger et al. (2011) The associated opening of a gap at the Fermi level was shown by angle-resolved photoemission measurements. Borisenko et al. (2008); Inosov et al. (2009) Reflectivity as well as resistivity investigations, however, show a partial appearance of a gap at the Fermi level already for temperatures far above the phase transition. Vescoli et al. (1998)
In regard to the collective excitation of the conduction electrons, the TMDC materials revealed a further intriguing feature. The momentum dependence of the collective charge-carrier excitation—termed the plasmon—was found to reveal a shift to lower energies with increasing momentum transfer, which contradicts the conventional behavior of a metal. Schuster et al. (2009) Different investigations have made attempts to clarify this exceptional dispersion. In a semiclassical Ginzburg-Landau approach this effect was assigned to an interplay of the charge density fluctuations and the plasma resonance. van Wezel et al. (2011a) Alternatively, recent band structure calculations attribute the negative dispersion to the shape of the bands crossing the Fermi level. Cudazzo et al. (2012); Faraggi et al. (2012) However, the calculated loss-spectra exhibit a double peak structure around , which is in contrast to the experimentally obtained single peak forming the plasmon. In addition, it has to be mentioned that the plasmon width on doping becomes smaller by shifting to low energies, König et al. (2012) a fact that normally can be attributed to decreasing interband damping effects. Paasch (1970); Sturm (1976)
The crystal structure of the TMDCs exhibits a large van der Waals gap between their hexagonal sandwich like building blocks stacked in the crystallographic -axis. This gap is thought to be the typical place for all kinds of intercalates to arrange within the crystal. Friend and Yoffe (1987); Rouxel (1979) On alkali metal intercalation (Na with Na/Ta and Cs with Cs/Ta varying between 0.3 and 0.6) the band structure of -TaSe2 Brauer et al. (2001); Pettenkofer et al. (1992) and related compounds, such as -RbxTaSe2 Stoltz et al. (2003) and -CsxTaSe2 (up to ), Crawack et al. (2000) is reported to change notably.

Moreover, changes in structure can be observed in various polytypes of the TMDCs. Because of the sandwich configuration, in particular the axis is widened, while the spacing within the basal planes remains nearly unchanged. Starnberg (2000); Omloo and Jellinek (1970) The latter is indicated by slight changes of the superstructure for different compounds such as the aforementioned -CsxTaSe2 Crawack et al. (2000) as well as for KxTiS2. Pronin et al. (2001) CDW superstructures can be ruled out because of a suppression of the ordered state on doping, as, for example, in -KxTaS2. Biberacher and Lerf (1985)
In the case of silver-doped TMDCs, further structural changes are discussed in a staging framework, which is in close analogy to intercalated graphite compounds. New scattering channels are introduced by a slight disarrangement of the chalcogenide atoms by the added silver atoms. The stages then can be observed at doping rates of one- and two-thirds, respectively, for AgxTaS2 as well as AgxTiS2. Scholz and Frindt (1980) There are further examples showing also superstructure effects in AgxNbS2. Wiegers et al. (1988); van der Lee et al. (1991)
In a recent publication we discussed the effects of alkali metal doping on the structural as well as electronic properties of -TaSe2 in addition to the changes in the band structure mentioned above Brauer et al. (2001); Pettenkofer et al. (1992) and the crystal structure. Omloo and Jellinek (1970); Starnberg (2000); König et al. (2012) As was already shown in earlier reports, the CDW gets suppressed by doping, Biberacher and Lerf (1985) accompanied by the formation of new potassium superstructures. König et al. (2012) In an associated theoretical investigation the structures of the various doping stages were modelled to estimate the potassium content of the in situ doped samples. For the undoped case this band structure calculations show an agreement between the theoretical and experimental plasma frequency and the calculated doping rates therefore are used to estimate the experimental doping level throughout the present contribution. König et al. (2012)
In this report we present further results on the in situ intercalation experiments of bulk samples of -TaSe2 with the alkali metal potassium. In particular, electron energy-loss spectroscopy (EELS) is applied to investigate changes in the plasmon dispersion. The possibility to measure the momentum dependence of electronic excitations is the particular strength of this method, as has been demonstrated previously in a number of cases. Knupfer et al. (2000); Schuster et al. (2007); Kramberger et al. (2008); Roth et al. (2013) The investigations of the momentum dependence of the plasma resonance are accompanied by a Kramers-Kronig analysis (KKA) of our spectra.
II Experimental
Single crystals of -TaSe2 were grown from Ta metal and Se ( and purity, respectively) by iodine vapor transport in a gradient of , the crystals growing in the cooler end of the sealed quartz tubes. A very slight excess of Se was included (typically of the charge) to ensure stoichiometry in the resulting crystals. Each experimental run lasted for . This procedure yielded single crystals with maximum size of . Appropriate thin films (thickness of about ) were prepared either by the use of an ultramicrotome or by repeatedly cleaving with adhesive tape. The films were mounted onto standard electron microscopy grids and transferred to the spectrometer. As already pointed out in Ref. König et al., 2012, a very good sample quality is achieved, since clear superstructures of the CDW arising at the predicted transition temperature () are visible.
Potassium intercalation was achieved by evaporation from commercial SAES (SAES GETTERS S. P. A., Italy) sources under ultra high vacuum conditions (base pressure below ). The intercalation levels were achieved by several discrete intercalation steps, each of which took about . The achieved doping concentrations were evaluated based on the procedure described in Ref. König et al., 2012. Finally, the saturation potassium content was found to be stable over several months at room temperature.
All EELS measurements were carried out with a electron energy-loss spectrometer equipped with a He flow cryostat. The resolution of the spectrometer is and for momentum and energy-loss, respectively. The spectrometer setup can be found in Ref. Fink, 1989. In order to carry out the KKA analysis, the quasi elastic line has been subtracted according to a procedure described previously. Schuster et al. (2009)
III Results and Discussion

The energy-loss spectra for three different doping stages are shown in Fig. 1 in a wide energy range. Most prominently they show the volume plasmon at around splitting into a double peak structure on potassium addition. This splitting is a consequence of additional excitations from K 3 levels, which become possible at about for the potassium intercalated samples. The somewhat strange spectral shape of the loss function for the intercalated cases arises from the interaction of two energetically close lying (collective) excitations. Widder et al. (1997) Further excitations as seen in Fig. 1 are the well known charge carrier plasmon, shown in the inset and already discussed in Ref. König et al., 2012 and the higher lying excitations in the range of . Primarily, the latter are excitations from the Ta 5 () as well as the Se 3 () core levels accompanied by multiple scattering effects of the volume plasmon.
The absolute value of the loss spectra were obtained applying a Kramers-Kronig-analysis (KKA). To this end, the measured spectra were extrapolated with an dependence to achieve a broad range of integration, yielding the plotted loss functions.Livins et al. (1988) By fitting other functions derived from the KKA (e. g., the real part of the dielectric function as well as the optical conductivity ) within the Drude-Lorentz model, Fink (1989) the background dielectricity (being in the range of ) was found to be rather independent on the doping level of the sample.Since this background dielectric constant describes the screening abilities of the interband transitions at energies above the plasmon energy, the observed energy shift of the charge-carrier plasmon on potassium intercalation as seen in the inset of Fig. 1 predominantly results from the intercalation induced changes of the charge carriers. For a more detailed description of such an analysis of see Ref. Roth et al., 2010.
We take this as evidence that just the filling of the bands and not a change of their shape is the dominating intercalation effect within the basal plane of the crystal. We note however, that a rigid single band model,Campagnoli et al. (1979) where the doping is implemented by simply shifting the Fermi level to higher energies, is at odds with the multiband character of the Fermi surface.Borisenko et al. (2008)
Figure 2 shows energy-loss spectra in the energy regime around the charge carrier plasmon for the undoped as well as for the maximally doped () compound for increasing momentum transfer at room temperature. In the respective spectra for the lowest momentum transfer the plasmon peak shifts to lower energies when going from the undoped to the doped sample (as can be seen also from the inset of Fig. 2). As discussed above, this is attributed to the varying charge carrier density, filling up the half filled band of the undoped compound. König et al. (2012); Campagnoli et al. (1979) Furthermore, the spectral width of the plasmon peak is smaller for the intercalated sample. Interband transitions that are damping the plasmon of the undoped sample might no longer be present in the lower energy regime of the shifted plasmon, which can provide a rationalization of the sharpening of the plasmon on doping. König et al. (2012)
Besides the slight broadening on increasing momentum transfer, it is obvious that the plasmon around exhibits a slight negative dispersion Schuster et al. (2009) for the undoped compound (left panel of Fig. 2). This behavior changes to a clear positive dependence for the fully doped material (right panel of Fig. 2).
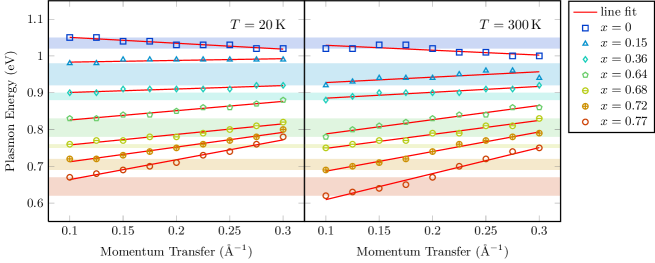
The evolution of the plasmon dispersion on potassium intercalation is evaluated in detail in Fig. 3, where the dispersion of the plasmon as determined from Fig. 2 and additional measurements are shown. Being negative for the undoped sample the slope increases to values above zero on potassium addition. This behavior can be observed for low (, left panel of Fig. 3) as well as for high temperatures (, right panel of Fig. 3). The shaded bars indicate the blueshift of the plasmon energy going from higher to lower temperatures. This can be assigned to the enhanced charge density due to the contraction of the crystal structure on cooling. However, a doping dependence of this temperature induced shift can not be observed—it differs for all intercalation levels.
To further analyze the changes in the dispersion in a more quantitative manner, the momentum dependencies plotted in Fig. 3 were fitted by straight lines (also shown in the figure). This might not describe the real momentum dependence of the dispersion Schuster et al. (2009); van Wezel et al. (2011b) but it provides a reasonable quantification of the observed variations at momentum transfers below . The resulting slope values are plotted in Fig. 4.
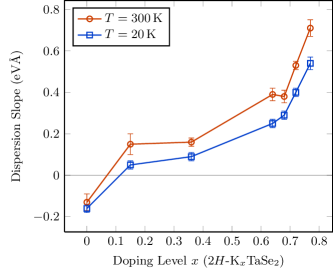
Notably, already for a small increase of the charge-carrier concentration by a substantial change in the dispersion is observed consisting of a large jump including a sign change. Besides a variation of the charge-carrier concentration, initial potassium addition also results in a larger crystal axis. König et al. (2012) In turn, the charge-carrier density also changes, and the associated downshift of the plasmon energy at smallest momentum transfer is, thus, a consequence of doping and lattice changes, while the latter is particularly prominent at initial K intercalation. König et al. (2012) The large jump in the plasmon dispersion, in particular the unusual change of sign, however, points towards deeper roots for this effect. It is important to realize that even at small doping of the order of the charge density wave in -TMDC materials becomes considerably weakened if not suppressed. König et al. (2012); Shen et al. (2007); Fang et al. (2005) Moreover, the negative plasmon dispersion of undoped -TaSe2 has been rationalized in the framework of a semiclassical Ginzburg-Landau approach, and was assigned to an interplay of the charge density fluctuations and the plasma resonance. van Wezel et al. (2011a) Keeping all this in mind, it is natural to ascribe the drastic changes in the plasmon dispersion for initial potassium addition in -TaSe2 to the suppression of the charge density wave in this compound on doping and the connected disappearance of the interaction of the charge density wave fluctuations with the charge-carrier plasmon.
Intriguingly, adding more potassium (more than ) visibly affects the energy position of the plasmon at small momenta and the plasmon width (see figures above and Ref. König et al., 2012), while the plasmon dispersion hardly changes until an intercalation of more than about is reached. Above this value, there is a further significant rise of the slope of the plasmon dispersion. We also note that for all intercalation levels the charge-carrier plasmon is a well-defined spectral feature with decreasing width on increasing intercalation level (see also Ref. König et al., 2012), which demonstrates that all measured potassium intercalated -TaSe2 compounds represent a homogeneous potassium distribution, i. e., the potassium intercalation occurs in a solid-solution manner. In view of a simple, free-electron gas description, one would expect that both the plasmon energy and the plasmon dispersion coefficient decrease with an effectively decreasing charge carrier concentration as induced by potassium addition. König et al. (2012); Campagnoli et al. (1979); Fink (1989) Consequently, the significant rise of the plasmon dispersion as visualized in Fig. 4 represents a more complex phenomenon, and it might be connected to the multiband character of the Fermi surface of -TaSe2.Borisenko et al. (2008); Cudazzo et al. (2012); Faraggi et al. (2012)
Finally, the behavior on temperature variation as depicted in Fig. 3 and Fig. 4 parallels the observations as a function of potassium intercalation. While the larger plasmon energy at small momentum transfers for lower temperature is in line with the contraction of the lattice and the associated increase of the charge-carrier density, the slope of the plasmon dispersion is always smaller for lower temperature, which is opposite to what a simple model would predict. This issue needs further consideration and investigations in the future for final clarification.
IV Summary
To summarize, we performed electron energy-loss spectroscopy studies of the transition-metal dichalcogenide -TaSe2 investigating the effect of intercalated potassium on the energy and dispersion of the charge-carrier plasmon. Analyzing the optical reponse functions of the gradually intercalated samples by a Kramers-Kronig analysis, we argue that band filling is the dominating influence of the addition of the intercalate. The multiband character of the Fermi surface, however, contradicts a simple, rigid single band model.
Our preparation procedure allowed rather high doping rates, and we demonstrate the momentum dependence of the charge-carrier plasmon to change in a very unusual manner from a negative to a positive slope with increasing potassium content. Remarkably, this behavior is observed for temperatures below the charge-density wave phase transition of the undoped compound as well as at room temperature.
A detailed analysis of this discontinuous change of the plasmon dispersion is achieved by fitting the dispersions by straight lines. While the shift of the plasmon energy at lowest momentum transfer is a consequence of the doping and the accompanying lattice change, the strong change in the dispersion at initial K intercalation is assigned to the suppression of the CDW, altering the coupling of the latter to the plasma resonance. The fact that the dispersion hardly changes with further doping before a drastic change at high doping levels occurs might be caused by the multiband character of the compounds’ Fermi surface.
However, taking all this into account, it remains unclear why the closely related -NbS2 is peculiar in some sense, since it is characterized by a positive plasmon dispersion even for the undoped case. Manzke et al. (1981) We suggest further investigations of this material class on Rb and Cs intercalation, in order to disentangle doping and lattice expansion effects. A comparison of the different -TMDCs as a function of intercalation might then also give deeper insight into the differences in regard to their plasmon dispersion and charge density formation.
Acknowledgement
We thank M. Naumann, S. Leger and R. Hübel for technical assistance. This work was supported by the Deutsche Forschungsgemeinschaft via Grants No. KN393/12 and No. KN393/13.
References
- Brown and Beerntsen (1965) B. E. Brown and D. J. Beerntsen, Acta Cryst. 18, 31 (1965).
- Quinn et al. (1966) R. K. Quinn, R. Simmons, and J. J. Banewicz, J. Phys. Chem. 70, 230 (1966).
- van Maaren and Schaeffer (1967) M. H. van Maaren and G. M. Schaeffer, Phys. Lett. A 24, 645 (1967).
- Wilson and Yoffe (1969) J. A. Wilson and A. D. Yoffe, Adv. Phys. 18, 193 (1969).
- Wilson et al. (1975) J. A. Wilson, F. J. Di Salvo, and S. Mahajan, Adv. Phys. 24, 117 (1975).
- Moncton et al. (1975) D. E. Moncton, J. D. Axe, and F. J. Di Salvo, Phys. Rev. Lett. 34, 734 (1975).
- Moncton et al. (1977) D. E. Moncton, J. D. Axe, and F. J. Di Salvo, Phys. Rev. B 16, 801 (1977).
- Leininger et al. (2011) P. Leininger, D. Chernyshov, A. Bosak, H. Berger, and D. S. Inosov, Phys. Rev. B 83, 233101 (2011).
- Borisenko et al. (2008) S. V. Borisenko, A. A. Kordyuk, A. N. Yaresko, V. B. Zabolotnyy, D. S. Inosov, R. Schuster, B. Büchner, R. Weber, R. Follath, L. Patthey, and H. Berger, Phys. Rev. Lett. 100, 196402 (2008).
- Inosov et al. (2009) D. S. Inosov, D. V. Evtushinsky, V. B. Zabolotnyy, A. A. Kordyuk, B. Büchner, R. Follath, H. Berger, and S. V. Borisenko, Phys. Rev. B 79, 125112 (2009).
- Vescoli et al. (1998) V. Vescoli, L. Degiorgi, H. Berger, and L. Forró, Phys. Rev. Lett. 81, 453 (1998).
- Schuster et al. (2009) R. Schuster, R. Kraus, M. Knupfer, H. Berger, and B. Büchner, Phys. Rev. B 79, 045134 (2009).
- van Wezel et al. (2011a) J. van Wezel, R. Schuster, A. König, M. Knupfer, J. van den Brink, H. Berger, and B. Büchner, Phys. Rev. Lett. 107, 176404 (2011a).
- Cudazzo et al. (2012) P. Cudazzo, M. Gatti, and A. Rubio, Phys. Rev. B 86, 075121 (2012).
- Faraggi et al. (2012) M. N. Faraggi, A. Arnau, and V. M. Silkin, Phys. Rev. B 86, 035115 (2012).
- König et al. (2012) A. König, K. Koepernik, R. Schuster, R. Kraus, M. Knupfer, B. Büchner, and H. Berger, EPL (Europhysics Letters) 100, 27002 (2012).
- Paasch (1970) G. Paasch, Phys. Stat. Sol. B 38, K123 (1970).
- Sturm (1976) K. Sturm, Zeitschrift für Physik B Condensed Matter 25, 247 (1976), 10.1007/BF01420885.
- Friend and Yoffe (1987) R. H. Friend and A. D. Yoffe, Adv. Phys. 36, 1 (1987).
- Rouxel (1979) J. Rouxel, “Alkali metal intercalation compounds of transition metal chalcogenides: TX2, TX3 and TX4 chalcogenides,” (D. Reidel Publishing Company, Dordrecht, Holland / Boston, USA / London, England, 1979) pp. 201–250.
- Brauer et al. (2001) H. E. Brauer, H. I. Starnberg, L. J. Holleboom, H. P. Hughes, and V. N. Strocov, J. Phys. Cond. Mat. 13, 9879 (2001).
- Pettenkofer et al. (1992) C. Pettenkofer, W. Jaegermann, A. Schellenberger, E. Holub-Krappe, C. Papageorgopoulos, M. Kamaratos, and A. Papageorgopoulos, Solid State Commun. 84, 921 (1992).
- Stoltz et al. (2003) S. E. Stoltz, H. I. Starnberg, and L. J. Holleboom, Phys. Rev. B 67, 125107 (2003).
- Crawack et al. (2000) H. J. Crawack, Y. Tomm, and C. Pettenkofer, Surf. Sci. 465, 301 (2000).
- Starnberg (2000) H. I. Starnberg, Mod. Phys. Lett. B 14, 455 (2000).
- Omloo and Jellinek (1970) W. Omloo and F. Jellinek, J. Less-Comm. Met. 20, 121 (1970).
- Pronin et al. (2001) I. Pronin, M. Gomoyunova, N. Faradzhev, D. Valdaitsev, and H. Starnberg, Surf. Sci. 482–485, Part 2, 1419 (2001).
- Biberacher and Lerf (1985) W. Biberacher and A. Lerf, Mol. Cryst. Liq. Cryst. 121, 149 (1985), http://www.tandfonline.com/doi/pdf/10.1080/00268948508074851 .
- Scholz and Frindt (1980) G. A. Scholz and R. Frindt, Mater. Res. Bull. 15, 1703 (1980).
- Wiegers et al. (1988) G. A. Wiegers, R. J. Haange, and F. van Bolhuis, Phys. Stat. Sol. A 107, 817 (1988).
- van der Lee et al. (1991) A. van der Lee, S. van Smaalen, G. A. Wiegers, and J. L. de Boer, Phys. Rev. B 43, 9420 (1991).
- Knupfer et al. (2000) M. Knupfer, J. Fink, E. Zojer, G. Leising, and D. Fichou, Chemical Physics Letters 318, 585 (2000).
- Schuster et al. (2007) R. Schuster, M. Knupfer, and H. Berger, Phys. Rev. Lett. 98, 037402 (2007).
- Kramberger et al. (2008) C. Kramberger, R. Hambach, C. Giorgetti, M. H. Rümmeli, M. Knupfer, J. Fink, B. Büchner, L. Reining, E. Einarsson, S. Maruyama, F. Sottile, K. Hannewald, V. Olevano, A. G. Marinopoulos, and T. Pichler, Phys. Rev. Lett. 100, 196803 (2008).
- Roth et al. (2013) F. Roth, A. König, C. Kramberger, T. Pichler, B. Büchner, and M. Knupfer, EPL 102, 17001 (2013).
- Fink (1989) J. Fink, Adv. Electr. Electr. Phys. 75, 121 (1989).
- Widder et al. (1997) K. Widder, M. Knupfer, O. Knauff, and J. Fink, Phys. Rev. B 56, 10154 (1997).
- Livins et al. (1988) P. Livins, T. Aton, and S. E. Schnatterly, Phys. Rev. B 38, 5511 (1988).
- Roth et al. (2010) F. Roth, C. Hess, B. Büchner, U. Ammerahl, A. Revcolevschi, and M. Knupfer, Phys. Rev. B 82, 245110 (2010).
- Campagnoli et al. (1979) G. Campagnoli, A. Gustinetti, A. Stella, and E. Tosatti, Phys. Rev. B 20, 2217 (1979).
- van Wezel et al. (2011b) J. van Wezel, P. Nahai-Williamson, and S. S. Saxena, Phys. Rev. B 83, 024502 (2011b).
- Shen et al. (2007) D. W. Shen, B. P. Xie, J. F. Zhao, L. X. Yang, L. Fang, J. Shi, R. H. He, D. H. Lu, H. H. Wen, and D. L. Feng, Phys. Rev. Lett. 99, 216404 (2007).
- Fang et al. (2005) L. Fang, Y. Wang, P. Y. Zou, L. Tang, Z. Xu, H. Chen, C. Dong, L. Shan, and H. H. Wen, Phys. Rev. B 72, 014534 (2005).
- Manzke et al. (1981) R. Manzke, G. Crecelius, J. Fink, and R. Schöllhorn, Solid State Commun. 40, 103 (1981).