UM 625 Revisited: Multiwavelength Study of A Seyfert 1 Galaxy with a Low-mass Black Hole
Abstract
UM 625, previously identified as a narrow-line active galactic nucleus (AGN), actually exhibits broad H and H lines whose width and luminosity indicate a low black hole mass of . We present a detailed multiwavelength study of the nuclear and host galaxy properties of UM 625. Analysis of Chandra and XMM-Newton observations suggests that this system contains a heavily absorbed and intrinsically X-ray weak () nucleus. Although not strong enough to qualify as radio-loud, UM 625 does belong to a minority of low-mass AGNs detected in the radio. The broad-band spectral energy distribution constrains the bolometric luminosity to erg s-1 and . A comprehensive analysis of Sloan Digital Sky Survey and Hubble Space Telescope images shows that UM 625 is a nearly face-on S0 galaxy with a prominent, relatively blue pseudobulge (Sérsic index ) that accounts for 60% of the total light in the band. The extended disk is featureless, but the central pc contains a conspicuous semi-ring of bright, blue star-forming knots, whose integrated ultraviolet luminosity suggests a star formation rate of 0.3 yr-1. The mass of the central black hole roughly agrees with the value predicted from its bulge velocity dispersion but is significantly lower than that expected from its bulge luminosity.
1 Introduction
Supermassive black holes (BHs), with masses in the range of as measured via stellar and gas kinematics, have been convincingly inferred to be present in the centers of nearby inactive massive galaxies and are generally believed to reside in all galaxies with a spheroidal stellar component (see Kormendy & Ho 2013 for a review). Moreover, there are tight relations between the BH mass () and the properties of the spheroidal component (namely, ellipticals and the bulges of disk galaxies), including stellar velocity dispersion (; Ferrarese & Merritt 2000, Gebhardt et al. 2000a), luminosity (; Kormendy & Richstone 1995; Magorrian et al. 1998; Marconi & Hunt 2003), and mass (; Häring & Rix 2004).
However, the situation is far from clear in the low-mass regime ( ) because such BHs are largely beyond the reach of current capabilities for direct dynamical measurement. A practical approach is to search for them in low-luminosity type 1 active galactic nuclei (AGNs) with mass estimated from their broad-line width and luminosity using empirical virial relationships (e.g., Gebhardt et al. 2000b; Kaspi et al. 2000). This technique has yielded a sample of candidate BHs with masses between to (Greene & Ho 2004, 2007b; Dong et al. 2012b), including a couple below , in the regime of so-called intermediate-mass BHs (IMBH, ; Filippenko & Ho 2003; Barth et al. 2004; Dong et al. 2007; see reviews in Ho 2008; Kormendy & Ho 2013). The host galaxies of low-mass BHs thus found appear very different from their supermassive counterparts. The best nearby example, NGC 4395, is a dwarf Sdm galaxy without a bulge at all (Filippenko & Ho 2003), while the second prototype, POX 52, is instead a spheroidal or dwarf elliptical galaxy (Barth et al. 2004; Thornton et al. 2008). According to the studies to date, the – relation of local inactive massive galaxies appears to roughly extend to the low-mass end (Barth et al. 2005; Greene & Ho 2006; Xiao et al. 2011), but the – relation does not. Photometric decomposition by Greene et al. (2008) and Jiang et al. (2011a) indicates that the majority of the host galaxies with disks are likely to contain pseudobulges; the rest resemble spheroidals according to their position on the fundamental plane. Very few live in classical bulges. Moreover, the – relation flattens out at the low-mass end, and on average the bulge luminosity is larger by 1–2 index at fixed (Greene et al. 2008; Jiang et al. 2011b).
The low BH masses and high accretion rates that generally typify the low-mass AGN sample also provide a unique opportunity to probe accretion processes in an under-explored regime of parameter space. Especially interesting is the broad-band spectral energy distribution (SEDs) of these systems. Unlike quasars, which have luminosities that far exceed that of their host galaxies, the SEDs of Seyferts, particularly those with low-mass BHs, can be strongly contaminated by emission from their hosts. Observations with high angular resolution are absolutely essential to decouple the AGN from the host to construct proper nuclear SEDs. In spite of these challenges, studies so far already suggest that low-mass AGNs may possess unusual multiband properties, including for the tendency to be very radio-quiet (Greene et al. 2006; Greene & Ho 2007b) and relatively X-ray bright (Greene & Ho 2007a; Miniutti et al. 2009; Desroches et al. 2009; Dong et al. 2012a).
The most extensive multiwavelength studies on low-mass BHs thus far have concentrated, unsurprisingly, on the two prototypes, NGC 4395 and POX 52. Interestingly, the SED of NGC 4395 differs markedly from those of both quasars and typical low-luminosity AGNs (Moran et al. 1999). Specifically, the big blue bump, which dominates the SED of luminous
Seyferts and quasars at optical and UV bands, is absent, leading to an optical-to-X-ray spectral index of (Dewangan et al. 2008). NGC 4395 is a rare example of a low-mass AGN with a relatively low Eddington ratio () of . Most likely because of strong selection effects, optically selected samples of low-mass BHs tend to have higher , ranging from to with a median of 0.2 (Dong et al. 2012b). POX 52, with erg s-1 and , exhibits a much more normal SED that is broadly similar to that of a scaled-down version of radio-quiet quasars (Thornton et al. 2008). The broad-band SED of NGC 4051, a narrow-line Seyfert 1 galaxy with (Denney et al. 2009) accreting at of , is best fit by a relativistically outflowing jet model (Maitra et al. 2011).
This paper reports a detailed multiwavelength data analysis of a low-mass BH hosted in the pseudobulge of UM 625. First noted as a “neutral compact spherical disc galaxy” by Zwicky et al. (1975), the blue color of UM 625 ( mag; Salzer et al. 1989) placed it in early catalogs of blue compact galaxies (e.g., Campos-Aguilar et al. 1993). A high spatial resolution optical image was obtained with HST as part of the nearby AGN survey of Malkan et al. (1998), in which UM 625 was noted as an S0 galaxy with a partial nuclear ring structure. Later analysis of a near-infrared (NIR) HST/NICMOS image revealed a point-like nucleus embedded in an exponential surface brightness profile (Quillen et al. 2001; see also Hunt & Malkan 2004). An HST ACS/HRC image taken in the near-ultraviolet (NUV) shows a very bright, compact, yet partially resolved nucleus (Muñoz Marín et al. 2007).
An optical spectrum of UM 625 was first acquired as part of the University of Michigan objective-prism survey for emission-line galaxies (MacAlpine & Williams 1981), from which its common name originates. Since then UM 625 has been classified as a Seyfert 2 galaxy (or occasionally as an H II galaxy) in light of its extremely strong [O III] lines and the apparent absence of broad emission lines (e.g., Salzer et al. 1989; Terlevich et al. 1991). The spectral classification was re-examined critically by Dessauges-Zavadsky et al. (2000); using emission-line measurements from the literature, they classified it as a Seyfert 2 according to the three standard optical line-ratio diagnostic diagrams of Veilleux & Osterbrock (1987). Using a high-quality Sloan Digital Sky Survey (SDSS; York et al. 2000) spectrum with a resolution , we clearly detect both broad H and H and revise the spectral classification of UM 625 to a Seyfert 1. Combining the broad line width and luminosity, we estimate a BH mass of , placing UM 625 in our sample of AGNs with low-mass BHs (Dong et al. 2012b).
We assume a cosmology with km s-1 Mpc-1, , and . At a redshift of , UM 625 has a luminosity distance of 109.1 Mpc.
2 Analysis of the Optical Spectrum
UM 625 was spectroscopically observed by SDSS on 18 June 2002 UT with an exposure time of 4803 s exposure. It was classified as a galaxy by the spectroscopic pipeline of the SDSS Fourth Data Release (Adelman-McCarthy et al. 2006). In the course of our systematic spectral fitting of all extragalactic objects in the SDSS, we first noted UM 625 because it showed evident broad H and H emission; its inferred virial BH mass placed it in the sample of type 1 AGNs with BH masses below described by Dong et al. (2012b). The details of the spectral analysis are given in Dong et al. (2012b). Here we present a brief description of the continuum modeling and emission-line profile fitting, which are based on the MPFIT package (Markwardt 2009) that performs -minimization by the Levenberg–Marquardt technique.
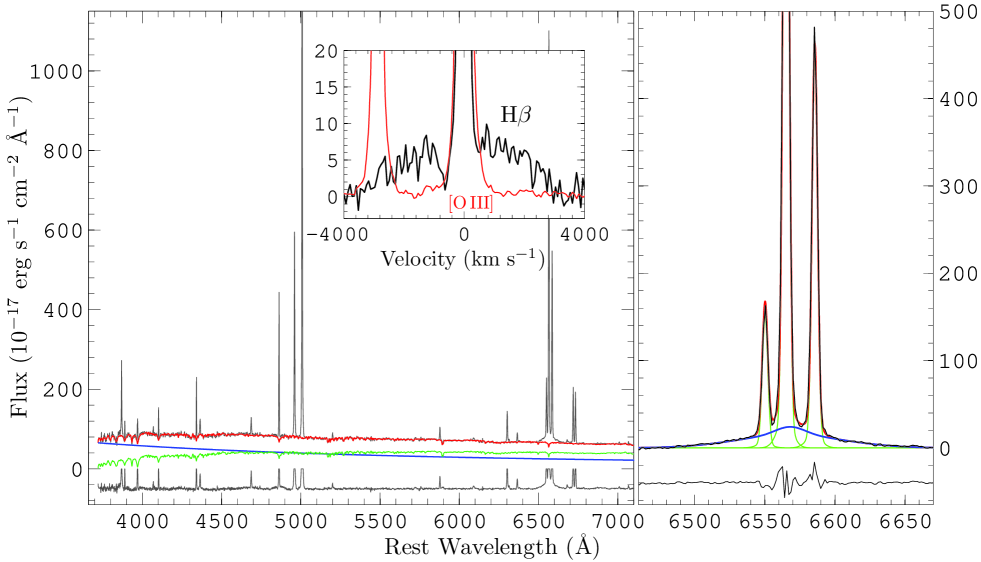
UM 625 has a redshift of , and its SDSS spectrum is dominated by host galaxy starlight. The median signal-to-noise (S/N) ratio in the H–[O III] and H–[N II]–[S II] regions are 45 and 60 pixel-1, respectively, high enough to fit accurately the continuum and emission lines. We begin by correcting the spectrum for Galactic extinction using the extinction map of Schlegel et al. (1998) and the reddening curve of Fitzpatrick (1999). We model the starlight component with the stellar templates of Lu et al. (2006), which were built from the simple stellar population spectra (Bruzual & Charlot 2003). The AGN continuum is modeled as a power law. The stellar absorption lines must be subtracted well to ensure reliable measurement of weak emission lines (e.g., Ho et al. 1993, 1997). This is achieved by broadening and shifting the starlight templates to match the stellar velocity dispersion of the galaxy. As shown in Figure 1 (left panel), the fit is good; the absorption features are well matched, and the residuals in the emission line-free regions are consistent with the noise level.
Next, we fit the emission lines with Gaussians, using the code described in
detail in Dong et al. (2005). The spectrum of UM 625 is dominated by
strong, narrow emission lines such as [O III] , H,
H, and [N II] . But even a cursory inspection of
the spectrum reveals that H has a clear broad component, even before
continuum subtraction; after continuum subtraction, a broad component to
H also emerges. This is reminiscent of the situation of the two prototypal
broad-line AGNs with intermediate-mass BHs, namely NGC 4395 (Filippenko &
Sargent 1989) and POX 52 (Barth et al. 2004). Because of their narrowness as
well as the high S/N ratio of the SDSS spectrum, the doublet lines of both
[S II] and [N II] are well isolated. [S II], [N II], and the narrow components of
the Balmer lines have very similar full widths at half-maximum (FWHMs).
We fit [S II] first, assuming that the doublet lines have the same width;
a good fit is achieved with reduced (29 degrees of freedom)
by using two Gaussians for each line. Then we fit the H–[N II] region,
taking the best-fit model of [S II] as a template to model [N II] and narrow H.
The line ratio of [N II] 6583/6548 is set to the theoretical
value 2.96, and their separation is fixed to the laboratory value. We use
additional Gaussians to model the broad component of H, starting with one
Gaussian and adding in more if the fit can be improved significantly according
to the test. A good fit is achieved for broad H with just two
Gaussians (Figure 1, right panel). As the broad H component is weak, we fit the total H profile by assuming that its narrow
component has the same profile as [S II] and that its broad component has the
same profile as broad H. With the exception of [O III] ,
![[Uncaptioned image]](/html/1304.5807/assets/x2.png) we fit the other narrow emission lines simply with a single Gaussian. For [O III],
we modeled each of its doublet lines with two Gaussians, one accounting for
the bulk component (line core) and the other for a weak, yet apparent, blue
wing. All the line parameters are listed in Table 1. We make available
online the data and the detailed fitting parameters.111Available at
http://staff.ustc.edu.cn/~xbdong/Data_Release/IMBH_DR4/, together with
auxiliary code to explain and demonstrate the fitting procedure.
we fit the other narrow emission lines simply with a single Gaussian. For [O III],
we modeled each of its doublet lines with two Gaussians, one accounting for
the bulk component (line core) and the other for a weak, yet apparent, blue
wing. All the line parameters are listed in Table 1. We make available
online the data and the detailed fitting parameters.111Available at
http://staff.ustc.edu.cn/~xbdong/Data_Release/IMBH_DR4/, together with
auxiliary code to explain and demonstrate the fitting procedure.
The ratios of the prominent narrow lines, [O III] /H and [N II] /H , place UM 625 within the regime of AGNs (Baldwin et al. 1981). With a total H to [O III] ratio of 0.2, UM 625, like NGC 4395 and POX 52, would be considered a Seyfert 1.8 in the classification scheme of Osterbrock (1981). From the best-fit model of broad H yields FWHM = and a line dispersion (, the second moment of the line profile) of (both corrected for the SDSS instrumental resolution of 139 FWHM). The luminosity of broad H is erg s-1. The observed (not corrected for internal extinction) luminosity of the narrow H component is 3 times higher ( erg s-1), and the luminosity of [O III] is erg s-1.
To test the reliability of the broad components of Balmer lines, we refit the H–[N II] complex and H using as a template for each line the [O III] profile derived from its double-Gaussian model. The results are totally unacceptable; the reduced and 37, respectively, for the H and the H–[N II] complex, with obvious large residuals. This is evident by directly comparing the profiles of H and [O III] , as shown in the inset of Figure 1 (with [O III] scaled to have the same peak flux density as H); H has an additional much broader, albeit low-contrast ( erg s-1 cm-2 Å-1), component that is not present in [O III] . Also evident in the inset is that [O III] is slightly broader than H [by , in height range erg s-1 cm-2 Å-1]. We also tried another fitting scheme in which we model the narrow Balmer lines with the total profile of [O III] and the broad component of the Balmer lines with two Gaussians; the fitting results are also unacceptable, with reduced and 23, respectively, for the H and H–[N II] regions.
The extinction of the broad-line region (BLR) can be derived
from the observed Balmer decrement H/H for normal AGNs (Dong et al. 2008). Assuming the extinction curve of the Small Magellanic Cloud (Hopkins et al. 2004; Wang et al. 2005) and an intrinsic broad-line H/H = 3.1 (Dong et al. 2008), we get mag for the BLR. Likewise, the observed narrow H and H gives mag for the NLR.
3 Analysis of the Images
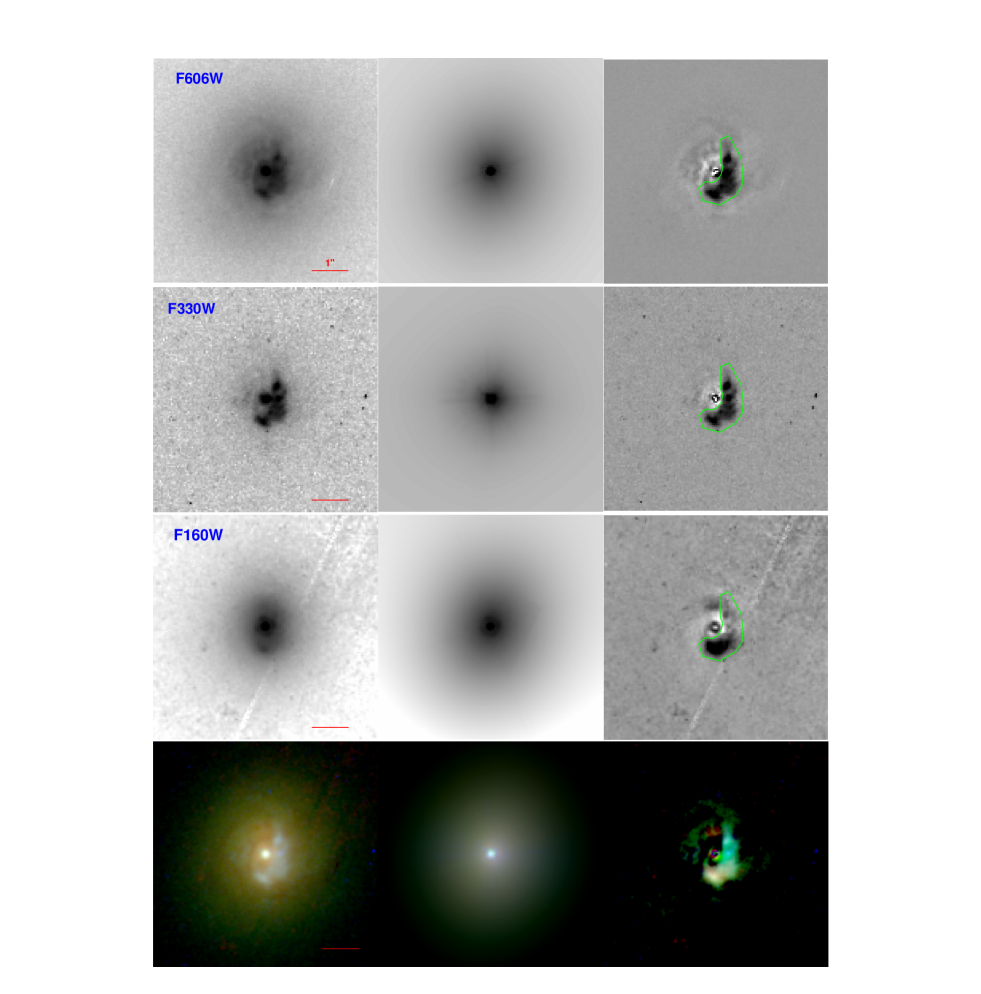
There are archival HST images in three bands for UM 625: F330W (roughly the band of the Johnson system), F606W (), and F160W (), observed through ACS, WFPC2, and NICMOS, respectively. From these images, we can see clearly that there is a bright point-like source present in the center of UM 625, and that the galaxy is almost round in shape and has no spiral arms, indicating an elliptical/spheroidal or a face-on S0 galaxy. Closer inspection reveals that there is, in addition, a nuclear semi-ring on scales of pc; this feature, most conspicuous in the F330W image, is resolved into several knots, presumably sites of intense star formation. The ring region is indicated in Figure 2 with the green polygon. These high-resolution images give us a distinct opportunity to study not only the multiwavelength properties of the AGN, but also its host galaxy. The HST images, however, suffer from one major limitation: their field of view is too small to properly sample the disk component or to reliably measure the sky background.
Fortunately, UM 625 was imaged with SDSS. Thus, before we discuss the HST images in detail, we first turn to the SDSS images. Our strategy is to use the SDSS -band image, which closely approximates the HST F606W band, to constrain the photometric parameters of the disk component, which is otherwise difficult to determine from the HST data alone. With the disk thus constrained, we will use the HST F606W image to measure the parameters of the AGN point source and the bulge, which are central to our scientific analysis. The F330W and F160W images provide further photometric points for the nuclear SED, as well as color information to diagnose the stellar population of the bulge.
3.1 SDSS Imaging
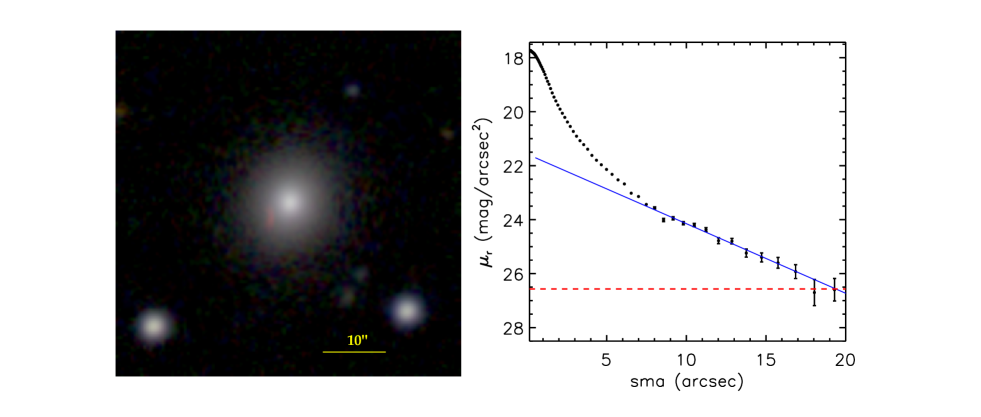
UM 625 was observed by SDSS in on 24 May 2001 UT (Figure 3). Although the standard SDSS images have a relatively short exposure time of only 54 s per filter, the drift-scan mode in which the imaging survey was conducted (Gunn et al. 1998) ensures very accurate flat-fielding. Moreover, for most galaxies the field of view is quite large. Both factors are crucial for obtaining an accurate measurement of the sky background and its associated error, which determines the limiting surface brightness sensitivity. For most galaxies the azimuthally averaged surface brightness profile can be measured reliably down to mag arcsec-2, which is deep enough to study the outer structure of galaxies (Pohlen & Trujillo 2006; Erwin et al. 2008; Li et al. 2011).
We chose to work with the band, which is closest to the HST F606W filter. We first mask all photometric objects in the field identified either by Sextractor (Bertin & Arnouts 1996) or by the SDSS photometric pipeline and then run the IRAF222IRAF (Image Reduction and Analysis Facility) is distributed by the National Optical Astronomy Observatory, which is operated by AURA, Inc., under cooperative agreement with the National Science Foundation. task ellipse to fit isophotes with a linear step of 2 pixels between successive steps, allowing the center, position angle, and ellipticity of each ellipse to vary. The sky background level is determined from the best-fit ellipses that have constant surface brightness with respect to radius, and the uncertainty on the background is estimated from the root mean square fluctuations () about the mean value. The limiting surface brightness, defined as 3 , is 26.57 . After sky subtraction, the azimuthally averaged one-dimensional (1-D) surface brightness profile is extracted in logarithmic steps, to increase the S/N in the noisier outer regions. We can clearly see that the profile (right panel of Figure 3) at radii larger than behaves like an exponential disk, the scale length of which is 421017 ( kpc). We do not decompose the inner regions of the galaxy with this data set, as the SDSS image lacks sufficient resolution; for that, we turn to the high-resolution HST images below.
3.2 HST: Optical Image
The F606W image is our best choice for probing the host galaxy structure because (1) the bandpass is relatively red and thus less sensitive to dust and young stars, (2) the field of view of WFPC2/PC1 is larger than that of ACS/HRC and NICMOS, and (3) its point-spread function (PSF) has less extended wings that NICMOS. A single 500 s exposure was obtained on 21 July 1994 (Proposal ID: 5479), with UM 625 placed near the center of the Planetary Camera detector (PC1), which has a plate scale of 0046 pixel-1. We remove cosmic rays using LA Cosmic333http://www.astro.yale.edu/dokkum/lacosmic/ (van Dokkum 2001), which can detect cosmic ray hits of arbitrary shape and size. Two of the pixels in the center of the galaxy are saturated; we masked them out in the analysis below.
Precise sky subtraction is of great importance to obtain accurate photometric
measurements and structural decomposition. From the surface brightness
profile of the SDSS -band image,
![[Uncaptioned image]](/html/1304.5807/assets/x5.png)
Radial surface brightness profile of UM 625 extracted from the HST WFPC2/PC1 F606W image (red crosses). The profile with the star-forming ring masked is displayed with black dots (with error bars). For comparison we also plot the profile of the PSF created by TinyTim (blue dotted line) and the PSF profile from a star taken from the WFPC2 PSF library (orange diamonds). The PSF profiles are scaled to have the same central surface brightness as UM 625. The green squares represent the SDSS -band profile with sky subtracted.
we know that UM 625 extends close to a radius of , which means that it fills nearly the entire field of PC1 (radius ). We estimate the background level and its uncertainty from the outermost edges of the PC1 chip and from the flanking WF2 chips; the limiting surface brightness of the F606W image is 25.31 . To examine the effect of the star-forming ring on the underlying galaxy structure, we also plot the surface brightness profile with the ring region (the region enclosed by the green polygon as indicated in Figure 2) masked out. Figure 4 shows that the circumnuclear star-forming region mainly affects the profile on scales of 0208; the outer profile () agrees well with the SDSS -band profile.
Separating the central AGN light from the host galaxy starlight requires knowing the PSF to a high accuracy. Unfortunately there is no bright star in the field. According to the image simulations of Kim et al. (2008), a synthetic PSF generated by the TinyTim software (Krist 1995) works reasonably well. We have also searched for empirical stellar PSFs from the WFPC2 PSF Library444http://www.stsci.edu/hst/wfpc2/software/wfpc2-psf-form.html and chosen the one closest to the location of UM 625 on PC1. As shown in Figure 4, the stellar PSF agrees well with the TinyTim PSF, except in the outer regions where the empirical PSF is much noisier. For the rest of the analysis, we simply adopt the TinyTim PSF.
After background subtraction, we perform a two-dimensional (2-D) decomposition of UM 625 using GALFIT (Peng et al. 2002, 2010). The AGN is represented by a point source modeled with the TinyTim PSF, and the galaxy is modeled by bulge, fit with a Sérsic (1968) function, and a disk, fit with an exponential function (equivalent to ). A single-component model for the host leaves unacceptably large
![[Uncaptioned image]](/html/1304.5807/assets/x6.png)
One-dimensional representation of the three-component 2-D GALFIT model applied to the WFPC2/F606W image of UM 625: PSF for the nucleus (black dotted line), Sérsic function for the bulge (red dashed line), and an exponential function for the disk (blue dot-dashed line). The sum of the three components is shown as the black solid line. The observed data are plotted as black symbols with error bars. The bottom panel shows the residuals between the data and the best-fit model.
residuals. The best-fitting two-component model (Figure 5) gives a central component with Sérsic index and effective radius 137 (693 pc), and a disk with scale length of 386 (1.95 kpc), consistent with the results from the 1-D decomposition of the SDSS -band image. The bulge-like component is mildly disky, with . The best-fit parameters are summarized in Table 2. We identify the central component with a pseudobulge, because pseudobulges generally have (Kormendy & Kennicutt 2004). The residual image (top right panel of Figure 2) reveals a faint ring-shaped structure on the eastern side of the galaxy, opposite to the masked ring region.
3.3 HST: NUV Image
The F330W image was observed on 21 March 2003 using ACS/HRC as part of a study on the starburst–AGN connection (Proposal ID: 9379). ACS is located away from the optical axis of HST, and so it suffers from significant geometric distortion that is not corrected by the internal optics. For ease of rejecting cosmic rays, the total exposure was divided into two equal exposures of 10 min each. These images are then combined using astrodrizzle555http://drizzlepac.stsci.edu/, a new software replacing multidrizzle, to remove cosmic ray hits and to correct for the geometric distortion. The pixel scale of the combined image is 0025. A narrow ring-like star-forming region, ornamented with several bright knots, encircles nearly half the nucleus. We begin with creating two synthetic PSFs for each exposure using TinyTim. They are centered in the same position as the nucleus
![[Uncaptioned image]](/html/1304.5807/assets/x7.png)
in the HRC image to properly reproduce the geometric changes involved in the processing. During the modeling, we have also considered the dofocus offset (m) given by web-based model666http://www.stsci.edu/hst/observatory/focus/FocusModel. We did not include the offset information for the F606W image because it is only available for data taken after 2003.. The offset is mostly due to spacecraft breathing effects. The two TinyTim PSFs, still distorted, are almost identical except for slightly differences due to defocus offsets. We combined them with astrodrizzle in the same manner as the science images, producing a distortion-corrected PSF image.
We decompose the image using GALFIT with the region containing the star-forming ring masked out. Due to the small field of view of the ACS/HRC (26″29″), we cannot independently measure the sky background; we set it as a free parameter in the fit. Nor can be obtain any meaningful, independent constraint on the parameters of the disk. Our initial attempt to fit the image with a PSF + Sérsic + disk model failed to converge. As our primary goal for the F330W image is to measure the brightness of the nucleus, we simply set the disk scale length to be identical to that obtained from the F606W fit. The resulting fit yields a bulge with and 102 (515 pc), and a point source flux that is very insensitive to the assumptions of the disk component. The AGN magnitude changes by only mag depending on whether the disk is included or not. If we further force the bulge to have the same and as derived from the F606W fit (i.e. allowing only the luminosity to adjust), the resulting AGN magnitude changes by 0.06 mag.
3.4 HST: NIR Image
The NICMOS/NIC1 F160W image was observed on 31 July 1997 (Proposal ID: 7328), in three 256 s exposures dithered in an “L”-shaped pattern. Each exposure was processed with the standard pipeline calnica within IRAF/STSDAS. This task corrects for the nonlinearity of the detector and removes the bias value, dark current, amplifier glow, and shading; however, it does not remove the ghost “pedestal” effect produced by the variable quadrant bias (see, e.g., Hunt & Malkan, 2004). To correct for this effect, we apply the pedsub task to the calibrated image, quadrant by quadrant, determine the shifts of the dithered images with xregister, register them with imshift, and finally combine them with imcombine.
UM 625 extends far beyond the field of view of NIC1. In spite of this, a GALFIT model consisting of a PSF + Sérsic bulge can still give a fairly robust measurement of the nuclear magnitude. During the fitting, we set the background free and masked the ring region as before. It proved to be impossible to independently measure the disk component at all. Since we know from the optical images that a disk is present, we constrain it by fixing its structural parameters to those derived from the F606W image and normalizing its luminosity such that mag, a value typical of disks (e.g., MacArthur et al. 2004). However, we note that none of the parameters for the bulge or the AGN point source are significantly affected by our assumptions for the disk component. The best-fit model
yields and 098 (491 pc) for the bulge. If we fix the bulge and to the values derived from the F606W fit, the AGN magnitude changes by 0.21 mag.
4 Other Multiwavelength Data
4.1 X-ray Observations
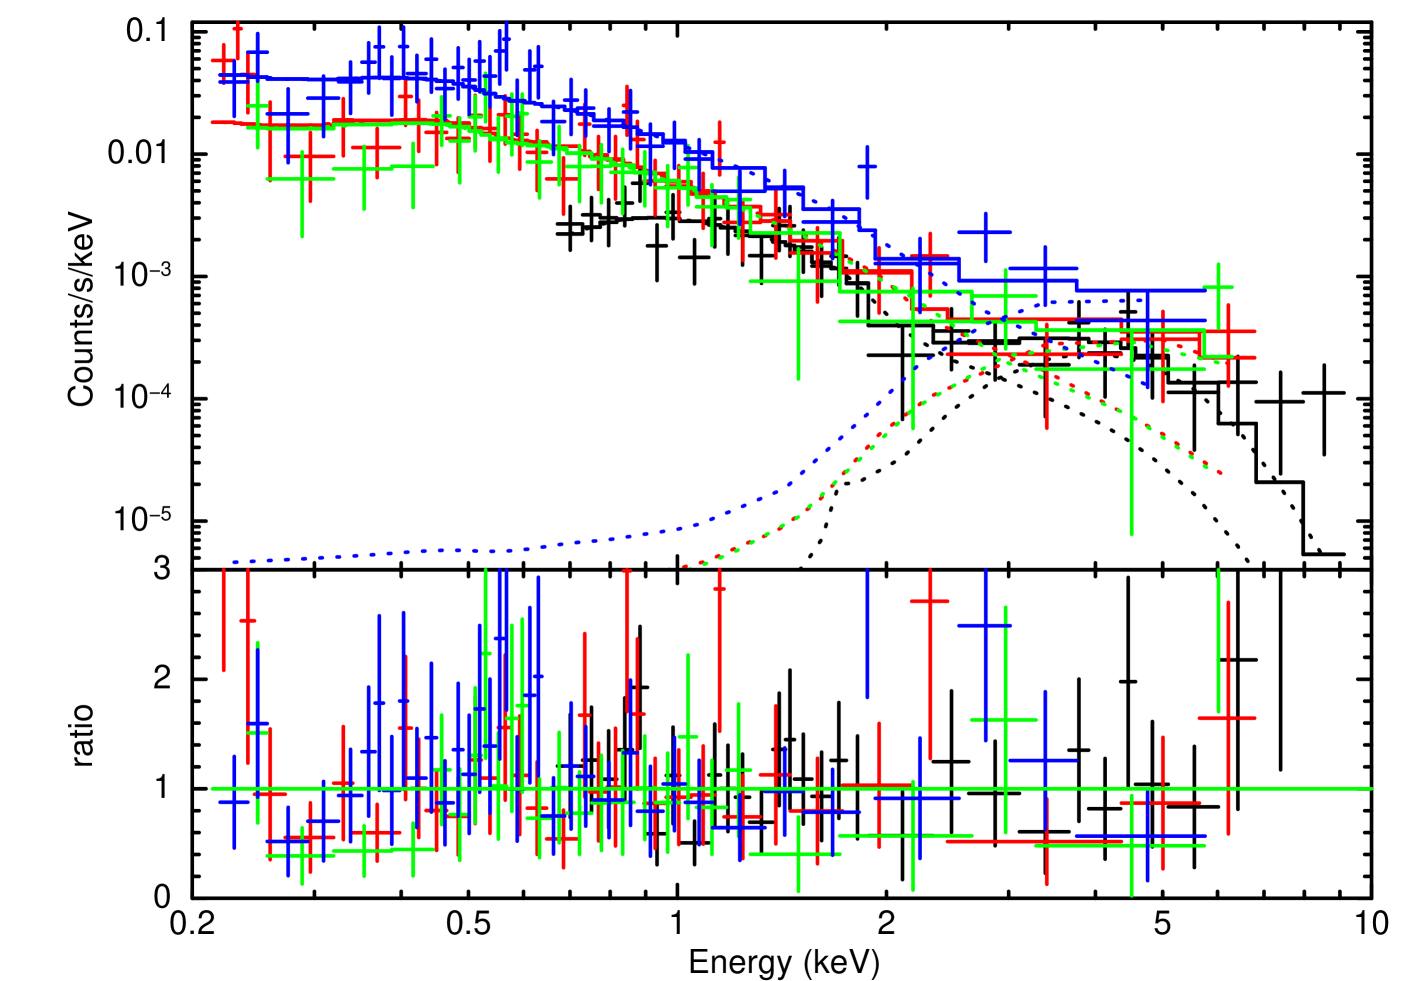
UM 625 was observed by XMM-Newton on three separate occasions between 2004 and 2008 (ObsID: 0200430901, 0505930101, 0505930401) and once by Chandra in 2008 (ObsID: 9557). We used XMM-Newton SAS version 12.0.1 and the calibration file of June 2012 to reduce the EPIC PN (Strüder et al. 2001) archival data. After filtering background flares, the net exposure times are 6.4 ks, 13 ks, and 13 ks, respectively, for the three PN observations. The source was detected at a large offset angle () from the field center for the later two PN observations. To extract the source and background spectra, we defined the source region as a circle with radius centered at the source position and the background regions as three or four circles, far removed from the CCD edges and other sources, with radii around the source region. The Chandra ACIS-S (Garmire et al. 2003) data were reduced with CIAO 4.4.1 (Fruscione et al. 2006) and the CALDB 4.4.10 database, adopting standard procedures. The net exposure time was 49 ks. Because of the large off-axis angle (106), we extracted the spectra using a 20″-radius circle for the source and four circles around the source region for the background. All XMM-Newton and Chandra spectra were rebinned to have a minimum of 5 counts in each energy bin after background subtraction, and they were fit simultaneously with the same models using Xspec (Arnaud 1996). In view of the low source counts, we fit the spectra using the Cash-statistic instead of .
We first fit the spectra over the energy range 0.2–10 keV using a single absorbed power-law model with the minimum absorption set to the Galactic value of (Kalberla et al. 2005). The fit yields a column density equal to the Galactic value, a photon index , and C-statistic = 145 (125 degrees of freedom). The residuals, however, clearly show a flat, hard excess above 3 keV, which implies that an obscured component exists. We then added an absorbed power-law component with a photon index fixed to , typical of AGNs (Shemmer et al. 2008; Constantin et al. 2009). As shown in Figure 6, the fit is improved significantly, resulting in C-statistic = 116 (123 degrees of freedom). The soft-band power law, with , is slightly steeper than the previous fit. The absorption column density of the absorbed power-law component is . The observed 0.5–2 keV and 2–10 keV fluxes are and erg s-1 cm-2, corresponding to and erg s-1, respectively. Assuming that the obscured power-law component is the intrinsic emission from the corona, the unabsorbed 2–10 keV flux is erg s-1 cm-2, corresponding to erg s-1. The monochromatic flux at 2 keV is erg s-1 cm-2 Hz-1. As the spectra are cut off above 10 keV and no variations are detected in each single exposure or among the four exposures, we cannot exclude the possibility that the absorption is Compton-thick.
If we link the spectral slope of the hard component to the soft one, we obtain , , and a scattering fraction of if we attribute the soft component to scattered nuclear emission. We note that this fraction is consistent with those commonly reported in other obscured AGNs (; Noguchi et al . 2010).
4.2 Ultraviolet Observations
The Optical Monitor (OM) on XMM-Newton took data for UM 625 in the UVW1 (2910 Å) and UVW2 (2120 Å) filters, each for 1 ks, during the 2004 X-ray observations. Because of the coarse resolution of the OM (PSF 18), the nucleus is not resolved from the host galaxy, and we consider these global (AGN plus host) flux measurements. We adopt an aperture radius of 10″ to compute the source flux after estimating the sky background from the region between a radius of 15″ and 20″. The flux is corrected for Galactic extinction using the maps of Schlegel et al. (1998) and the reddening curve of Fitzpatrick (1999), resulting in (2910 Å)= erg s-1 cm-2 Hz-1 and (2120 Å)= erg s-1 cm-2 Hz-1.
Apart from the XMM-Newton OM data, UM 625 was also imaged simultaneously in the near-UV (NUV; 2316 Å) and far-UV (FUV; 1539 Å) bands of GALEX during its All-sky Imaging Survey (AIS), for a total exposure time of 112 s on 6 April 2004. UM 625 was later reobserved during the Medium Imaging Survey (MIS) on 18 May 2009, for a total of 1578 s; we adopt the MIS data (Bianchi et al. 2012). After correcting for Galactic extinction, we obtain an NUV flux density of (2316 Å)= erg s-1 cm-2 Hz-1 and an FUV flux density of (1539 Å)= erg s-1 cm-2 Hz-1. The NUV flux density is slightly larger than that of the OM UVW2 band, whose effective wavelength is only Å shorter.
4.3 Radio Observations
UM 625 was detected by Faint Images of the Radio Sky at Twenty-cm (FIRST; Becker et al. 1995) using the Very Large Array in its B configuration. The peak and integrated 20 cm flux density from the FIRST catalog777http://sundog.stsci.edu/cgi-bin/searchfirst (White et al. 1997) is 1.89 and 2.69 mJy, corresponding to a monochromatic radio luminosity at 20 cm of and . These measurements are derived by fitting a 2-D Gaussian function to the source, using a map generated from twelve coadded images adjacent to the pointing center; the map has 18 pixel-1, a resolution of FWHM = 5″, and an rms noise of 0.152 mJy beam-1. Customarily, the radio-loudness parameter is defined as the ratio of flux densities between 6 cm and 4400 Å. Assuming a radio spectral index (Lal & Ho 2010), erg s-1 cm-2 Hz-1, which, in combination with Å) determined from the SDSS spectral fitting, gives . Although UM 625 is formally radio-quiet according to the widely used division of for radio-loud and radio-quiet AGNs (Kellermann et al. 1989), its level of radio activity is still somewhat unusual for low-mass AGNs (e.g., Greene et al. 2006).
4.4 Infrared Observations
UM 625 is also contained in the Infrared Astronomical Satellite (IRAS) faint source catalog (Moshir et al. 1990). The faint source catalog contains data for point sources in unconfused regions with flux densities typically above 0.2 Jy at 12, 25, and m, and above 1.0 Jy at m. UM 625 is reliably detected at m with a flux density of Jy, but only upper limits are given for the other three bands (0.13, 0.12, and 0.77 Jy for 12, 25, and m, respectively).
Wide-field Infrared Survey Explorer (WISE; Wright et al. 2010), the mission most comparable to IRAS yet with a sensitivity more than 100 times higher at m, has mapped the entire sky in four bands centered at 3.4, 4.6, 12, and m. UM 625 is detected with high S/N in all four bands, with a flux density, converted from the magnitudes in the WISE All-sky Source Catalog, of 4.1, 4.2, 24, and 95 mJy, respectively.
For completeness, we take the following NIR magnitudes from the Two Micron All Sky Survey point source catalog (Skrutskie et al. 2006): and mag, which correspond to a flux density of 3.3, 3.8, and 3.4 mJy, respectively.
5 Results and Discussion
5.1 Black Hole Mass
With the detection of broad emission lines, we can estimate the mass of the central BH using commonly used virial mass estimators for broad-line AGNs. We calculate the virial BH mass using the H formalism given in Xiao et al. (2011; their Equation 6), which is based on Greene & Ho (2005b, 2007b) but updated with the more recent relationship between BLR size and luminosity of Bentz et al. (2009). For FWHM(H) = 1801 and a broad H luminosity of erg s-1, , which justifies inclusion in the low-mass BH sample of Dong et al. (2012b).
The uncertainty of the above BH mass estimate is not well understood. As pointed out by Vestergaard & Peterson (2006), the statistical accuracy of the masses from single-epoch virial mass estimators is a factor of (), and, for individual mass estimates, the uncertainty can be as large as an order of magnitude. We note that recently Wang et al. (2009) recalibrated the BH mass formulas based on single-epoch spectra, stressing the nonlinear relation between the virial velocity of the BLR clouds and the FWHM of single-epoch broad emission lines. This nonlinearity probably arises from several kinds of nonvirial components incorporated into the total profile of broad emission lines in single-epoch spectra (see §4.2 of Wang et al. [2009] for a detailed discussion, as well as Collin et al. [2006] and Sulentic et al. [2006]). The formulas of Wang et al. (2009), calibrated using reverberation mapping data available to date, which span the mass range from to , does not cover the low-mass regime of interest in this paper. Furthermore, we would like to point out that nonvirial components, if any, may be less significant in UM 625 than in other AGNs because its broad H profile is roughly symmetrical and close to a Gaussian.
5.2 Host Galaxy
The abundant archival HST images covering a wide wavelength baseline provide us an excellent opportunity to study the host galaxy of UM 625 with the central AGN point source removed. Our 2-D decomposition of the optical (F606W, band) WFPC2/PC1 shows that the stellar distribution consists of two main components: (1) a dominant compact, bulge-like component with Sérsic , , and mag; (2) an extended disk () component with a scale length of kpc. The disk is more evident in the SDSS -band image owing to its deeper limiting surface brightness and larger field of view, but its photometric parameters are well recovered with the WFPC2/PC1 image alone. The very limited field of view of the ACS/HRC and NICMOS/NIC1 images prevent us from placing any meaningful constraints on the disk in the UV and NIR. We suspect that even the structural parameters of the bulge may be partly compromised in these bands as a result of the small field size.
Taking the F606W decomposition as reference, the bulge-to-total light ratio () in the band is 0.66. If we use a total host luminosity calculated from the SDSS -band image (after subtracting the AGN point source derived from the HST decomposition), which may be more reliable because of its larger field of view, the bulge-to-total ratio reduces slightly to . Either of these values lies within the range of for S0 galaxies (e.g., Simien & de Vaucouleurs 1986), in agreement with the absence of spiral arms in the main disk of the galaxy. The star-forming ring, which resembles a tightly wound spiral, in UM 625 is located in the circumnuclear region ( kpc) resolved only by HST observations. Interestingly, the UV-optical and optical-NIR colors of the bulge of UM 625 are much bluer than those of typical S0 galaxies; they more closely resemble those of an Sb spiral. This is apparent from comparing the observed F330WF606W and F606WF160W colors with synthetic colors calculated using calcphot in IRAF/SYNPHOT package for various galaxy templates (Kinney et al. 1996; Polletta et al. 2007).
In view of its blue color, low Sérsic index (), and disky isophote shape (), the bulge of UM 625 can be convincingly categorized as a pseudobulge, commonly present in low-luminosity disk galaxies, including some S0s (see Kormendy & Kennicutt 2004 for a review). The presence of an ongoing central star formation, manifested through the nuclear star-forming ring (Section 5.3), further supports the pseudobulge interpretation. This is consistent with previous studies, which find that the majority of the host galaxies of low-mass BHs with disks are likely to contain pseudobulges rather than classical bulges (Greene et al. 2008; Jiang et al. 2011b). The only possible anomaly is that UM 625 has a much higher than usual; for example, the objects in the sample of Jiang et al. (2011b) with a detected disk component have an average .
5.3 Nuclear Star-forming Ring
As mentioned above, the circumnuclear region of UM 625 contains a blue ( mag, corrected for Galactic extinction) semi-ring on scales of pc. It is most prominent in the NUV (F330W) band, which shows a number of bright, compact knots, reminiscent of star-forming galaxies with nuclear hotspots (e.g., Barth et al. 1995). Assuming that the UV light mainly arises from young stars, we can use the integrated luminosity to estimate the star formation rate. Summing the flux of the residuals above the smooth galaxy model within the ring region (green polygon in Figure 2) yields a luminosity of erg s-1 Hz-1 after correcting for Galactic extinction, which corresponds to a star formation rate of 0.28 yr-1 (Kennicutt 1998; his Equation 1). As a check, aperture photometry between radius 015 and in the residual image yields nearly the same flux, only 0.02 magnitude higher.
Given that the central region of UM 625 experiences significant ongoing star formation, as evidenced by the UV light, it is interesting to note that some of the narrow emission lines, especially the Balmer lines, are inevitably contaminated by stellar photoionization. From Equation (2) of Kennicutt (1998), a star formation rate of yr-1 produces an H luminosity of erg s-1, which is roughly half of the total observed narrow H emission. This is nonnegligible.
The star-forming region can potentially contaminate the emission in the radio and X-ray bands as well, due to the contribution from high-mass X-ray binaries, young supernova remnants, and hot interstellar plasma. According to the empirically calibrated linear relation between star formation rate and X-ray luminosity of Ranalli et al. (2003), the ring region produces erg s-1; this is only a few percent of the observed X-ray luminosity, and so the AGN totally dominates the X-ray emission. By contrast, the Ranalli et al.’s relation between star formation rate and radio emission predicts erg s-1 Hz-1, which is nearly 30% of the integrated monochromatic radio power detected by FIRST.
5.4 X-ray Spectral Properties
Although the detection of broad H and H qualifies UM 625 as a type 1 AGN, its X-ray spectrum indicates that it contains a significant intrinsic absorbing column density of . This apparent disagreement between optical and X-ray classification is not uncommon (e.g., Garcet et al. 2007), as it can arise if the gas responsible for the X-ray absorption is highly ionized, instead of neutral, so that the accompanying dust would sublimate to yield a much smaller dust-to-gas ratio. Indeed, such absorbed type 1 AGNs are usually characterized by either complex or warm/ionized absorption (Malizia et al. 2012) arising from ionized gas possibly associated with a disk wind (Murray et al. 1995) or ionization cones as seen in some objects.
The ratio between 2–10 keV luminosity to extinction-corrected [O III] luminosity is also a powerful diagnostic of nuclear X-ray obscuration. Previous studies have suggested that objects with are invariably Compton-thick, whereas objects with are almost exclusively Compton-thin or unobscured (Guainazzi et al. 2005). With observed erg s-1 and an extinction-corrected erg s-1, , placing UM 625 intermediate between Compton-thick and Compton-thin.
The power-law component for the soft X-ray band is likely different from the soft X-ray excess commonly seen in type 1 AGNs since it should have been largely obscured, if present. It could arise from a scattered component from the nucleus or contamination from the host galaxy; the contribution from the star-forming ring is negligible (Section 5.3). For AGNs with low-mass BHs, thermal emission from the accretion disk can also contribute significantly to the soft X-ray band (e.g., Thornton et al. 2008; Miniutti et al. 2009). We have tried to fit our X-ray data using a (disk) blackbody model, but the data quality is insufficient to reach meaningful conclusions regarding the nature of the soft X-rays.
5.5 Spectral Energy Distribution and Bolometric Luminosity
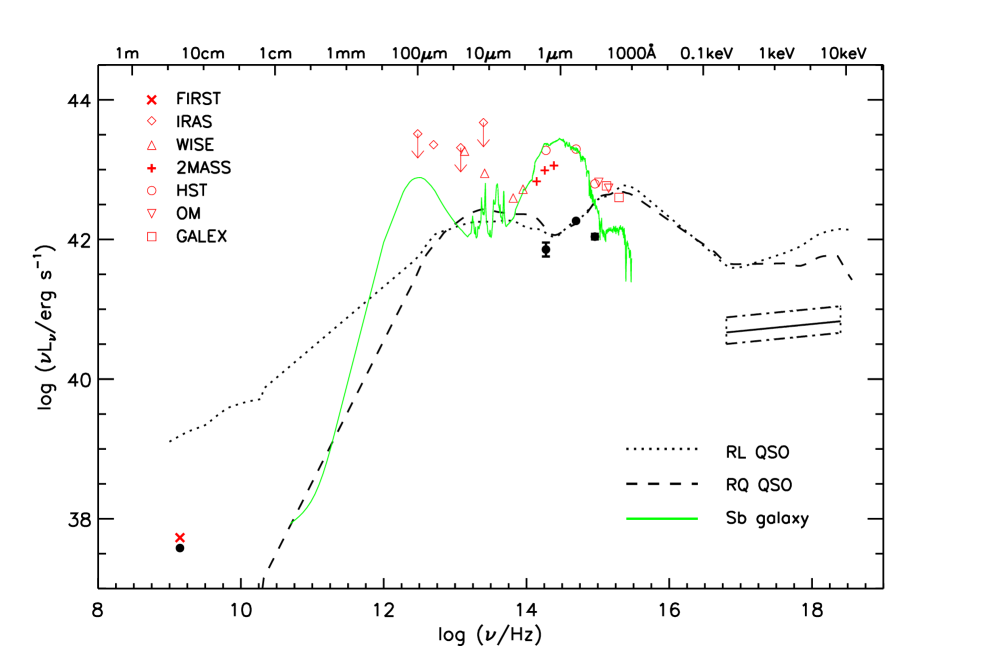
We combine all of the photometric data of UM 625 described in Sections 3 and 4 to construct its broad-band SED (Figure 7); apart from NGC 4395 and POX 52, this is one of the most complete SEDs available for low-mass AGNs. The median SEDs of radio-quiet and radio-loud quasars (Elvis et al. 1994), scaled to UM 625 in the optical band, are overplotted for comparison.
Even after correcting for absorption, the X-ray emission of UM 625 is still somewhat weak compared with the median SED of quasars. The optical-to-X-ray slope is , where we adopt the standard definition Å)/ (Tananbaum et al. 1979) and estimate Å) from Å) assuming an optical-UV continuum spectral index of (Vanden Berk et al. 2001)888The specific flux at 5100 Å is derived directly from our SDSS spectral fit. If, instead, we estimate Å) from the H flux (Greene & Ho 2005b), we obtain for the total (narrow plus broad)H flux and for the broad component alone.. By contrast, previous X-ray studies of low-mass AGNs indicate that is, on average, larger than in high-mass AGNs (e.g., Greene & Ho 2007a; Miniutti et al. 2009; Desroches et al. 2009; Dong et al. 2012a), falling systematically below the low-luminosity extension of the -Å) relation of Steffen et al. (2006). The previous samples span a wide range in , from to . Thus, UM 625 lies among the weakest X-ray sources with the lowest . The origin of the X-ray weakness is not known. Some may be simply highly absorbed, but others may be intrinsically X-ray weak (Dong et al. 2012a). UM 625 may belong to the latter category.
Low-mass AGNs appear to be exceptionally radio-quiet, if not radio-silent. In a Very Large Array 6 cm survey of the 19 low-mass AGNs from Greene & Ho (2004), Greene et al. (2006) detected radio emission from only one (%), which has =2.8. This detection rate is approximately the same as that found in the larger sample of Greene & Ho (2007b), whose detected sources have . UM 625 is clearly detected at 20 cm, at . Even after correcting for possible contamination from star formation (Section 5.3), the source still has . While UM 625 is, strictly speaking, not radio-loud, it is still somewhat unusual in that it belongs to the minority of low-mass AGNs that show any radio emission at all.
Despite the fact that the SED of UM 625 still contains many gaps in wavelength coverage, it should still offer a more reliable measurement of the bolometric luminosity of the system than any estimate based on a single band. Integrating the median radio-quiet quasar SED of Elvis et al. (1994) after scaling it to the nuclear optical point derived from HST for UM 625, we obtain = erg s-1, which corresponds to / = 0.11 for ; had we chosen the radio-loud SED template instead of the radio-quiet one, these values would be 8% higher. Since the SED of UM 625 does not, in fact, exactly match the standard shape of the quasar templates, an alternative approach is to simply perform a piecewise power-law integration of the observed points (from radio to X-ray). This yields a bolometric luminosity that is lower by a factor 5, reducing / to 0.02. Yet a third estimate can be obtained from the strength of the H emission, which scales with the optical continuum emission (e.g., Greene & Ho 2005b), and hence with assuming some canonical bolometric correction for the optical band. Following the formalism of Greene & Ho (2007b), the total (broad plus narrow) H luminosity of erg s-1 leads to = erg s-1 and / = 0.14. 999Dong et al. (2012b) give / = 0.04 using the same technique, except that they estimate only using the broad component of H, which is 3 times lower than the narrow component H. Here we use total H while the narrow H is seriously contaminated by the star-forming ring as calculated in section 5.3. Our strategy is to give a reliable range of and / taking all results into consideration. To summarize, UM 625 is estimated to have erg s-1 and , which is between the values for NGC 4395 and POX 52.
5.6 Black Hole–Bulge Connection
We end with a short discussion concerning the connection between the mass of the central BH in UM 625 and the properties of the bulge of its host galaxy. While the SDSS spectrum (Figure 1) does have detected stellar absorption features, we are not confident that we have resolved them well enough to trust the stellar velocity dispersion derived from the continuum fitting (Section 2). In lieu of the stars, we use the velocity dispersion of the narrow-line gas as traced by the low-ionization lines [S II] 6716, 6731, which are resolved, to estimate the stellar velocity dispersion (Greene & Ho 2005a; Ho 2009). For , the – relation of Gültekin et al. (2009; their Equation 7) implies = . The more recent extension of the – relation to the low-mass end by Xiao et al. (2011) yields = . Both of these estimates are in surprisingly good agreement with our virial mass estimate, = , based on the broad H line (Section 5.1).
By contrast, and in line with other investigations of low-mass AGNs (Greene et al. 2008; Jiang et al. 2011a), the BH in UM 625 deviates strongly from the BH mass–bulge luminosity relation of inactive galaxies. Assuming a spectrum of an Sb galaxy (Kinney et al. 1996), the F606W magnitude of the bulge corresponds to mag, from which the – relation of Gültekin et al. (2009; their Equation 8) predicts , nearly 15 times larger than the virial estimate.
Now, we know that the stellar population of the pseudobulge in UM 625 is quite young, most likely significantly younger than the majority of the more massive galaxies used to define the – relation. A proper comparison, therefore, requires that we apply a correction for age or mass-to-light ratio to the bulge luminosity of UM 625. Assuming, as before, an Sb galaxy spectrum, for which mag (Fukugita et al. 1995), which, in fact, agrees closely with mag as measured by Salzer et al. (1989), a simple stellar population of solar metallicity predicts an age of Gyr and a mass-to-light ratio / (Bruzual & Charlot 2003). For a typical elliptical galaxy, with mag, /. Applying this age correction reduces the -band luminosity by about a factor of 4 and the predicted BH mass by about a factor of 5. Although the mass discrepancy is now lower, the pseudobulge of UM 625, like other pseudobulges containing low-mass BHs (Greene et al. 2008; Jiang et al. 2011a), systematically deviate from the – relation of classical bulges and elliptical galaxies. Kormendy et al. (2011) suggest that that there are two different modes of accretion: BHs in classical bulges and ellipticals grow rapidly via merger-driven gas infall; in contrast, BHs hosted in pseudobulges grow mainly via secular evolution through slower, stochastic processes.
Finally, we note that the pseudobulge of UM 625, as in the hosts of other low-mass AGNs (e.g. Greene et al. 2008; Jiang et al. 2011b), deviates from the Faber-Jackson relation (Faber & Jackson 1976) of classical bulges and elliptical galaxies, in the sense that it has a lower for a given luminosity. With an -band absolute magnitude of (assuming, as before, a spectrum of an Sb galaxy), the Faber-Jackson relation of inactive early-type galaxies (Table 5 of Jiang et al. 2011b) predicts , nearly twice the observed value inferred from .
6 Summary
We conducted a comprehensive, multiwavelength study of the nuclear and host galaxy properties of UM 625, a type 1 AGN with a BH mass of determined through the detection of broad H emission.
Analysis of Chandra and XMM-Newton observations reveals a heavily absorbed () nucleus with an intrinsic X-ray luminosity of erg s-1. The source may be intrinsically X-ray weak () compared to higher luminosity AGNs. UM 625 belongs to a minority of low-mass AGNs detected in the radio, but it is not strong enough to qualify as radio-loud. In combination with nuclear photometry at UV, optical, and NIR bands extracted from high-resolution HST images, the broad-band SED constrains the bolometric luminosity to erg s-1 and .
We performed a comprehensive analysis of SDSS and HST images to quantify the structure and morphology of the host galaxy. The galaxy is an isolated, undisturbed, nearly face-on S0 galaxy with a prominent pseudobulge (Sérsic index ) that accounts for 60% of the total light in the band. The pseudobulge has relatively blue colors ( mag) and is mildly disky. Embedded within the central pc is a UV-bright semi-ring forming stars at a rate of 0.3 yr-1. Consistent with other low-mass AGNs, UM 625 follows the – relation but not the – relation of inactive galaxies.
References
- Adelman-McCarthy et al. (2006) Adelman-McCarthy, J. K., Agüeros, M. A., Allam, S. S., et al. 2006, ApJS, 162, 38
- Arnaud (1996) Arnaud, K. A. 1996, in Astronomical Data Analysis Software and Systems V, ed. G. Jacoby & J. Barnes (San Francisco: ASP), 17
- Baldwin et al. (1981) Baldwin, J. A., Phillips, M. M., & Terlevich, R. 1981, PASP, 93, 5
- Barth et al. (2005) Barth, A. J., Greene, J. E., & Ho, L. C. 2005, ApJ, 619, L151
- Barth et al. (1995) Barth, A. J., Ho, L. C., Filippenko, A. V., & Sargent, W. L. 1995, AJ, 110, 1009
- Barth et al. (2004) Barth, A. J., Ho, L. C., Rutledge, R. E., & Sargent, W. L. W. 2004, ApJ, 607, 90
- Becker et al. (1995) Becker, R. H., White, R. L., & Helfand, D. J. 1995, ApJ, 450, 559
- Bentz et al. (2009) Bentz, M. C., Peterson, B. M., Netzer, H., Pogge, R. W., & Vestergaard, M. 2009, ApJ, 697, 160
- Bertin & Arnouts (1996) Bertin, E., & Arnouts, S. 1996, A&AS, 117, 393
- Bianchi et al. (2012) Bianchi, L., Herald, J., Efremova, B., et al. 2012, VizieR Online Data Catalog, 2312, 0
- Bruzual & Charlot (2003) Bruzual, G., & Charlot, S. 2003, MNRAS, 344, 1000
- Campos-Aguilar et al. (1993) Campos-Aguilar, A., Moles, M., & Masegosa, J. 1993, AJ, 106, 1784
- Collin et al. (2006) Collin, S., Kawaguchi, T., Peterson, B. M., & Vestergaard, M. 2006, A&A, 456, 75
- Constantin et al. (2009) Constantin, A., Green, P., Aldcroft, T., et al. 2009, ApJ, 705, 1336
- Denney et al. (2009) Denney, K. D., Watson, L. C., Peterson, B. M., et al. 2009, ApJ, 702, 1353
- Desroches et al. (2009) Desroches, L.-B., Greene, J. E., & Ho, L. C. 2009, ApJ, 698, 1515
- Dessauges-Zavadsky et al. (2000) Dessauges-Zavadsky, M., Pindao, M., Maeder, A., & Kunth, D. 2000, A&A, 355, 89
- Dewangan et al. (2008) Dewangan, G. C., Mathur, S., Griffiths, R. E., & Rao, A. R. 2008, ApJ, 689, 762
- Dong et al. (2012) Dong, R., Greene, J. E., & Ho, L. C. 2012a, ApJ, 761, 73
- Dong et al. (2012) Dong, X.-B., Ho, L. C., Yuan, W., et al. 2012b, ApJ, 755, 167
- Dong et al. (2008) Dong, X., Wang, T., Wang, J., et al. 2008, MNRAS, 383, 581
- Dong et al. (2007) Dong, X., Wang, T., Yuan, W., et al. 2007, ApJ, 657, 700
- Dong et al. (2005) Dong, X.-B., Zhou, H.-Y., Wang, T.-G., et al. 2005, ApJ, 620, 629
- Elvis et al. (1994) Elvis, M., Wilkes, B. J., McDowell, J. C., et al. 1994, ApJS, 95, 1
- Erwin et al. (2008) Erwin, P., Pohlen, M., & Beckman, J. E. 2008, AJ, 135, 20
- Faber & Jackson (1976) Faber, S. M., & Jackson, R. E. 1976, ApJ, 204, 668
- Ferrarese & Merritt (2000) Ferrarese, L., & Merritt, D. 2000, ApJ, 539, L9
- Filippenko & Ho (2003) Filippenko, A. V., & Ho, L. C. 2003, ApJ, 588, L13
- Filippenko et al. (1993) Filippenko, A. V., Ho, L. C., & Sargent, W. L. W. 1993, ApJ, 410, L75
- Filippenko & Sargent (1989) Filippenko, A. V., & Sargent, W. L. W. 1989, ApJ, 342, L11
- Fitzpatrick (1999) Fitzpatrick, E. L. 1999, PASP, 111, 63
- Fruscione et al. (2006) Fruscione, A., McDowell, J. C., Allen, G. E., et al. 2006, Proc. SPIE, 6270,60
- Fukugita et al. (1995) Fukugita, M., Shimasaku, K., & Ichikawa, T. 1995, PASP, 107, 945
- Garcet et al. (2007) Garcet, O., Gandhi, P., Gosset, E., et al. 2007, A&A, 474, 473
- Garmire et al. (2003) Garmire, G. P., Bautz, M. W., Ford, P. G., Nousek, J. A., & Ricker, G. R., Jr. 2003, Proc. SPIE, 4851, 28
- Gebhardt et al. (2000) Gebhardt, K., Bender, R., Bower, G., et al. 2000, ApJ, 539, L13
- Gebhardt et al. (2000) Gebhardt, K., Kormendy, J., Ho, L. C., et al. 2000b, ApJ, 543, L5
- Greene& Ho (2004) Greene, J. E., & Ho, L. C. 2004, ApJ, 610, 722
- Greene & Ho (2005) Greene, J. E., & Ho, L. C. 2005a, ApJ, 627, 721
- Greene & Ho (2005) Greene, J. E., & Ho, L. C. 2005b, ApJ, 630, 122
- Greene & Ho (2006) Greene, J. E., & Ho, L. C. 2006, ApJ, 641, L21
- Greene & Ho (2007) Greene, J. E., & Ho, L. C. 2007a, ApJ, 656, 84
- Greene & Ho (2007) Greene, J. E., & Ho, L. C. 2007b, ApJ, 670, 92
- Greene et al. (2008) Greene, J. E., Ho, L. C., & Barth, A. J. 2008, ApJ, 688, 159
- Greene et al. (2006) Greene, J. E., Ho, L. C., & Ulvestad, J. S. 2006, ApJ, 636, 56
- Greene et al. (2010) Greene, J. E., Peng, C. Y., Kim, M., et al. 2010, ApJ, 721, 26
- Guainazzi et al. (2005) Guainazzi, M., Matt, G., & Perola, G. C. 2005, A&A, 444, 119
- Gültekin et al. (2009) Gültekin, K., Richstone, D. O., Gebhardt, K., et al. 2009, ApJ, 698, 198
- Häring & Rix (2004) Häring, N., & Rix, H.-W. 2004, ApJ, 604, L89
- Ho (2008) Ho, L. C. 2008, ARA&A, 46, 475
- Ho (2009) Ho, L. C. 2009, ApJ, 699, 638
- Ho et al. (1993) Ho, L. C., Filippenko, A. V., & Sargent, W. L. W. 1993, ApJ, 417, 63
- Ho et al. (1997) Ho, L. C., Filippenko, A. V., & Sargent, W. L. W. 1997, ApJS, 112, 315
- Hopkins et al. (2004) Hopkins, P. F., Strauss, M. A., Hall, P. B., et al. 2004, AJ, 128, 1112
- Hunt & Malkan (2004) Hunt, L. K., & Malkan, M. A. 2004, ApJ, 616, 707
- Jiang et al. (2011) Jiang, Y.-F., Greene, J. E., & Ho, L. C. 2011a, ApJ, 737, L45
- Jiang et al. (2011) Jiang, Y.-F., Greene, J. E., Ho, L. C., Xiao, T., & Barth, A. J. 2011b, ApJ, 742, 68
- Kalberla et al. (2005) Kalberla, P. M. W., Burton, W. B., Hartmann, D., et al. 2005, A&A, 440, 775
- Kaspi et al. (2000) Kaspi, S., Smith, P. S., Netzer, H., et al. 2000, ApJ, 533, 631
- Kellermann et al. (1989) Kellermann, K. I., Sramek, R., Schmidt, M., Shaffer, D. B., & Green, R. 1989, AJ, 98, 1195
- Kennicutt (1998) Kennicutt, R. C., Jr. 1998, ARA&A, 36, 189
- Kim et al. (2008) Kim, M., Ho, L. C., Peng, C. Y., Barth, A. J., & Im, M. 2008, ApJS, 179, 283
- Kinney et al. (1996) Kinney, A. L., Calzetti, D., Bohlin, R. C., et al. 1996, ApJ, 467, 38
- Kormendy et al. (2011) Kormendy, J., Bender, R., & Cornell, M. E. 2011, Nature, 469, 374
- Kormendy (2013) Kormendy, J., & Ho, L. C. 2013, ARA&A, in press
- Kormendy & Kennicutt (2004) Kormendy, J., & Kennicutt, R. C., Jr. 2004, ARA&A, 42, 603
- Kormendy & Richstone (1995) Kormendy, J., & Richstone, D. 1995, ARA&A, 33, 581
- Krist (1995) Krist, J. 1995, in Astronomical Data Analysis Software and Systems IV, ed. R. A. Shaw, H. E. Payne, & J. J. E. Haye (San Francisco: ASP), 349
- Lal & Ho (2010) Lal, D. V., & Ho, L. C. 2010, AJ, 139, 1089
- Li et al. (2011) Li, Z.-Y., Ho, L. C., Barth, A. J., & Peng, C. Y. 2011, ApJS, 197, 22
- Lu et al. (2006) Lu, H., Zhou, H., Wang, J., et al. 2006, AJ, 131, 790
- MacAlpine & Williams (1981) MacAlpine, G. M., & Williams, G. A. 1981, ApJS, 45, 113
- MacArthur et al. (2004) MacArthur, L. A., Courteau, S., Bell, E., & Holtzman, J. A. 2004, ApJS, 152, 175
- Magorrian et al. (1998) Magorrian, J., Tremaine, S., Richstone, D., et al. 1998, AJ, 115, 2285
- Maitra et al. (2011) Maitra, D., Miller, J. M., Markoff, S., & King, A. 2011, ApJ, 735, 107
- Malizia et al. (2012) Malizia, A., Bassani, L., Bazzano, A., et al. 2012, MNRAS, 426, 1750
- Malkan et al. (1998) Malkan, M. A., Gorjian, V., & Tam, R. 1998, ApJS, 117, 25
- Marconi & Hunt (2003) Marconi, A., & Hunt, L. K. 2003, ApJ, 589, L21
- Markwardt (2009) Markwardt, C. B. 2009, in Astronomical Data Analysis Software and Systems XVIII, ed. D. A. Bohlender, D. Durand, & P. Dowler (San Francisco: ASP), 251
- Miniutti et al. (2009) Miniutti, G., Ponti, G., Greene, J. E., et al. 2009, MNRAS, 394, 443
- Moran et al. (1999) Moran, E. C., Filippenko, A. V., Ho, L. C., et al. 1999, PASP, 111, 801
- Moshir & et al. (1990) Moshir, M., & et al. 1990, IRAS Faint Source Catalogue, version 2.0 (1990), 0
- Muñoz Marín et al. (2007) Muñoz Marín, V. M., González Delgado, R. M., Schmitt, H. R., et al. 2007, AJ, 134, 648
- Murray & Chiang (1995) Murray, N., & Chiang, J. 1995, ApJ, 454, L105
- Noguchi et al. (2010) Noguchi, K., Terashima, Y., Ishino, Y., et al. 2010, ApJ, 711, 144
- Peng et al. (2002) Peng, C. Y., Ho, L. C., Impey, C. D., & Rix, H.-W. 2002, AJ, 124, 266
- Peng et al. (2010) Peng, C. Y., Ho, L. C., Impey, C. D., & Rix, H.-W. 2010, AJ, 139, 2097
- Pohlen & Trujillo (2006) Pohlen, M., & Trujillo, I. 2006, A&A, 454, 759
- Polletta et al. (2007) Polletta, M., Tajer, M., Maraschi, L., et al. 2007, ApJ, 663, 81
- Quillen et al. (2001) Quillen, A. C., McDonald, C., Alonso-Herrero, A., et al. 2001, ApJ, 547, 129
- Ranalli et al. (2003) Ranalli, P., Comastri, A., & Setti, G. 2003, A&A, 399, 39
- Salzer et al. (1989) Salzer, J. J., MacAlpine, G. M., & Boroson, T. A. 1989, ApJS, 70, 447
- Schlegel, Finkbeiner, & Davis (1998) Schlegel, D. J., Finkbeiner, D. P., & Davis, M. 1998, ApJ, 500, 525
- Sérsic (1968) Sérsic, J. L. 1968, Atlas de Galaxias Australes (Córdoba: Obs. Astron., Univ. Nac. Córdoba)
- Shemmer et al. (2008) Shemmer, O., Brandt, W. N., Netzer, H., Maiolino, R., & Kaspi, S. 2008, ApJ, 682, 81
- Simien & de Vaucouleurs (1986) Simien, F., & de Vaucouleurs, G. 1986, ApJ, 302, 564
- Skrutskie et al. (2006) Skrutskie, M. F., Cutri, R. M., Stiening, R., et al. 2006, AJ, 131, 1163
- Steffen et al. (2006) Steffen, A. T., Strateva, I., Brandt, W. N., et al. 2006, AJ, 131, 2826
- Strüder et al. (2001) Strüder, L., Briel, U., Dennerl, K., et al. 2001, A&A, 365, L18
- Sulentic et al. (2006) Sulentic, J. W., Repetto, P., Stirpe, G. M., et al. 2006, A&A, 456, 929
- Tananbaum et al. (1979) Tananbaum, H., Avni, Y., Branduardi, G., et al. 1979, ApJ, 234, L9
- Terlevich et al. (1991) Terlevich, R., Melnick, J., Masegosa, J., Moles, M., & Copetti, M. V. F. 1991, A&AS, 91, 285
- Thornton et al. (2008) Thornton, C. E., Barth, A. J., Ho, L. C., Rutledge, R. E, Greene, J. E., 2008, ApJ, 686, 892
- Vanden Berk et al. (2001) Vanden Berk, D. E., Richards, G. T., Bauer, A., et al. 2001, AJ, 122, 549
- van Dokkum (2001) van Dokkum, P. G. 2001, PASP, 113, 1420
- Veilleux & Osterbrock (1987) Veilleux, S., & Osterbrock, D. E. 1987, ApJS, 63, 295
- Vestergaard & Peterson (2006) Vestergaard, M., & Peterson, B. M. 2006, ApJ, 641, 689
- Wang et al. (2005) Wang, T. G., Dong, X. B., Zhou, H. Y., & Wang, J. X. 2005, ApJ, 622, L101
- Wang et al. (2009) Wang, J.-G., Dong, X.-B., Wang, T.-G., et al. 2009, ApJ, 707, 1334
- White et al. (1997) White, R. L., Becker, R. H., Helfand, D. J., & Gregg, M. D. 1997, ApJ, 475, 479
- Wright et al. (2010) Wright, E. L., Eisenhardt, P. R. M., Mainzer, A. K., et al. 2010, AJ, 140, 1868
- Xiao et al. (2011) Xiao, T., Barth, A. J., Greene, J. E., et al. 2011, ApJ, 739, 28
- York et al. (2000) York, D. G., Adelman, J., Anderson, J. E., Jr., et al. 2000, AJ, 120, 1579
- Zwicky et al. (1975) Zwicky, F., Sargent, W. L. W., & Kowal, C. T. 1975, AJ, 80, 545