Type-I X-ray bursts reveal a fast co-evolving behavior of the corona in an X-ray binary
Abstract
The coronae in X-ray binaries (XRBs) still remain poorly understood, although they have been believed for a long time to play a key role in modeling the characteristic outbursts of XRBs. Type-I X-ray bursts, the thermonuclear flashes happening on the surface of a neutron star (NS), can be used as a probe to the innermost region of a NS XRB, where the corona is believed to be located very close to the NS. We report the discovery of a tiny life cycle of the corona that is promptly co-evolved with the type-I bursts superimposed on the outburst of the NS XRB IGR J174732721. This finding may serve as the first evidence of directly seeing the rapid disappearance and formation of a corona in an XRB with a cooling/heating timescale of less than a second, which can strongly constrain the accretion models in XRBs at work.
Subject headings:
stars: coronae — stars: neutron — X-rays: individual(IGR J17473-2721) — X-rays: binaries — X-rays: bursts1. Introduction
The spectra of low-mass X-ray binaries (LMXBs), including both black hole (BH) and neutron star (NS) XRBs, are generally disentangled into soft/thermal (e.g., a blackbody-like) and hard/Comptonized (e.g., power-law shape with a cutoff at tens to hundreds keV) components. For example, a hard X-ray power law with a cutoff energy of tens keV in a NS LMXB was first observed in the atoll source 4U 1608522 (Zhang et al., 1996). A corona in a region close to the compact object of an XRB is usually invoked to account for the hard X-rays produced via inverse Compton scattering of the soft photons off the hot electrons in the corona. Although the existence for such a corona has been hinted from time to time, so far a direct observational evidence of its existence is still missing. It also remains a puzzle on how the corona is formed and where it is located. Plasmas may be energized to form a corona via either evaporation (Meyer et al., 1994; Esin et al., 1997; Liu et al., 2007; Frank et al., 2002) or magnetic re-connections (Zhang et al., 2000; Zhang, 2007; Meyer et al., 2007). The corona’s location is still not known for NS XRBs, and accordingly the Eastern (Mitsuda et al., 1989) and the Western models (White et al., 1988) were proposed. The Eastern model considers a corona around the NS, whereas the Western model takes the corona covering the accretion disk. A hybrid model (Lin et al., 2007) for NS X-ray binaries was devised by analyzing the X-ray spectra of Aql X-1 and 4U 1608-52, and offered a weak-Comptonization solution that differs from the above two models. X-ray binaries (XRBs) are commonly observed with outbursts displaying strong spectral evolution. Here we take advantage of the type-I X-ray bursts from the hard surface of a NS to probe the purported corona, under a circumstance of outburst and accompanying spectral evolution. Type-I X-ray bursts are caused by unstable burning of the accreted hydrogen/helium on the surface of a NS, and manifest themselves as a sudden increase (typically by a factor of 10 or greater) in the X-ray luminosity (for reviews, see (Lewin et al., 1993; Cumming, 2004; Strohmayer & Bildsten, 2006; Galloway et al., 2008)).
2. Observations and data analysis
IGR J174732721 was discovered by INTEGRAL during an outburst in April 2005 (Grebenev et al., 2005). Its subsequent outburst in 2008 March - October was almost uniformly monitored by RXTE/PCA (Proportional Counters Array), resulting in 182 RXTE/PCA pointed observations, with the identifier (OBSID) of proposal number (PN) 93064, 93093, and 93442 in the High Energy Astrophysics Science Archive Research Center (HEASARC). These observations adopted in this analysis cover the entire outburst and add up to 475 ks of exposure time on the source. The analysis of the PCA data is performed by using HEAsoft v. 6.6. The data are filtered using the standard RXTE/PCA criteria. Only the data from the PCU2 (the third Proportional Counters Unit, in the 0-4 numbering scheme) are used for the analysis, because this PCU was 100% working during all the observations. The background file used in the analysis of PCA data is the most recent one for bright-sources found at the HEASARC website111pcabkgdcmbrightvleeMv20051128.mdl. The dead time correction is made to all the spectra and lightcurves under the standard procedure described at the HEASARC website222http:heasarc.nasa.govdocsxterecipespcadeadtime.html.
3. Results
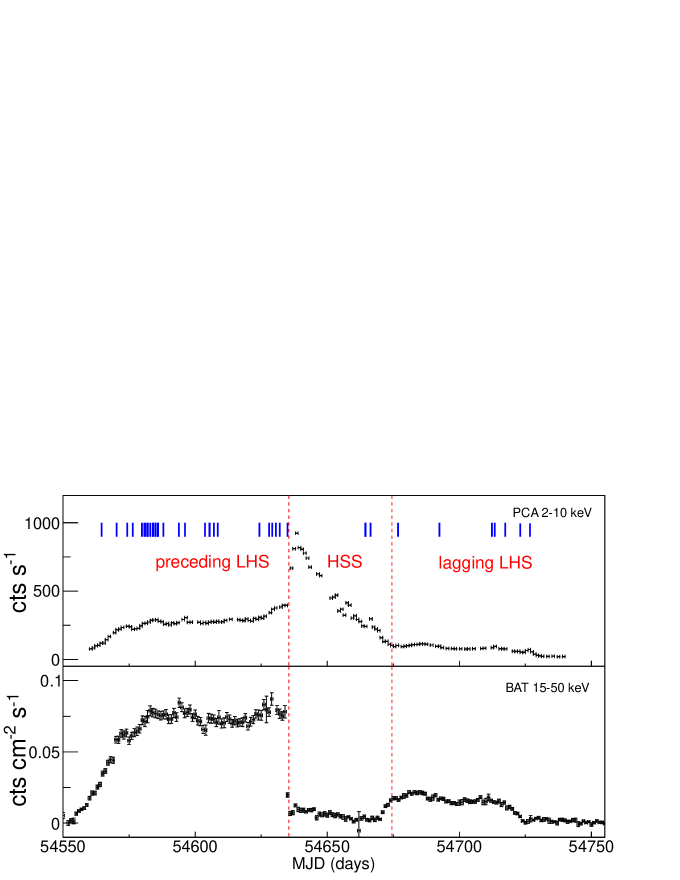
As shown in Figure 1 the source in the 2008 outburst experienced a two-months preceding low/hard state (LHS) and a lagging LHS with respect to the high/soft state (HSS); here ‘low’ and ‘high’ refers to its flux in the 2-10 keV band, and ‘soft’ and ‘hard’ refers to its spectral shape from 2-50 keV. The preceding LHS and the lagging LHS are usually refereed in literature as the high luminosity LHS and the low luminosity LHS, respectively (Remillard & McClintock, 2006). The flux of the lagging LHS is roughly 4 times lower than the preceding LHS, presenting with a so-called hysteresis typical to the outbursts of BH XRBs (Miyamoto et al., 1995; Maccarone & Coppi, 2003; Meyer-Hofmeister et al., 2005; Dunn et al., 2010; Tang et al., 2011). Besides 4U 1908+005 (Aql X1) and 4U 1608522 (Gladstone et al., 2007), IGR J174732721 is thus the third NS XRB observed with hysteresis. There are 32 bursts located in the preceding LHS and 10 bursts in the tail of the HSS and the lagging LHS (Chen et al., 2010, 2011; Chenevez et al., 2011), constituting an entire sample of 42 bursts recorded by RXTE. The long-lived preceding LHS and the large number of burst events occurred in both the preceding and lagging LHSs make IGR J174732721 almost unique for probing its corona (Zhang et al., 2009) under a circumstance of an outburst evolution.
For both LHSs, the persistent emission can be fitted by a power-law model with a cutoff energy 40 keV. The persistent luminosity in the preceding LHS and the lagging LHS are 0.1 (Eddington luminosity) and 0.025 , respectively. The burst spectrum is well modeled by a blackbody model of a characteristic temperature of less than 3 keV. The burst emission can reach , and dominates the total emission at energies well below 30 keV, above which the persistent emission from the purported corona dominates. We therefore take the emission in the 30-50 keV energy band to investigate the possible influence of the bursts upon the corona.
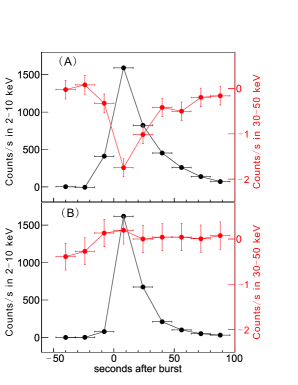
We choose 40 bursts out of the entire sample recorded by RXTE in the 2008 outburst with complete data for both the burst and the persistent emission. For each burst, we use the time when the burst reached its peak at 2-10 keV as a reference to produce the lightcurve and spectrum of each burst. Those X-rays recorded 48 seconds before and 80 seconds after the reference time are regarded as the background and are subtracted off for each burst in timing and spectral analysis. The 30-50 keV persistent count rate recorded by RXTE/PCA in the preceding LHS, the lagging LHS and the HSS are 4.0 cts/s, 1.0 cts/s, and 0.11 cts/s, respectively. With respect to the reference time we split each burst into a sequence of 16-second segments. After the persistent emission is subtracted off, bursts are combined for those located in the preceding LHS or in the lagging LHS. As shown in Figure 2, the 30-50 keV flux of the combined burst in the preceding LHS is mostly negative during the burst and around zero elsewhere; however, the fluxes of the combined burst in the lagging LHS are always consistent with zero.
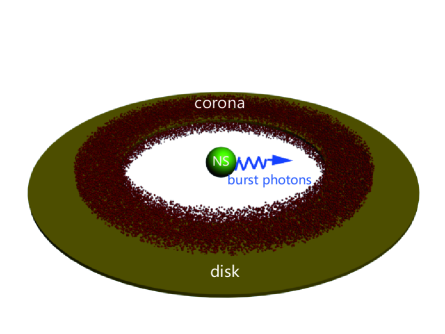
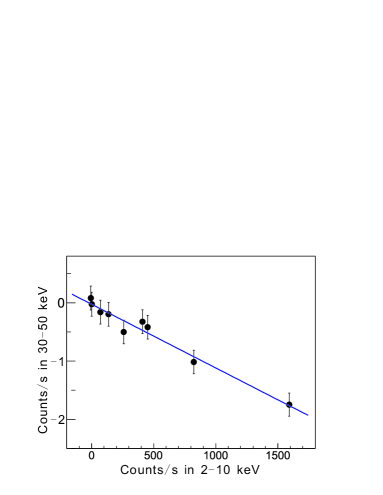
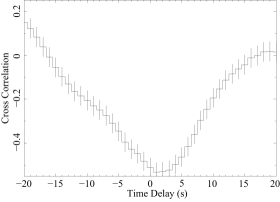
Our previous reports showed that the corona of the system (Figure 3) is most likely located around a largely inclined disk and forms a relatively small opening angle with respect to the surface of neutron star, so that the type-I X-ray bursts can escape from the NS surface without suffering severe Comptonization (Zhang et al., 2009; Chen et al., 2011). The 30-50 keV decrement reaches a maximum of 2 cts/s at the 2-10 keV burst peak, accounting to about half of the 30-50 keV persistent flux. This suggests that half of the corona were cooled by the soft photons of the bursts. Actually the 30-50 keV profile in the preceding LHS is anti-correlated with that of the 2-10 keV under a correlation coefficient of 0.89 (see Figure 4). In this analysis, a time resolution of 16 seconds is used to show the significance of the flux decrement, due to the very low flux in the 30-50 keV band. We try as well to extract the net lightcurves of the combined burst in the 2-10 keV and 30-50 keV bands with a time resolution of 1 second in the preceding LHS. A cross-correlation analysis between the two lightcurves shows that the 30-50 keV X-rays lag the 2-10 keV X-rays by 0.70.5 second, as shown in Figure 5. This suggests that the fading and recovering of the corona follow the burst flux change almost instantaneously. In the preceding LHS, the Compton cooling time of a pure electron-positron plasma is s, here is the electron energy. However, the plasma is more likely a proton-electron plasma, whose cooling time is s, i.e., increased by a factor of 2. This means that the heating time of the corona must be longer than s; otherwise the corona cannot be cooled down as observed during the rising phase of the bursts. On the other hand, the heating time must be shorter than about 1 second; otherwise the recovering of the corona would lag the bursts in the falling phase. These results serve as the first observational evidences in an XRB for a promptly cooling and recovering corona which manifests itself with an apparent tiny life cycle via tightly co-evolving with the soft X-ray bursts.
It is normally difficult to estimate the mass of the corona in an XRB, because the seed photon energy density for the inverse Compton scattering in the corona cannot be observed directly and cleanly. Fortunately, the prompt response of the corona to the bursts offers an unique opportunity to estimate the mass of the corona directly. The temperature and Compton scattering optical depth of the corona are obtained to be around 20 keV and 2 for both LHSs, respectively, by fitting their persistent emission spectra with the thermal Comptonization model (Comptt in Xspec)(Titarchuk, 1994). With the bursts as the coolant, the seed photon energy density is give by,
| (1) |
here is the distance of the corona from the NS. The total power for a single scattering from a non-relativistic electron with temperature , i.e., the cooling rate, is given by,
| (2) |
here and are the Thomson cross section and photon energy density of a burst in the corona, respectively. The mass of the corona cooled by a burst can be calculated as,
| (3) |
The inner radius of the accretion disk is assumed as the radius of the magnetosphere of the NS, where the gas pressure in the disk is balanced by the magnetic pressure of magnetosphere (Cui, 1997; Weng & Zhang, 2011). Taking erg s , erg s, the mass of NS , the NS surface magnetic field strength , the radius of the NS km, we have, and . Since the Compton scattering optical depth is around 2 and in the above calculation a single scattering is assumed, the calculated corona mass is only an upper limit. The accretion rate in the preceding LHS , here is the radiative efficiency for a NS XRB. Therefore the accretion process has sufficient mass reservoir to supply the required mass to the corona almost instantaneously, as observed.
4. Discussion
Despite the similar spectral properties of the persistent emission for both the preceding and lagging LHSs, no decrement of the 30-50 keV photons is observed in the combined burst in the lagging LHS. The lower flux in the lagging LHS indicates an accretion rate decreasing by a factor of 4 compared to that in the preceding LHS. Therefore the inner disk radius ()(Weng & Zhang, 2011) in the LHS is almost doubled, resulting a lower cooling rate by the bursts. With the persistent flux of about 1 cts/s in the lagging LHS in the 30-50 keV band, the maximum of decrement in the combined burst is expected to be 0.2 cts/s, well within the observed uncertainties. This explains the lack of flux decrement in the 30-50 keV band in the lagging LHS.
Spectral transitions in XRB outbursts have been studied in the frameworks of producing/supressing the hard X-rays via mechanisms, e.g., disk viscous dissipation and Compton cooling, where one key parameter is the time scale of flux variability. While the inverse Compton scattering has been applied successfully to account for the cooling, however no consensus has been reached on the correct corona formation model, e.g., between disk evaporation and magnetic re-connection models. Unfortunately, the time scales for either the transition into a HSS or stepping back to a LHS have so far only been observed not shorter than days, not sufficiently fine to discriminate between different models. For the disk evaporation, the formation of a corona is driven and energized by the disk accretion, which has a typical time scale of days (Meyer et al., 1994; Esin et al., 1997; Liu et al., 2007; Frank et al., 2002), obviously inconsistent with the observed heating time of shorter than 1 second. On the other hand, magnetic field reconnections in the inner disk region can release the kinetic energies in the rotating disk to heat the corona with the Keplerian orbital time scale of the order of milliseconds.
Therefore microscopic processes in the accretion disk should be responsible for forming the coronae in this NS XRB, in a process similar to that powering the solar flares in the Sun, as already discussed previously for BH accreting systems (Zhang et al., 2000; Meyer et al., 2007; Zhang, 2007). Future X-ray instruments with fine timing resolution and much larger effective areas than the RXTE/PCA instrument, may allow direct probing the fine details of the microscopic processes in the accretion and corona formation, by observing the interplays between type I X-ray bursts and the rapid spectral evolution of NS XRBs.
References
- Chen et al. (2010) Chen, Y. P., Zhang, S., Torres, D. F., et al. 2010, A&A, 510, A81
- Chen et al. (2011) Chen, Y. P., Zhang, S., Torres, D. F., et al. 2011, A&A, 534, A101
- Chenevez et al. (2011) Chenevez, J., Altamirano, D., Galloway, D. K., et al. 2011, MNRAS, 410, 179
- Cui (1997) Cui, W. 1997, ApJ, 482, L163
- Cumming (2004) Cumming, A. 2004, Nucl. Phys. B Proc. Suppl., 132, 435
- Dunn et al. (2010) Dunn, R. J. H., Fender, R. P., Krding, E. G. et al. 2010, MNRAS, 403, 61
- Esin et al. (1997) Esin, A. A., McClintock, J. E., & Narayan, R. 1997, ApJ, 489, 865
- Frank et al. (2002) Frank, J., King, A. & Raine, J. 2002, Accretion Power in Astrophysics, Cambridge Univ. Press
- Galloway et al. (2008) Galloway, D. K., Muno, M. P., Hartman, J. M., et al. 2008, ApJS, 179, 360
- Gladstone et al. (2007) Gladstone, J., Done, C., & Gierlinski, M. 2007, MNRAS, 378, 13
- Grebenev et al. (2005) Grebenev, S. A., Molkov, S. V., & Sunyaev, R. A. 2005, ATel, 467
- Lewin et al. (1993) Lewin, W. H. G., van Paradijs, J., & Taam, R. E. 1993, Space Sci. Rev., 62, 223
- Lin et al. (2007) Lin, D., Remillard, R. A., Homan, J. 2007, ApJ, 667, 1073
- Liu et al. (2007) Liu, B. F., Taam, Ronald E., Meyer-Hofmeister, E. 2007, ApJ, 671, 695
- Maccarone & Coppi (2003) Maccarone, T. J. & Coppi, P. S. 2003, MNRAS, 338, 189
- Meyer et al. (1994) Meyer, F. & Meyer-Hofmeister, E. 1994, A&A, 288, 175
- Meyer et al. (2007) Mayer, M. &Pringle, J. E. 2007, AIPConf.Proc.924:760-763 (astro-ph/0612752v1)
- Meyer-Hofmeister et al. (2005) Meyer-Hofmeister, E., Liu, B. F., Meyer, F. 2005, A&A, 432, 181
- Mitsuda et al. (1989) Mitsuda, K., Inoue, H., Nakamura, N., & Tanaka, Y. 1989, PASJ, 41, 97
- Miyamoto et al. (1995) Miyamoto, S., Kitamoto, S, Hayashida, K. et al. 1995, ApJ, 442, L13
- Remillard & McClintock (2006) Remillard, R. A., & McClintock, J. E. 2006, ARA&A, 44, 49
- Strohmayer & Bildsten (2006) Strohmayer, T., & Bildsten, L. 2006, New views of thermonuclear bursts (Compact stellar X-ray sources), 113, 156
- Tang et al. (2011) Tang, J, Yu, Wenfei & Yan, Zhen 2011, RAA, 11, 434
- Titarchuk (1994) Titarchuk, Lev 1994, ApJ, 434, 570
- Weng & Zhang (2011) Weng, S. S. & Zhang, S. N. 2011, ApJ, 739, 42
- White et al. (1988) White, N. E., Stella, L., & Parmar, A. N. 1988, ApJ, 324, 363
- Zhang (2007) Zhang, S. N. 2007, Highlights of Astronomy, 14, 41
- Zhang et al. (1996) Zhang, S. N., Harmon, B. A., & Paciesas, W. S. 1996, A&AS, 120, 279
- Zhang et al. (2000) Zhang, S. N., Cui, W., Chen, W., et al. 2000, Science, 287, 1239
- Zhang et al. (2009) Zhang, S., Chen, Y. P., Wang, J. M., et al. 2009, A&A, 502, 231