Young stellar population and ongoing star formation in the H ii complex Sh2-252
Abstract
In this paper, an extensive survey of the star forming complex Sh2-252 has been undertaken with an aim to explore its hidden young stellar population as well as to understand the structure and star formation history for the first time. This complex is composed of five prominent embedded clusters associated with the sub-regions A, C, E, NGC 2175s and Teu 136. We used 2MASS-NIR and Spitzer-IRAC, MIPS photometry to identify and classify the young stellar objects (YSOs) by their infra-red (IR) excess emission. Using the IR colour-colour criteria, we identified 577 YSOs, of which, 163 are Class I, 400 are Class II and 14 are transition disk YSOs, suggesting a moderately rich number of YSOs in this complex. Spatial distribution of the candidate YSOs shows that they are mostly clustered around the sub-regions in the western half of the complex, suggesting enhanced star formation activity towards its west. Using the spectral energy distribution (SED) and optical colour-magnitude diagram (CMD) based age analyses, we derived probable evolutionary status of the sub-regions of Sh2-252. Our analysis shows that the region A is the youngest ( 0.5 Myr), the regions B, C and E are of similar evolutionary stage ( 1-2 Myr) and the clusters NGC 2175s and Teu 136 are slightly evolved ( 2-3 Myr). Morphology of the region in the 1.1 mm map shows a semi-circular shaped molecular shell composed of several clumps and YSOs bordering the western ionization front (IF) of Sh2-252. Our analyses suggest that next generation star formation is currently under way along this border and that possibly fragmentation of the matter collected during the expansion of the H ii region as one of the major processes responsible for such stars. We observed the densest concentration of YSOs (mostly Class I, 0.5 Myr) at the western outskirts of the complex, within a molecular clump associated with water and methanol masers and we suggest that it is indeed a site of cluster formation at a very early evolutionary stage, sandwiched between the two relatively evolved CH ii regions A and B.
keywords:
stars: formation stars: premainsequence infrared: ISM H ii regions - ISM: individual objects: Sh2-2521 Introduction
In order to understand the interstellar processes which govern star formation, studies of the large scale properties of various star forming regions at different environments are very essential. Census of young stellar objects (YSOs) born in a cloud, their mass, age and spatial distribution, together with mass of the star forming cloud are some of the key data used for the assessment of the time scale and star formation history of a given region. However, identifying the member stars of a given young association is quite difficult. It is well known that YSOs show excess emission in infra-red (IR) above main sequence (MS) photosphere due to thermal emission from their circumstellar material. Thus, YSOs can be identified by looking for IR excess emission. YSOs are often categorized into Class 0, I, II or III evolutionary stages (Lada & Wilking, 1984). Class 0 objects are deeply embedded protostars that are still experiencing cloud collapse. They are extremely faint at wavelengths shorter than 10 m and have a significant sub-millimeter luminosity. A Class I YSO is also an object whose emission is dominated by a dense infalling spherical envelope, however these objects are bright in the IR. A Class II YSO is characterized by the presence of an optically thick, primordial circumstellar disk, which dominates the star’s emission. When the circumstellar disk material becomes optically thin, the star is classified as a Class III star. Hence, IR survey of a star forming region can be used as a powerful tool to distinguish the stars with IR excesses from stars without such excesses. The unprecedented sensitivity and mapping capabilities of the Spitzer Space Telescope provides an excellent platform to survey the star forming regions in the mid-IR and to identify the IR excess sources in the region. Furthermore, Spitzer data can also be used to classify YSOs at different evolutionary stages, which helps us probing the recent star formation activity of a given region (e.g., Smith et al. 2010).
Massive stars have a profound effect on their natal environment creating wind-blown shells, cavities and HII regions. The immense amount of energy released through their stellar winds and radiation disperse and destroy the remaining molecular gas and likely inhibit further star formation. However, it has also been argued that in some circumstances, the energy input by these massive stars can promote and induce subsequent low mass star formation in the surrounding molecular gas before it disperses (e.g., Koenig et al. 2012). Therefore, regions that contain massive stars provide excellent laboratories for studying both high and low mass star formation. Identification and characterization of the YSOs in star forming complexes hosting massive stars are essential steps to examine the physical processes that govern new generation star formation in such complexes.
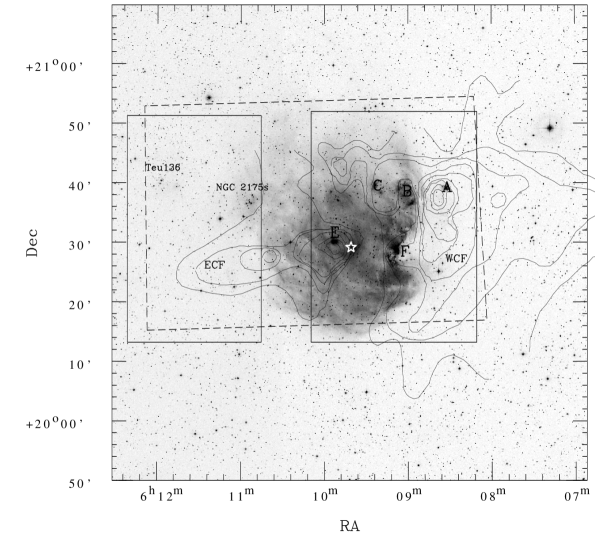
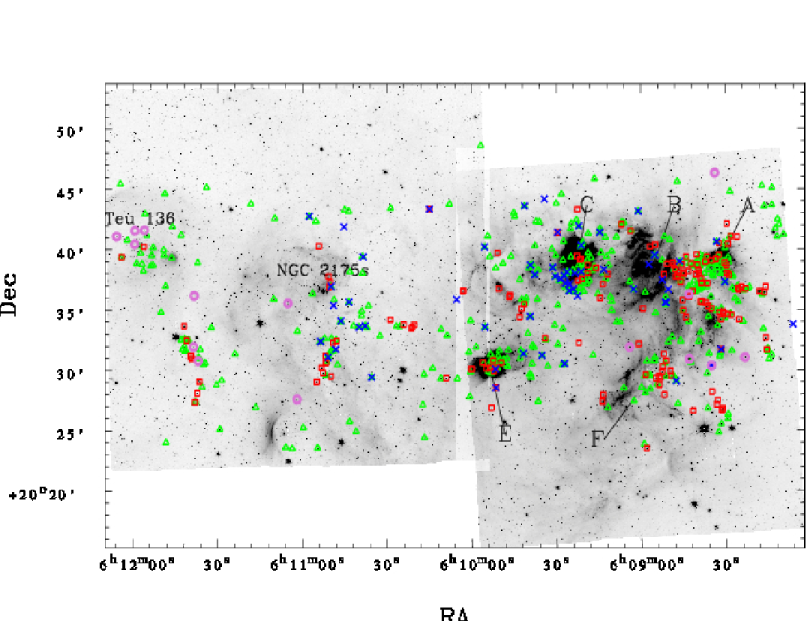
Here we present the results of our multi-wavelength analyses of the star forming complex Sh2-252 (Sharpless 1959; = ; = ; l=190∘.04; b=+0∘.48). Sh2-252 is an evolved H ii region powered by the central massive ionizing source of O6.5V type, HD 42088, which is a member of the Gemini OB1 association. The DSS2-R band image of the region around Sh2-252 for an area of 1.3 1.3 deg2 is shown in Fig. 1. Radio observations at 5 GHz detected six extended sources (Sh2-252 A to F) at different spatial locations towards the region, of which, four of them (A, B, C and E) are classified as compact H ii (CH ii ) regions (Felli et al. 1977, Lada & Wooden 1979). The stellar contents of this region were not so well explored until recently. Jose et al. (2012) (hereafter Paper 1) unraveled its stellar contents using deep optical, shallow near-infrared (NIR; 2MASS), survey along with spectroscopic observations. They estimated the distance (2.4 kpc), reddening and identified 12 OB stars of spectral type earlier than B8, 61 emission line sources within the nebula and also 5 prominent embedded clusters associated with the sub-regions A, C, E, NGC 2175s and Teu 136. The age and age spread, initial mass function (IMF), -band luminosity function (KLF) etc. of the sub-regions have also been discussed in Paper 1. The main sub-regions of Sh2-252 such as A, B, C, E, F, NGC 2175s and Teu 136 are marked in Fig. 1. Sh2-252 is bounded by an ionization front (IF) on the west side, while it is density bounded on the east side (Felli et al., 1977). The detailed 12CO and 13CO maps of the region by Lada & Wooden (1979) showed that the cloud complex is separated into two fragments by a long rift of little CO emission and named them as western cloud fragment (WCF) and eastern cloud fragment (ECF), respectively, and are marked in Fig. 1. Most of the mass of WCF is concentrated in a narrow ridge which borders the IF of Sh2-252 at its west (Lada & Wooden 1979; Koempe et al. 1989). The similarity in the kinematics of these two cloud fragments shows that they belong to the same cloud complex and ECF probably lies at the back edge of the H ii region, though it is projected very close to the ionizing source (Lada & Wooden 1979; Fountain et al. 1983). The most intense CO peak of the WCF is located very close to region A, with water and methanol maser emissions (Lada & Wooden 1979; Koempe et al. 1989; Szymczak et al. 2000) within its proximity, suggesting recent star formation activity towards this region (Lada & Wooden 1979; Lada et al. 1981; Koempe et al. 1989). An extensive overview of the previous studies of Sh2-252 can be found in Paper 1.
This work is the continuation of Paper 1, where we have focused mainly on the characteristics of the YSOs in the Sh2-252 complex for the first time and to constrain the star formation history of the complex. We used the optical, 2MASS-, Spitzer- IRAC and MIPS data sets to identify and classify the YSOs of Sh2-252 region. An attempt has also been made to characterize the physical properties of the YSOs based on the spectral energy distribution (SED) analyses. Section 2 describes various data sets used for the present study. Analyses and results including the identification and classification of YSOs, their various properties such as ages, masses, SEDs, spatial distribution etc. have been discussed in Section 3. Section 4 deals with discussion on the morphology and star formation scenario of the complex and finally summary of the paper is presented in Section 5.
2 Data sets
2.1 Spitzer-IRAC observations
Two sets of IRAC observations in 3.6, 4.5, 5.8 and 8.0 m bands (channels 1, 2, 3 and 4) were available in the Spitzer space observatory archive program (Program IDs: 201; 20506, PIs: G. Fazio; J. Hester) which were taken towards WCF and ECF on 2004 October 28 and 2006 March 26, respectively. The IRAC data were taken in the High Dynamic Range mode with three dithers per map position and with integration time of 0.4 sec and 10.4 sec per dither. We downloaded the basic calibrated data images (versions S18.7.0 and S18.5.0) from the Spitzer archive111http://archive.spitzer.caltech.edu/ and the raw data were processed and calibrated with the IRAC pipeline. The final mosaics were created using the MOPEX pipeline (version 18.0.1) with an image scale of 1′′.2 per pixel. The total area covered by these two observations is marked in Fig. 1 by using a dashed box.
We performed the point response function (PRF) fitting method in multiframe mode using the tool APEX developed by Spitzer Science Center on all the Spitzer-IRAC images to extract the magnitudes. The standard PRFmap table222http://ssc.spitzer.caltech.edu/irac/calibrationfiles/psfprf/prfmap.tbl provided on the Spitzer website were used to fit variable PRFs across the image. Point sources with peak values more than 5 above the background were considered candidate detection. Many sources detected in the nebulosity were appeared to be spurious. The spurious sources were identified visually and deleted from the automated detection list. Also, some of the sources were not detected by APEX automatically. We identified these sources visually and added the coordinates in the user-list mode in APEX to extract the magnitudes and thus we made sure that photometry of every genuine source is derived. We have adopted the zero-points for conversion between flux densities and magnitudes to be 280.9, 179.7, 115.0 and 64.1 Jy in the 3.6, 4.5, 5.8 and 8.0 m bands, respectively, following the IRAC Data Handbook. There were signs of saturation of bright sources in the long integrated images. The photometric data derived from the short images were replaced for the saturated sources. The two sets of IRAC observations had substantial overlapping between the regions and we used the average magnitudes of those common sources detected in both the observations. Channels 3 and 4 detected far fewer sources than channels 1 and 2. This deficit exists because channels 1 and 2 are more sensitive than channels 3 and 4 and are also less affected by the bright diffuse emission that dominates the channel 3 and 4 images. The underlying typical stellar photosphere is also intrinsically fainter at channels 3 and 4 than at channels 1 and 2, which further hinders the ability to detect sources in the longer wavelength IRAC filters. We finally obtained extraction lists of 24877, 20591, 5083 and 3263 sources in the IRAC 3.6, 4.5, 5.8, and 8.0 m bands, respectively, within the area shown in Fig. 1. The IRAC data of the four band passes were merged, by matching the coordinates using a radial matching tolerance of 1′′.2. To ensure good photometric accuracy, we restricted our catalog with sources having uncertainty 0.2 mag in all the bands. Thus our final IRAC catalog contains photometry of 31251 sources which were detected in one or more IRAC bands. Out of these, only 1988 sources were detected in all the IRAC bands.
2.2 Spitzer-MIPS 24 m observations
The areas towards WCF and ECF were observed at 24 m using the Multi-band Imaging Photometer for Spitzer (MIPS) on 2006 October 13 and 2008 October 25 (Program IDs: 20726; 50758, PIs: J. Hester; M. M. Drosback). We downloaded the BCD images (version S18.12.0) from the Spitzer archive and the final mosaics were created using the MOPEX pipeline (version 18.0.1) with an image scale of 2′′.45 per pixel. The total area covered by these observations is marked in Fig. 1. The sources were identified visually and their coordinates were given in the user-list mode in APEX. To extract the flux, we performed the PRF fitting method in the single frame mode. The zero-point value of 7.14 Jy from the MIPS Data Handbook has been used to convert flux densities to magnitudes. The final catalog contains the 24 m photometry of 646 sources having uncertainty 0.2 mag. We cross-correlated our MIPS-24 m catalog with the source catalog of IRAC, using a 2′′.5 matching radius. We obtained 24 m counterparts for 428 sources with IRAC data in all the bands. The 24 m photometry was mainly used to classify the YSOs and to analyze their SEDs (see Section 3.5.1).
2.3 Near-infrared data from 2MASS
NIR data for point sources within a radius of 30 arcmin around HD 42088 have been obtained from 2MASS point source catalog (PSC) (Cutri et al., 2003). To improve the photometric accuracy, we used the data with photometric quality flag (phqual = AAA) which gives a S/N 10 and a photometric uncertainty 0.1 mag. This selection criterion ensures best quality detection in terms of photometry and astrometry as given on the 2MASS website333http://www.ipac.caltech.edu/2mass/releases/allsky/doc/. We used 2MASS data along with Spitzer-IRAC data to identify and classify the candidate YSOs within Sh2-252 (see Section 3.3.2). The NIR and IRAC sources were bandmerged within .2 radial matching tolerance. If more than one 2MASS sources satisfied this requirement, then the nearest one was selected. Thus we obtained a total of 9097 2MASS sources having IRAC counterpart at least in one band.
3 Results
3.1 General morphology of the region
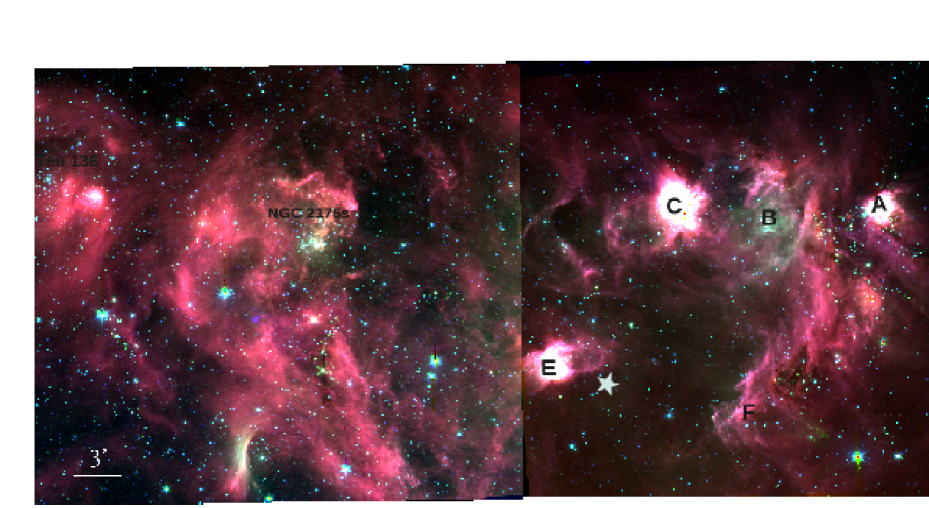
A colour composite image using the 3.6, 4.5 and 8.0 m bands of Spitzer-IRAC is shown in Fig. 2. The important sub-regions and the ionizing source (HD 42088) of Sh2-252 are marked in the figure. Different IRAC bands have contribution from various extended emission features. For example, 3.6 m band is dominated by diffuse emission from the 3.3 m PAH feature. The 4.5 m band includes the line plus CO band head emission and lines, and 5.8 and 8.0 m bands are dominated by strong PAH features, although a few sources show extended thermal continuum emissions from warm circumstellar dust in these bands (Smith et al., 2010). PAHs are believed to be destroyed in the ionized gas and thought to be excited in the photon dominated region (PDR) that is situated at the interface of H ii region and molecular cloud by the absorption of far-UV photons leaking from the H ii region (Pomarès et al., 2009). Therefore PAHs are good tracers of the warm PDR that surrounds the H ii region. The most striking feature in Fig. 2 is the magenta coloured emission that appears almost semi-circular in shape towards the west of Sh2-252. The PAHs within the PDR re-emit their energy in the 3.6, 5.8 and 8.0 m bands, and this can be seen as magenta coloured emission in the colour composite image given in Fig. 2. Altogether, this image shows a bubble-like emission feature around the ionizing source HD 42088, likely to be created due to the expansion of the H ii region to its surroundings. The bright-rim feature discussed in Section 1 (i.e., region F; see also Fig. 2 of Paper 1 for a close-up view) coincides well with the PAH emission feature seen at the southwest of Fig. 2, with a sharp edge pointing towards HD 42088. This sharp edge indicates the IF, that coincides with the molecular ridge seen in the 12CO map shown in Fig. 1 as well as the extinction map shown in Fig. 3 (see Section 3.2). This correlation indicates the interface of the ionized and molecular gas. The correlation of the half-ring structure of PAH emission towards the west of Sh2-252 with the 12CO emission and extinction maps indicates that the ionized gas is separated from the molecular cloud by the neutral gas with PAH emission. The absence of 8 m emission in the interior of the H ii region can be interpreted as the destruction of PAH molecules by the intense UV radiation of the ionizing source. There is also less intense diffuse emission towards the east of Sh2-252. However, the ionized gas is bounded more extensively in the western direction than in the eastern direction. It is to be noted that the location of NGC 2175s is devoid of strong PAH emission features. Interestingly, another bright red emission knot is seen further towards east of NGC 2175s with a bright red point source inside it. A small clustering is evident further east to this point source which coincides with the sub-region Teu 136 discussed in Paper 1. There are not many studies on this group of stars in the literature. However, based on our spectral analysis in Paper 1, we concluded that this group is a part of the main Sh2-252 complex itself.
3.2 -band extinction map from H and K data

The indication of variable extinction in the Sh2-252 region has been discussed in Paper 1 based on the optical photometric analyses of the bright stars as well as from the distribution of candidate YSOs on the colour-colour (C-C) diagram. In order to quantify the amount of extinction within each sub-region of Sh2-252 and to characterize the structure of molecular clouds, we derived the extinction map using the colours of the stars in the 2MASS catalog. To improve the quality of the map, the candidate YSOs and probable contamination sources (see Section 3.3) were excluded from the list. We used the grid method to determine the mean value of . Briefly, we divided the Sh2-252 region into many grids of size , and the median value of colours of all the sources within each grid was measured. The sources deviating above 3 were excluded to calculate the final median colour of each grid. We used the reddening law by Flaherty et al. (2007) to convert colour in to , using the relation = 1.82 , where, = 0.2 is assumed as an average intrinsic colour of stars in young clusters (see Allen et al. 2008; Gutermuth et al. 2009). Since this complex is situated at a distance of 2.4 kpc (Paper 1), the contribution from the foreground field stars would have affected the present extinction measurements. An average foreground extinction of = 1.5 mag has been estimated towards this region in Paper 1. Therefore, to eliminate the foreground contribution in the extinction measurement, we used only those stars with 0.15 mag to generate the extinction map. There were an average of five sources in each grid to calculate the median colour. The final extinction map, having an angular resolution of , which is sensitive down to = 16 mag is shown in Fig. 3. However, it has to be kept in mind that this map is limited by the sensitivity of the 2MASS survey. As a result, the value derived may be underestimated due to the small number of background stars detected in the heavily extincted area of the complex.
It is interesting to note that the extinction map derived from the colours shown in Fig. 3 resembles the general distribution of the molecular cloud as outlined by the 12CO emission map shown in Fig. 1. It traces the presence of molecular cloud towards the sub-regions A, B, C and nicely follows the bright rim feature visible at the west of Sh2-252 (i.e., region F, see Fig. 2 of Paper 1) similar to the ridge of molecular cloud seen in the 12CO emission map by Lada & Wooden (1979). Similarly, the separation between the two cloud fragments WCF and ECF (see Section 1) by the long rift of less extinction is also clearly seen in Fig. 3. The western cloud portion is more extincted as compared to the eastern one. However, isolated extinction complexes are seen in the eastern side as well. It has to be noted that the locations of the clusters NGC 2175s and Teu 136 are devoid of heavy reddening. The same trend has already been noticed in Paper 1. The average extinction of the four optically bright members of the cluster NGC 2175s (see Table 3 of Paper 1) is 2.2 mag, which is significantly lower than the extinction towards the western part of the complex. This could be explained by the fact that the strong stellar winds from the four early type sources in NGC 2175s would have removed the dust and gas from its neighborhood or the region could be more evolved than the other parts of the complex.
3.3 Identification of YSOs based on near- and mid-infrared colours
In the ensuing sections, we identify and classify the YSOs within Sh2-252 mainly into Class I and Class II categories using their IR colours. We do not classify diskless Class III YSOs because they are indistinguishable from field stars based on their IR colours and hence we cannot reliably identify them using the current data set. The main limitation of the identification of YSOs based on their IR colours is the contamination from various non-stellar sources in IRAC detection such as, polycyclic aromatic hydrocarbon (PAH) emitting galaxies, broad-line active galactic nuclei (AGNs), unresolved knots of shock emission, PAH-emission contaminated apertures etc., which have colours similar to that of YSOs and may lead to wrong identification of YSOs.
Megeath et al. (2004) and Allen et al. (2004) introduced the classification criteria for YSOs using the (, ) C-C diagram. These colour criteria since then have been modified by several authors (e.g., Harvey et al. 2006, 2007, Gutermuth et al. 2008; Gutermuth et al. 2009, Evans et al. 2009 and the references therein). We adopted the empirical three-phase scheme introduced by Gutermuth et al. (2009) to identify the YSOs with IR excess in this complex. Briefly, in phase 1, after excluding the non-stellar contamination (see Section 3.3.1), all four IRAC bands are used to separate the sources with IR excesses due to disks and envelopes (Class II and Class I, respectively) from pure photospheres (Class III/field stars) based on [3.6] - [5.8] and [4.5] - [8.0] colours. Phase 2 is applied to those sources which lack IRAC detection at [5.8] or [8.0] m, but which have high-quality 2MASS detection ( 0.1 mag) in at least and bands. Sources are then classified as Class II or Class I objects based on their de-reddened ( and ) colours (Allen et al., 2008). In addition, there are a few objects with NIR+IRAC colours of Class IIIs, but which exhibit a 24 m excess. These objects are included in a new class of YSOs i.e., ‘transition disk’ sources. Phase 3 re-examines all sources including contaminants and identifies Class I objects and transition disk objects on the basis of their MIPS 24 m photometry.
3.3.1 Selection of YSOs using IRAC data
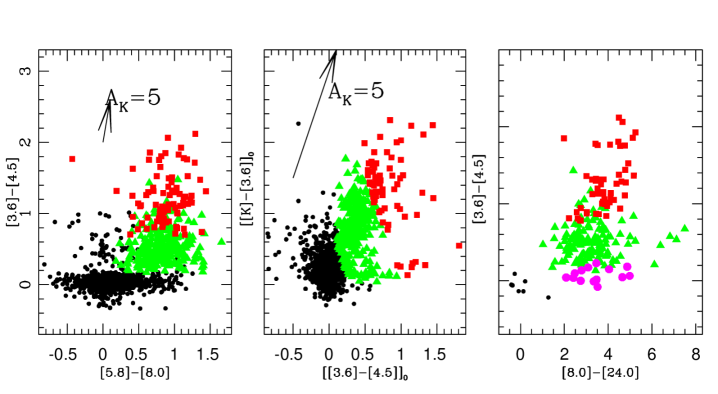
In order to identify the YSOs by their IRAC colours, we used only those sources detected in all the IRAC bands with photometric uncertainties less than 0.2 magnitude. Various non-stellar contaminating sources mentioned above are eliminated by using several criteria described in detail by Gutermuth et al. (2009). Out of the 1988 sources detected in all the IRAC channels, 444 sources are found to be contaminants. The remaining sample of 1544 sources was used to identify the Class I and Class II YSOs associated with the region using the IRAC colour criteria given by Gutermuth et al. (2009). The above criteria yields 340 YSOs with IR excess emission, with 86 and 254 sources having colours consistent with Class I and Class II types, respectively. The rest could be Class III/field stars, which we are unable to classify reliably based on their IRAC colours. However, it is to be noted that in a few cases, highly reddened Class II sources could mimic the colours of Class I source (Gutermuth et al., 2009). In Fig. 4 (left panel), we have shown the vs C-C diagram for all the uncontaminated IRAC sources, where the Class I and Class II sources are shown as red squares and green triangles, respectively. Here we would like to point out that the present YSO selection based on the IRAC- four colour detection is not complete, as many sources falling in the bright nebulous regions were not detected in the 5.8 and 8.0 m bands.
3.3.2 Additional YSOs from and m data
The detection of Class I and Class II YSOs in all the four IRAC bands is limited mainly by the lower sensitivity and enhanced nebulosity of the [5.6] and [8.0] m bands. In order to account for the YSOs missing in these bands, we used , , [3.6] and [4.5] m data sets and the additional YSOs in the complex are identified. Gutermuth et al. (2009) used the dereddened colour criteria to identify such YSOs. We used the extinction map (see Fig. 3; Section 3.2) to deredden the data. To minimize the inclusion of extra-galactic contaminants, we applied a simple brightness limit in the dereddened [3.6] m photometry i.e., all the Class I YSOs must have 15 mag and all the Class II YSOs must have 14.5 mag (Gutermuth et al., 2009). Thus, after removing the contaminants and using the Gutermuth et al. (2009) colour criteria, we identified a total of 367 candidate YSOs (67 Class I; 300 Class II) with IR excess emission, of which, 211 (52 Class I and 159 Class II) are found to be common with the YSOs identified using the IRAC four-colour criteria (see Section 3.3.1). Finally, we obtained 15 and 141 additional YSOs having colours consistent with Class I and Class II, respectively using the and colour combination. In Fig. 4 (middle panel), we have shown the vs C-C diagram for all the uncontaminated sources, where the Class I and Class II sources are shown in red squares and green triangles, respectively.
In order to identify the transition disk sources, we re-examined the entire catalog of sources having 24 m counterparts and with uncertainty less than 0.2 mag. Those sources that were considered photospheric in the previous classification but have significant excess emission at 24 m (i.e., [5.8]-[24] 2.5 mag or [4.5]-[24] 2.5 mag) are typically known as transition disks. They are the Class II sources with significant dust clearing within their inner disks (Gutermuth et al., 2009) and we identified 14 such sources within the complex. Also, any source which lacks detection in some IRAC bands yet has bright 24 m photometry are likely to be deeply embedded protostars. We identified 67 such sources and those are included in the Class I category in the following analysis. Five sources which lacked strong 24 m detection but had been classified as Class I YSOs in the previous step (Section 3.3.1) are reclassified as heavily reddened Class II YSOs.
Thus after reclassifying the sources using the 24 m photometry, we have finally identified 577 YSOs with IR excess emission in the Sh2-252 complex. Of these, 163 are consistent with Class I, 400 are consistent with Class II and 14 are consistent with transition disk YSOs. These objects will be used in the following analysis. Thus the Sh2-252 complex seems to have moderately rich number of YSOs. In the right panel of Fig. 4 we have shown the [3.6]-[4.5] vs [8.0]-[24] C-C diagram of all the uncontaminated IRAC sources having counterparts in 24 m along with the candidate Class I, Class II and transition disk sources marked in red squares, green triangles and magenta circles, respectively.
3.4 Completeness of the census of YSOs
To evaluate the completeness of the census of IRAC detection quantitatively, we plot histograms of the IRAC sources having error 0.2 mag for all the channels and they are shown by using solid lines in Fig. 5. In general, the data can be considered complete till the linear distribution in the histograms which are found to be 16.5, 16.0, 14.0 and 13.0 mag for 3.6, 4.5, 5.8 and 8.0 m bands, respectively. However, the completeness of the YSO census is limited by many factors. Bright extended, variable nebulosity in the IRAC bands can be found across the region, which significantly limits the point source detection in these areas. The YSO identification from the 2MASS- IRAC colours is limited by the modest sensitivity of the 2MASS survey, while that from the IRAC-MIPS colours suffer from the significant saturation in the IRAC 8 m and MIPS 24 m images caused by the central luminous sources as well as bright nebulosity. Similarly the variable reddening (see Fig. 3) and stellar crowding characteristics across the extend of the region (see Paper 1) could also affect the local completeness limit. Completeness limits for the Spitzer photometry were also assessed by using a method of inserting artificial stars into the mosaics and then employing our detection algorithms to identify them (e.g., Jose et al. 2008). The sub-regions A, B, C, E and F of the Sh2-252 complex are found to be severely affected by the variable reddening and nebulous background (Paper 1). In order to account for this variable background in the source detection, by following Paper 1, we estimated the completeness of two representative sub-regions i.e., regions A and C. 90% completeness limits of these two regions have been obtained as 14.0, 13.5, 12.5 and 11.5 mag, respectively for 3.6, 4.5, 5.8 and 8.0 m bands and are shown by using vertical dashed lines in Fig. 5.
The Sh2-252 complex lies at a distance of 2.4 kpc. The completeness limit of 14.0 mag at 3.6 m corresponds to an approximate stellar mass of 1.0 M⊙ for a YSO having an age of 1 Myr (Siess et al., 2000). A more conservative estimate for the 90% completeness of the PMS membership of the region can be made from the histogram distribution of candidate YSOs shown by using the dashed lines in Fig. 5 which seems to be matching with the completeness estimation by artificial star method. By taking variable extinction and stellar crowding characteristics into account, in conclusion, we consider that our YSO census of the Sh2-252 complex is complete down to 1-2 M⊙.

3.5 Characteristics of YSOs
3.5.1 From SED analysis
We constructed the spectral energy distributions (SEDs) using the grid of models and fitting tools of Robitaille et al. (2006, 2007) for characterizing and understanding the nature of YSOs in the Sh2-252 complex. The models were computed by Robitaille et al. (2006) by using a Monte-Carlo based 20,000 2-D radiation transfer models from Whitney et al. (2003a, b, 2004) and by adopting several combinations of central star, disk, in-falling envelope, and bipolar cavity for a reasonably large parameter space. Each YSO model has SEDs for 10 viewing angles (inclinations), so the total YSO grid consists of 200,000 SEDs. The SED fitting tool provides the evolutionary stage and physical parameters such as disk mass, disk accretion rate and stellar temperature of YSOs and hence is an ideal tool to study the evolutionary status of YSOs in star forming regions. Of the total YSOs identified in Sections 3.3.1 and 3.3.2, 183 sources (51 Class I, 132 Class II) have counterparts in 24 m and we fit SEDs to these 183 YSOs. The counterparts of these YSOs are searched in the optical and NIR bands irrespective of their error criteria. Of these sources, 54 are found to have counterparts at least in two of the optical bands () along with the , IRAC and 24 m data. 96 sources have , IRAC and 24 m data and rest of the sources have IRAC and 24 m data. Thus we have a minimum of 5 and maximum of 13 data points in the wavelength range from 0.36 m to 24 m to construct the SEDs. The SED fitting tool fits each of the models to the data allowing the distance and external foreground extinction as free parameters. We gave a distance range of 2.1 - 2.7 kpc (see Table 3 of Paper 1) as the input. An extinction range has been supplied as the input for each source from the value estimated from the colour as discussed in Section 3.2 and by allowing an uncertainty of 3 mag in the calculated extinction value. We further set photometric uncertainties of 10% for the optical and NIR data, 15% for the IRAC and 24 m data. These values are adopted instead of the formal errors in the catalog in order to fit without any possible bias caused by underestimating the flux uncertainties. We obtained the physical parameters of YSOs using the relative probability distribution for the stages of all the ‘well-fit’ models. The well-fit models of each source are defined by
,
where is the goodness-of-fit parameter for the best-fit model and is the number of input observational data points.
In Fig. 6, we show the sample SEDs of Class I, Class II and transition disk sources, where the solid black line represents the best-fit and the grey lines are the subsequent well-fits. From the well-fit models for each source derived from the SED fitting tool, we calculated the weighted model parameters such as the stellar mass (), temperature (), stellar age (), mass of the disk (), disk accretion rate (), envelope accretion rate () etc. The error in each parameter is calculated from the standard deviation of all well-fit parameters. The parameters and the corresponding errors of all the YSOs are listed in Table 1. The IDs 1 - 51 and 52 -183 represent Class I and Class II sources, respectively. For some of the sources, the errors associated with few parameters (Table 1) are quite large because we are dealing with a large number of parameter space, with limited number of observational data points. Additional observational data points in longer wavelengths would help constrain these parameters more precisely.
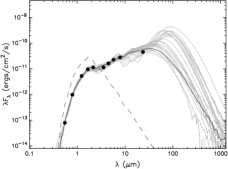
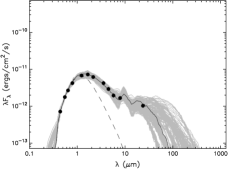
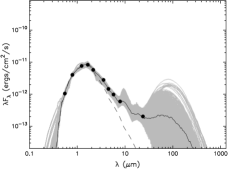
Table 1 shows that 94% (172/183) of the sources have an age range between 0.1 to 5 Myr. This age distribution is in agreement with the age range discussed in Paper 1 using the optical colour magnitude diagram (CMD) of the candidate YSOs. Similarly, masses of the YSOs are distributed in a range between 0.4 to 5.3 with a majority of them having masses between 0.5 to 3.0 . This is again in agreement with that of Paper 1. The SED model parameters of YSOs, such as the disk accretion rate and envelope accretion rate are considered to be functions of their evolutionary status. Stage 0/I, II and III YSOs have significant infalling envelopes, optically thick disks and optically thin disks, respectively (Robitaille et al., 2006). In Table 1, a majority of the Class II YSOs have the disk accretion rate of the order of - 10-8 yr-1. Similarly, the envelope infall rates of most of the Class I YSOs are 10-6 yr-1, which are relatively higher than that of the Class II YSOs, confirming their evolutionary stages. In Fig. 7 we have shown the cumulative distribution of Class I and Class II YSOs as a function of their ages which manifests that Class I sources are relatively younger than Class II sources. We have performed the Kolmogorov-Smirnov (KS) test for the age distribution of the Class I and Class II sources. The test result shows that the chance of the two populations having been drawn from a same distribution is %. It suggests that the age distribution of two populations are different.

3.5.2 From optical colour-magnitude diagram

The distribution of YSOs on the CMD is an ideal tool to estimate their approximate ages and masses. The CMD for the candidate Class I, Class II and H emission line sources are shown in the Fig. 8 of Paper 1, which suggests that majority of the YSOs in Sh2-252 are distributed between the PMS isochrones of age 0.1 and 5 Myr and evolutionary tracks of masses ranging from 0.5 to 3.0 . This is in agreement with the SED based analysis (Section 3.5.1). The age of each YSO has been estimated from the CMD as discussed in Pandey et al. (2008) and Chauhan et al. (2009). Briefly, their ages have been derived by comparing their locations on the CMD with PMS isochrones of various ages (Siess et al., 2000), after correcting for the distance and reddening of the region. Apart from the Class I, Class II and H sources, all other sources having age 5 Myr in the CMD and with 0.4 mag were suggested as the candidate PMS members of the complex in Paper 1. We also estimated the ages of these additional candidate PMS sources as discussed above. There are 80 YSOs which have age estimation both from the CMD and SED (Section 3.5.1) analyses. In Fig. 8 we have shown the comparison between the age distribution from CMD analysis with that from SED fitting. Squares and triangles represent the Class I and Class II YSOs, respectively. Though the age estimation from both the methods are quite scattered, in general, the distribution can be considered correlated with each other. We have also performed the KS test between the age distribution of YSOs from SED and CMD analyses and found that the ages estimated by these two methods are correlated by a factor of 81%. Hence, we confirm that our age estimation based on both methods is in agreement.
3.6 The ages of sub-regions in Sh2-252
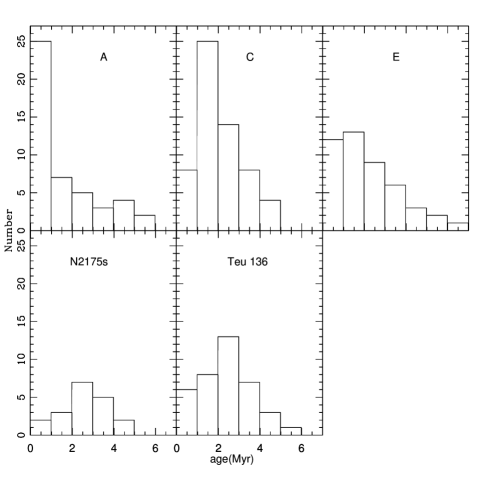
We attempted to constrain the evolutionary status of the sub-regions of Sh2-252 using the SED fitting and CMD analyses. Here we would like to caution that although the age estimation using the SED fittings may not be robust, the results agree reasonably well with the ages estimated by us using CMD for a subset of YSOs (Section 3.5.2). Hence we accept the ages determined by models with reasonable confidence. We estimated the ages of the sub-regions A, C, E, NGC 2175s and Teu 136 of Sh2-252 by using the ages of the candidate YSOs lying within their boundaries. The boundaries of these individual regions have been taken from the stellar surface density map. i.e., 3′.5, 3′.5, 3′.0, 3′.0 and 3′.0, respectively for regions A, C, E, NGC 2175s and Teu 136 (Paper 1). The histograms of age distribution estimated from the SED and CMD analyses of each sub-region are shown in Fig. 9. The median ages of YSOs within A, C, E, NGC 2175s and Teu 136 have been obtained as 0.5, 1.5, 1.5, 2.5 and 2.5 Myr, respectively. As evident in the -band surface stellar density map (Paper 1), no clustering is apparently seen towards the region B. From the SED analysis of 3 candidate YSOs lying within 2′.5 radius of region B, a median age of 1-2 Myr can be assigned for this region. However, the age of Sh2-252 B should be considered as an approximate value since the statistics is very poor. The above age estimates based on the SED/CMD analyses show that the region A is the youngest among all the sub-regions, whereas regions B, C and E are of similar age and NGC 2175s and Teu 136 are found to be slightly evolved than other sub-regions.
3.7 Spatial distribution of YSOs in Sh2-252
Spatial distribution of YSOs in a star-forming complex helps to trace its star formation history. In Fig. 10, we show the spatial distribution of all the identified candidate YSOs in Sh2-252 (i.e., red squares: Class I; green triangles: Class II; magenta circles: transition disk sources) overlaid on the IRAC 4.5 m mosaic image. The 61 emission line sources identified from slitless spectroscopy survey (Paper 1) are shown by using blue crosses. The important sub-regions of Sh2-252 are also marked in the figure. This figure indicates some interesting spatial sequence of YSOs within Sh2-252. A comparison of this figure with Fig. 2 clearly indicates that a majority of the candidate YSOs identified in Sh2-252 are preferentially concentrated around the CH ii regions A, C and E, respectively. Also, the bright rim feature discussed in Section 1 (i.e., region F), which makes up the western border of the complex contains several number of YSOs. There are not many YSOs detected towards the region B. The WCF is seen to have more number of YSOs when compared to the ECF. Overall, the distribution of YSOs in the west of Sh2-252 shows a nice correlation with the semi-circular shaped distribution of molecular gas and the PAH emission/H ii region cavity boundaries (see Section 3.1). The strong positional coincidence between the YSOs and the molecular cloud towards the WCF in Sh2-252 shows the enhanced star formation activity towards this region as observed in other star forming regions (e.g. Evans et al. 2009, Fang et al. 2009). There are a few number of sources scattered towards the east of Sh2-252. There are two groups of YSOs aligned in a filamentary manner associated with the cloud remnants seen towards the east of CH ii region E (see Figs. 1 and 3). However, the cluster NGC 2175s does not seem to have significant number of YSOs. There seems to be a small clustering of Class II and transition disk YSOs towards Teu 136. It is also interesting to note that there is an enhanced concentration of Class I YSOs towards the east of the sub-region A when compared to other sub-regions of Sh2-252. This is an indication that the region A might be at a younger evolutionary stage and we will be iscussing more on this in the ensuing sections.
The number of YSOs in each class is useful for estimating the relative age of a star forming region (Hatchell et al. 2007; Gutermuth et al. 2009). Since Class II sources are assumed to be more evolved than Class I and hence the Class I/II ratio is a function of the evolutionary status of a system (Beerer et al., 2010). We used this ratio as a proxy for the relative ages of the sub-regions in Sh2-252. The spatial distribution of the candidate YSOs given in Fig. 10 shows that most of them are distributed within or in the close proximity of the sub-regions A, C, E and Teu 136. Hence we estimated the ratio of Class I to Class II YSOs for these sub-regions within their radius (Paper 1). The Class I/II ratios have been obtained as 0.54, 0.24, 0.36 and 0.13, respectively for regions A, C, E and Teu 136. This fraction is of almost similar order with the median ratio of Class I to Class II sources (0.27) obtained in nearby clusters (Gutermuth et al., 2009). The various sub-regions within the S254-258 complex, a nearby star forming region to Sh2-252 in the Gem OB1 association, also have the Class I/II ratios vary between 0.32 to 0.78 (Chavarría et al., 2008). Thus the Class I/II ratios of the sub-regions of Sh2-252 can be considered comparable with the other star forming regions. In this scheme, the high concentration of Class I YSOs towards the region A suggests that the youngest population is located towards the western boundary of the complex.
4 Discussion
4.1 Probable evolutionary status of the sub-regions in Sh2-252
Since most of the giant molecular clouds (GMCs) in the Galaxy are hierarchical in structure, the evolutionary status of the identified YSOs helps to get a deep insight about the overall star formation activity of the complex. Tej et al. (2006) studied the sub-region A using NIR, sub-mm and radio observations. Based on their -band surface density map, which is deeper and of better resolution than ours, they found sub-structures within this region. In Tej et al. (2006), the prominent peak of the stellar density coincides spatially with the central ionizing source of A, which is an O9.5V type star (Paper 1). However, a secondary stellar density peak, which lies 50′′ east to the main peak has also been found and its spatial location coincides with the sub-mm peak detected at 850 m (Tej et al., 2006). The authors have attributed this as a possible cold core at an early evolutionary stage than A. Similarly, the most intense CO peak of the WCF is also located east to the region A with water and methanol maser emissions (Lada & Wooden 1979; Koempe et al. 1989; Szymczak et al. 2000) within its proximity, suggesting the recent star formation activity towards the east of A (Lada & Wooden 1979; Lada et al. 1981; Koempe et al. 1989). The water and methanol maser emissions associated with 850 m and CO peak towards the east of region A suggests that this region is possibly at an early evolutionary stage than A.
The high concentration of Class I YSOs around the region A (Fig. 10) and the large value of Class I/II ratio (see Section 3.7) show that region A is at a young evolutionary stage compared to the other sub-regions of the complex. The average age estimation ( 0.5 Myr) based on the SED and CMD analyses also shows that the region A is indeed very young. Based on the class I/II ratio and age histogram analysis, the regions B, C and E are found to be at a similar evolutionary stage and are slightly evolved (median age 1-2 Myr) than region A. The presence of a very few number of YSOs towards the small cluster NGC 2175s (see Fig. 10) suggests that either the cluster was formed in an early epoch of star formation in Sh2-252 or it is a case of rapid circumstellar disk evolution of YSOs (e.g., Bally et al. 1998) due to the presence of four early type massive sources at its center (see Table 4 of Paper 1). However, the median age estimation based on the CMD analysis gives an approximate age of 2-3 Myr for this cluster. The small cluster Teu 136 lying towards the east of Sh2-252 seems to have more number of Class II YSOs than Class I. The low value of the class ratio as well as the SED/CMD based age analyses (median age 2-3 Myr) show that this cluster is also at a slightly more evolved stage when compared to the sub-regions A, B, C, and E of the Sh2-252 complex.
4.2 Star formation activity towards WCF-The general picture
Sh2-252 is a large H ii region in the Gem OB1 association, excited by the O6.5V star HD 42088 of age 2-4 Myr. It contains 12 B-type stars, some of them are associated with CH ii regions. Since CH ii regions are at a early stage of massive star formation, their impact is limited to their local environment. Thus, O6.5V star is the most dominant source of energy responsible for ionization in the region. Lada & Wooden (1979) showed that the cloud complex is separated mainly into two fragments ECF and WCF, which themselves are embedded in a more diffuse and extended ( 90 pc) molecular cloud complex. Most of the mass of WCF ( 2.5 104 M⊙) is concentrated in a narrow ridge, which borders the western IF of Sh2-252. This dense, semi-circular shaped shell observed at the eastern boundary of WCF, appears to have been swept up by the pressure from the IF generated by the exciting source of Sh2-252 (Lada & Wooden, 1979). The large size and massive content of WCF suggest that the entire cloud is unlikely to be swept up. We roughly compared the required kinetic energy and the energy produced by the massive O6.5V star to sweep up the entire shell. The combined energy (radiation plus wind) liberated by the O6.5V stars is found to be less than the required energy to drive the entire cloud (WCF+ECF 2.7104 M⊙; Lada & Wooden 1979). Thus it is suggested that at least part of the shell in WCF is probably primordial in nature and the entire shell is not swept up by the expansion of the H ii region. However, at the same time it is obvious from Fig. 2 that the H ii region is in interaction with WCF, with bright semi-circular PDR and compressed neutral material behind it and protruding structures such as ‘finger tips’ and a bright rim pointing towards the ionizing source. Moreover, we observed recent star formation activity towards this region. The morphology resembles that star formation has occurred in thin shells around the H ii region and star formation seems to be more active in this direction compared to the whole cloud complex.
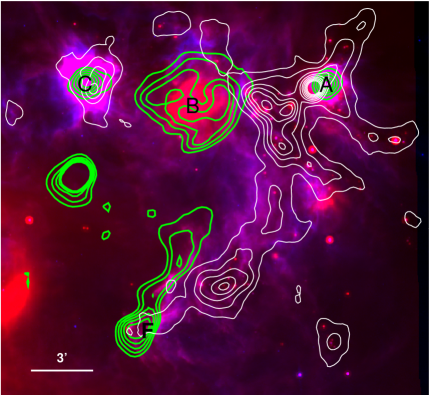
Fig. 11 shows the colour composite image of the western half of Sh2-252 made from the 8.0 and 24 m bands. The contours of 1.1 mm dust continuum emission (taken from Bolocam Galactic Plane Survey; Aguirre et al. 2011) and low resolution radio continuum emission at 1280 MHz (Samal et al. in preparation) are over plotted in Fig. 11. On a large scale we see a ring of molecular material at 1.1 mm aligned parallel to the outer extent of the IF of Sh2-252 seen in optical (see Fig. 1), and located just behind the bright PAH emission seen in 8 m and also corresponds to the dark region at 24 m. The molecular material in the ring seems to be fragmented at various locations. This shell of molecular material located behind the IF provides evidence for the most compressed zone of the WCF fragment. We also observed many Class II and Class I YSOs in this direction (Fig. 10), with a majority of them projected behind the PDR, in the vicinity of 1.1 mm emission. Apart from the YSOs, three CH ii regions (A, B and C) are observed in the close vicinity of the 8 m ring, with region A being located slightly behind the PAH ring and separated from the ring by a dark lane, consisting of highly dense molecular material. The region A is part of the massive (M 2.5104 M⊙), large ( 16 pc) WCF cloud (see Fig. 1). Hence the influence of O6.5V star to region A, if at all exists, must be weak.
In general, the configuration (at least in the western direction) suggests that the H ii region has collected some of the matter during its expansion at its periphery, like the collect & collapse process of star formation such as in Sh2-212 (Deharveng et al. 2008; Jose et al. 2011). Collect & collapse process works well in homogeneous and uniform medium, which is definitely not the case here, with openings at various directions and without a clear circular shell structure. However it has been found that collect & collapse process can still be applicable in turbulent medium (Deharveng et al., 2008). From the extinction map (Fig. 3) we found that the visual extinction in the direction of the PAH ring is, 5.5 mag, which corresponds to a column density of hydrogen, ) in the region 1.031022 atoms cm-2, using the relation = 5.3410, derived from Bohlin et al. (1978) for = 3.1E(B-V). The observed column density towards the molecular ring is thus comparable to the column density required (i.e., 61021 atoms cm-2) in the collected layer for the fragmentation to happen, as predicted by Whitworth et al. (1994). Assuming the observed star formation near the vicinity of the IF might have happened due to collect & collapse process, we compared the observed properties with the predication by the numerical simulation of Whitworth et al. (1994). We adopted 1.71049 as ionizing photons s-1 (for O6.5V star; Vacca et al. 1996), the isothermal sound speed as 0.2-0.3 km s-1and the density of the neutral material into which the H ii region evolved as 400 cm-3 (Lada & Wooden, 1979). With these values, the predicted fragmentation time and radius at which fragmentation would take place are found to be 2.3-2.9 Myr and 10.3-11.6 pc, respectively. Though there are large uncertainties involved in these calculations, considering the age of the ionizing star is of 2-4 Myr (Paper 1) and ages of the Class I/II YSOs projected on the shell 0.5 Myr, as well as the fact that the farthest separation of the shell from the ionizing star is 10 pc, the star formation activity could in fact might have taken place in the collected shell.
The possible formation of regions B, C and E is in doubt by the same scenario, owing to their large age ( 1-2 Myr; Section 4.1). These objects might have formed before the ionization-shock front passed over them, although with the present data it is hard to prove whether the passage of ionization-shock front makes the age of these sources look older. Ignoring this fact, we suspect that they are possibly not triggered due to the expanding H ii region, and more likely to be primordial in nature, resulted from the formation and evolution of the molecular cloud itself, which is in agreement with Lada & Wooden (1979).
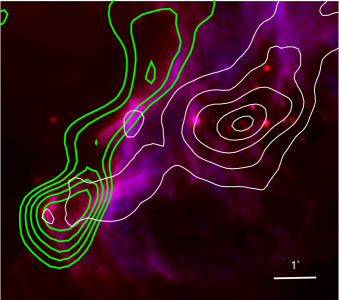
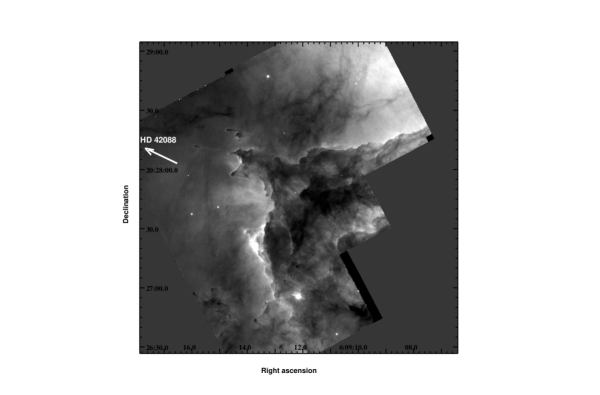
The radio source F is an extended one, with no internal heating source. The radio emission is located ahead of the 8 m emission (see Fig. 12 for a close up view of region F) and corresponds to the glowing gas in the optical image (see Fig. 2 of Paper 1), thus, more likely due to the photo-evaporating gas from the surface of the cloud exposed to radiation. This phenomenon usually occurs when a massive star drives an ionization-shock front into the ISM, the external layers of the cloud exposed to radiation starts photo-evaporating, and can be seen as glowing layer of gas. In Fig. 13, the HST-WFPC2 archive image at 0.65 m (Program No: 9091; PI: J. Hester) of the extreme edge of the molecular ridge at region F (i.e., the brightest portion of the bright-rim feature in Fig. 1 of Paper 1) is shown. Apart from the photo-evaporating gas, this better resolution image displays number of ‘finger-tips and pillars’ like fragments which are seen silhouetted against the bright background pointing towards the direction of HD 42088. Three YSOs are observed at the tip of region F (see Fig. 10) and they are low mass ( 2M⊙) Class I/II sources, thus possibly formed from low mass clouds. Assuming that the impact of ionizing radiation to such cloud structures initiates new star formation similar to those in BRCs and small globules, we compared the observed incident ionizing flux to the required range of ionizing fluxes that can trigger star formation in fiducial cloud as predicted by Bisbas et al. (2011) using numerical simulations. Bisbas et al. (2011) numerically estimated the required ionizing flux range as 109 cm-2 s-1 - 31011 cm-2 s-1. They predicted that if the ionizing flux is very low (109 cm-2 s-1) then the cloud will be slowly eroded and if the ionizing flux is high (1011 cm-2 s-1) then the cloud will be rapidly dispersed, with no star formation. We calculated the ionizing photon flux impinging onto these structures from the radio emission from the surface layer of the cloud following Lefloch et al. (1997) assuming the electron temperature of the photo-evaporating gas as 104 K, and it is estimated to be 3109 cm-2 s-1. The observed estimation is well within the predicted range to initiate star formation.
Besides the low-mass YSOs at the tip of the pillars, we also observed a clear clustering or concentration of YSOs in the dense region of the cloud located behind region F (see Figs. 2 and 10). The age of these YSOs is of the order of 1 Myr, thus indicates the youth of the region. These YSOs seem to have resulted from the gravitational fragmentation of the collected material rather than the implosion of pre-existing clumps due to external pressure. The YSOs show a chain-like elongated distribution parallel to the IF and appear to lie in the collected shell. Whereas in the case of radiation driven implosion (RDI), the YSOs are expected to lie perpendicular to the direction of progressive IF, with younger YSOs being located away from the IF. The incident photon flux is also on the lower-side of the flux needed to initiate RDI, thus possibly is not enough for a massive cloud to form a cluster of stars. Hence, we suspect that the star formation is more likely due to gravitational instability in the collected material, such as seen in the massive condensation of RCW120, where a chain of YSOs is observed parallel to the IF (Deharveng et al., 2009).
In Fig. 10 we find the densest concentration of YSOs in the close vicinity of the molecular clump located between the CH ii regions A and B (see Fig. 15 of Tej et al. 2006), with many YSOs of Class I nature ( 105 yr). This cloud clump is associated with water and methanol masers and does not show any radio emission (down to 0.4 mJy). Hence, Tej et al. (2006) suggested that it could be a site of high-mass star-forming protocluster in a very early evolutionary stage (Section 4.1). We also observed a cluster of YSOs, mostly Class I (Fig. 10), thus reflecting it is indeed a site of cluster formation sandwiched between the two relatively evolved CH ii regions A and B. Using H2 observations at 2.12 m, Tej et al. (2006) traced a cometary-arc shaped shocked molecular H2 emission bounding the ionized gas (i.e., ionization bounded side of the CH ii region A) in the direction of the molecular clump, possibly reflecting the interaction of the H ii region with the adjacent molecular cloud. Similarly, we noticed sharp radio contours for region B, in the direction of the molecular clump (Fig. 11). The radio size of region B is larger than regions A, C and E, and is ionized by a similar kind of star (B0-B0.5 type; Paper 1). Thus, if they are evolved in a cloud clump of similar density, the larger size of region B possibly reflects that it is relatively evolved in nature. The region between A and B indeed reflects a site of recent star formation, where much younger sources are found in the matter in between the two relatively evolved CH ii regions A and B. A similar kind of star formation has been observed at the interfaces of two expanding super giant shells LMC4 and LMC5 (Cohen et al., 2003) and two classical H ii regions S255-S257 (Ojha et al., 2011), where it is believed that collision of dense swept up neutral materials associated with individual shells lead to star formation (Yamaguchi et al. 2001a, b). Possibly, we are witnessing one such region, where star formation has been enhanced due to a similar kind of process.
The overall picture emerges from our analyses is that the star formation activity observed towards WCF is more likely multi-fold and the sources are found to be at different evolutionary stages. Though the large scale CO map (Lada & Wooden, 1979) provides much information about the global structure of the complex, but the region certainly deserves attention for high resolution molecular line observations to explore the detailed properties of the sub-regions.
5 Summary
The optically bright, extended H ii region Sh2-252 is a part of the Gemini OB1 association. This region is mainly composed of two small clusters NGC 2175s and Teu 136 and four CH ii regions namely A, B, C and E. In this paper, an extensive survey of the star forming complex Sh2-252 has been undertaken with an aim to explore its hidden young stellar population, their characteristics, spatial distribution, morphology of the region and finally to understand the star formation scenario of the complex for the first time. Spitzer-IRAC, MIPS photometry (3.6 - 24 m) are combined with 2MASS-NIR and optical data sets to identify and classify the YSOs by their IR excess emission from their circumstellar material. Using the IR C-C criteria, we have identified 577 YSOs in the complex, of which, 163 are consistent with Class I, 400 are consistent with Class II and 14 are consistent with transition disk YSOs, suggesting a moderately rich number of YSOs in this H ii region. From the CMD and SED based analyses, majority of the YSOs are found to have an age distribution between 0.1 - 5 Myr and mass in the range of 0.3 - 3.0 M⊙.
Spatial distribution of the candidate YSOs shows that they are mostly clustered around the sub-regions of the complex such as in A, C, E, F and Teu 136. However, majority of the candidate YSOs are distributed in the western part of the complex when compared to the east, suggesting enhanced star formation activity towards its west. Using the SED and CMD based age analyses, we derived probable evolutionary status of the sub-regions of Sh2-252. Our analyses suggest that the region A is the youngest ( 0.5 Myr), the regions B, C and E are of similar evolutionary stage ( 1-2 Myr) and the small clusters NGC 2175s and Teu 136, located towards the east of Sh2-252 are slightly evolved ( 2-3 Myr). Morphology of the region in the Spitzer colour images as well as in the 1.1 mm map shows an almost semi-circular ring-like shape towards the western half of the complex. Indeed, we find a molecular shell composed of several clumps distributed around the main ionizing source (i.e., HD 42088), suggesting that the expansion of the H ii region is collecting the surrounding material, which gives rise to the semi-circular ring shape. We find several candidate YSOs distributed over the semi-circular molecular shell which is an evidence for the star formation activity within the shell. Finally, by comparing the age of the ionizing source, fragmentation time of the collected molecular shell and age of the YSOs, we suggest collect and collapse scenario as one of the the possible mechanisms responsible for the star formation within the shell. We observed the densest concentration of YSOs, (mostly Class I, 0.5 Myr) at the western outskirts of the complex, within a molecular clump located between the CH ii regions A and B. The correlation between the molecular clump at this location with large number of Class I YSOs and the associated water and methanol masers suggest that it is indeed a site of cluster formation in a very early evolutionary stage, sandwiched between the two relatively evolved CH ii regions A and B. We conclude that the region is undergoing a complex star formation activity and there is a strong interplay between the radiation from the expanding H ii region to the surrounding molecular material. The region certainly deserves attention for high resolution molecular line observations to further explore its hidden structure.
6 Acknowledgments
We are thankful to the anonymous referee for useful comments which have improved the contents and presentation of the paper significantly. This publication makes use of data from the Two Micron All Sky Survey, which is a joint project of the University of Massachusetts and the Infrared Processing and Analysis Center/California Institute of Technology, funded by the National Aeronautics and Space Administration and the National Science Foundation. This work is based on observations made with the Spitzer Space Telescope, which is operated by the Jet Propulsion Laboratory, California Institute of Technology, under contract with NASA. This publication makes extensive use of data products from the HST archive at the Canadian Astronomy Data Center (CADC), operated by the National Research Council of Canada with the support of the Canadian Space Agency. JJ is thankful for the financial support for part of this study through a stipend from CSIR, India and also the guidance from the Spitzer support staff for the data analysis is highly acknowledged.
References
- Aguirre et al. (2011) Aguirre J. E. et al. 2011, ApJS, 192, 4
- Allen et al. (2004) Allen L. E. et al. 2004, ApJS, 154, 363
- Allen et al. (2008) Allen T. S. et al. 2008, ApJ, 675, 491
- Bally et al. (1998) Bally J., Testi L., Sargent A., Carlstrom J., 1998, AJ, 116, 854
- Beerer et al. (2010) Beerer I. M. et al. 2010, ApJ, 720, 679
- Bisbas et al. (2011) Bisbas T. G., Wünsch R., Whitworth A. P., Hubber D. A., Walch S., 2011, ApJ, 736, 142
- Blaauw (1961) Blaauw A., 1961, Bull. Astron. Inst. Netherlands, 15, 265
- Bohlin et al. (1978) Bohlin R. C., Savage B. D., Drake J. F., 1978, ApJ, 224, 132
- Chavarría et al. (2008) Chavarría L. A., Allen L. E., Hora J. L., Brunt C. M., Fazio G. G., 2008, ApJ, 682, 445
- Chauhan et al. (2009) Chauhan N., Pandey A. K., Ogura K., Ojha D. K., Bhatt B. C., Ghosh S. K., Rawat P. S., 2009, MNRAS, 396, 964
- Cohen et al. (2003) Cohen M., Staveley-Smith L., Green A., 2003, MNRAS, 340, 275
- Conti et al. (1977) Conti P. S., Leep E. M., Lorre J. J., 1977, ApJ, 214, 759
- Cutri et al. (2003) Cutri R. M. et al. 2003, 2MASS All Sky Catalog of point sources, NASA/IPAC Infrared Science Archive, http://irsa.ipac.caltech.edu/applications/Gator/
- Deharveng et al. (2008) Deharveng L., Lefloch B., Kurtz S., Nadeau D., Pomarès M., Caplan J., Zavagno A., 2008, A&A, 482, 585
- Deharveng et al. (2009) Deharveng L., Zavagno A., Schuller F., Caplan J., Pomarès M., De Breuck C., 2009, A&A, 496, 177
- Evans et al. (2009) Evans II N. J. et al. 2009, ApJS, 181, 321
- Fang et al. (2009) Fang M., van Boekel R., Wang W., Carmona A., Sicilia-Aguilar A., Henning T., 2009, A&A, 504, 461
- Felli et al. (1977) Felli M., Habing H. J., Israel F. P., 1977, A&A, 59, 43
- Flaherty et al. (2007) Flaherty K. M., Pipher J. L., Megeath S. T., Winston E. M., Gutermuth R. A., Muzerolle J., Allen L. E., Fazio G. G., 2007, ApJ, 663, 1069
- Fountain et al. (1983) Fountain W. F., Gary G. A., Odell C. R., 1983, ApJ, 273, 639
- Gies & Bolton (1986) Gies D. R., Bolton C. T., 1986, ApJS, 61, 419
- Gutermuth et al. (2009) Gutermuth R. A., Megeath S. T., Myers P. C., Allen L. E., Pipher J. L., Fazio G. G., 2009, ApJS, 184, 18
- Gutermuth et al. (2008) Gutermuth R. A. et al., 2008, ApJ, 674, 336
- Harvey et al. (2007) Harvey P., Merín B., Huard T. L., Rebull L. M., Chapman N., Evans II N. J., Myers P. C., 2007, ApJ, 663, 1149
- Harvey et al. (2006) Harvey P. M. et al. 2006, ApJ, 644, 307
- Hatchell et al. (2007) Hatchell J., Fuller G. A., Richer J. S., Harries T. J., Ladd E. F., 2007, A&A, 468, 1009
- Jacoby et al. (1984) Jacoby G. H., Hunter D. A., Christian C. A., 1984, ApJS, 56, 257
- Jose et al. (2011) Jose J. et al. 2011, MNRAS, 411, 2530
- Jose et al. (2012) Jose J. et al. 2012, MNRAS, 424, 2486
- Jose et al. (2008) Jose J. et al. 2008, MNRAS, 384, 1675
- Koempe et al. (1989) Koempe C., Baudry A., Joncas G., Wouterloot J. G. A., 1989, A&A, 221, 295
- Lada et al. (1981) Lada C. J., Blitz L., Reid M. J., Moran J. M., 1981, ApJ, 243, 769
- Lada & Wilking (1984) Lada C. J., Wilking B. A., 1984, ApJ, 287, 610
- Lada & Wooden (1979) Lada C. J., Wooden D., 1979, ApJ, 232, 158
- Lefloch et al. (1997) Lefloch B., Lazareff B., Castets A., 1997, A&A, 324, 249
- Mdzinarishvili & Chargeishvili (2005) Mdzinarishvili T. G., Chargeishvili K. B., 2005, A&A, 431, L1
- Megeath et al. (2004) Megeath S. T. et al., 2004, ApJS, 154, 367
- Ojha et al. (2011) Ojha D. K. et al., 2011, ApJ, 738, 156
- Pandey et al. (2008) Pandey A. K., Sharma S., Ogura K., Ojha D. K., Chen W. P., Bhatt B. C., Ghosh S. K., 2008, MNRAS, 383, 1241
- Pomarès et al. (2009) Pomarès M., et al., 2009, A&A, 494, 987
- Robitaille et al. (2007) Robitaille T. P., Whitney B. A., Indebetouw R., Wood K., 2007, ApJS, 169, 328
- Robitaille et al. (2006) Robitaille T. P., Whitney B. A., Indebetouw R., Wood K., Denzmore P., 2006, ApJS, 167, 256 Schmidt-Kaler Th., 1982, in Schaifers K., Voigt H. H., Landolt H., eds, Landolt-Bornstein, Vol. 2b, Springer, Berlin, p. 19
- Sharpless (1959) Sharpless S., 1959, ApJS, 4, 257
- Siess et al. (2000) Siess L., Dufour E., Forestini M., 2000, A&A, 358, 593
- Smith et al. (2010) Smith N. et al., 2010, MNRAS, 406, 952
- Stone (1982) Stone R. C., 1982, ApJ, 261, 208
- Szymczak et al. (2000) Szymczak M., Kus A. J., Hrynek G., 2000, MNRAS, 312, 211
- Tej et al. (2006) Tej A., Ojha D. K., Ghosh S. K., Kulkarni V. K., Verma R. P., Vig S., Prabhu T. P., 2006, A&A, 452, 203
- Vacca et al. (1996) Vacca W. D., Garmany C. D., Shull J. M., 1996, ApJ, 460, 914
- Walborn & Fitzpatrick (1990) Walborn N. R., Fitzpatrick E. L., 1990, PASP, 102, 379
- Whitney et al. (2004) Whitney B. A., Indebetouw R., Bjorkman J. E., Wood K., 2004, ApJ, 617, 1177
- Whitney et al. (2003b) Whitney B. A., Wood K., Bjorkman J. E., Cohen M., 2003, ApJ, 598, 1079
- Whitney et al. (2003a) Whitney B. A., Wood K., Bjorkman J. E., Wolff M. J., 2003, ApJ, 591, 1049
- Whitworth et al. (1994) Whitworth A. P., Bhattal A. S., Chapman S. J., Disney M. J., Turner J. A., 1994, MNRAS, 268, 291
- Yamaguchi et al. (2001a) Yamaguchi R., Mizuno N., Onishi T., Mizuno A., Fukui Y., 2001a, ApJL, 553, L185
- Yamaguchi et al. (2001b) Yamaguchi R., Mizuno N., Onishi T., Mizuno A., Fukui Y., 2001b, PASJ, 53, 959
| ID | ||||||||
|---|---|---|---|---|---|---|---|---|
| (deg) | (deg) | () | () | (yr) | () | (/yr) | (/yr) | |
| 1 | 92.242438 | 20.391663 | 2.1 0.5 | 0.77 0.29 | 4.42 3.28 | 0.026 0.028 | 3.542 2.896 | 0.002 0.003 |
| 2 | 92.066338 | 20.544426 | 1.4 1.0 | 0.43 0.12 | 0.06 0.23 | 0.019 0.040 | 5.907 5.553 | 126.0 116.0 |
| 3 | 92.196279 | 20.630317 | 4.5 0.3 | 0.75 0.10 | 0.74 0.23 | 0.001 0.001 | 0.038 0.037 | 0.400 0.562 |
| 4 | 92.464273 | 20.476278 | 3.1 0.5 | 1.17 0.15 | 4.85 1.77 | 0.003 0.007 | 0.028 0.028 | 0.000 0.000 |
| 5 | 92.068404 | 20.607574 | 3.7 0.6 | 1.34 0.14 | 4.00 2.17 | 0.011 0.022 | 1.256 1.186 | 1.127 17.51 |