Effects of composition and chemical disorder on the magnetocrystalline anisotropy of FexPt1-x alloys
Abstract
We perform first principles calculations of the magnetocrystalline anisotropy energy (MAE) of the L10-like FexPt1-x samples studied experimentally by Barmak and co-workers in [J. Appl. Phys. 98 (2005) 033904]. The variation of composition and long-range chemical order in the samples was studied in terms of the coherent potential approximation. In accordance with experimental observations, we find that, in the presence of long-range chemical disorder, Fe-rich samples exhibit a larger MAE than stoichiometric FePt. By considering the site- and species-resolved contributions to the MAE, we infer that the MAE is primarily a function of the degree of completeness of the nominal Fe layers in the L10 FePt structure.
Due to its extraordinarily high magnetocrystalline anisotropy energy (MAE), L10 FePt is of considerable interest to the development of ultrahigh density magnetic recording applications, in particular, for heat-assisted magnetic recording (HAMR). The L10 phase of Fe50Pt50 is a layered face-centered tetragonal structure, exhibiting alternating Fe and Pt layers along the direction. FePt also exhibits stable FePt3 and Fe3Pt phases as well as a chemically disordered, cubic phase.whang ; massalski Accordingly, FePt exhibits phase transitions with respect to composition as well as to chemical order and understanding the related effects on the magnetic properties is an important issue. The large effect of chemical disorder on the MAE of Fe50Pt50 has already been outlined both experimentallydisorder1 ; expl ; barmak and theoretically.disorder2 ; apl-letter
The degree of long-range chemical order is quantified in terms of a chemical order parameter.shockley ; warren The L10 FexPt1-x alloy is modeled by a repeating sequence of two atomic layers, characterized by compositions FePt and FePt, respectively. The fractions, and , are related to each other through the condition, . Furthermore, set by the requirement, (the case of can simply be obtained by interchanging the two types of layers), the range of is confined to (), whereby obviously (). The chemical order parameter is then defined by
| (1) |
and ranges from to max(). Denoting the compositions of the two repeating layers as , the case of complete disorder refers to the
compositions (FexPt1-x, FexPt1-x) and the maximum order to (Fe, Fe2x-1Pt2-2x)
for and to (Fe2xPt1-2x,Pt) for . Note that only in case of can the order
parameter reach the value . In the following, we refer to the two layers as the nominal Fe layer and the nominal Pt layer, respectively.
| Sample | (%) | a (Å) | c (Å) | c/a | (meV/atom) | |
|---|---|---|---|---|---|---|
| 1 | 46.2 | 3.870 | 3.721 | 0.961 | 0.89 | 0.453 |
| 2 | 51.1 | 3.863 | 3.710 | 0.960 | 0.93 | 0.709 |
| 3 | 52.0 | 3.857 | 3.706 | 0.961 | 0.89 | 0.775 |
| 4 | 55.4 | 3.839 | 3.704 | 0.965 | 0.72 | N/A |
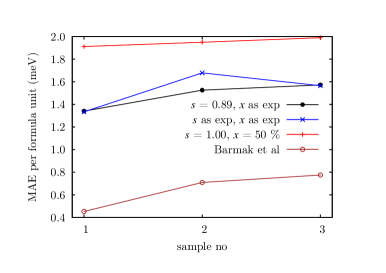
Our present study was motivated by the work of Barmak and co-workers,barmak who investigated the MAE of four FexPt1-x samples differing in composition and degree of chemical order.
Table 1 summarizes the experimental geometrical and compositional data,
as well as the measured MAE values for the FePt samples studied in Ref. barmak, .
Note that for sample no. 4 the MAE could not be determined.
One of the main conclusions of Ref. barmak, is that slightly Fe-rich samples may be preferable to Fe50Pt50 for obtaining a large MAE. In terms of first principles calculations we aim to explore the origin of this observation, in particular, whether it is it a pure effect of composition or whether it is also related to the chemical order of the sample.
To this end, we perform fully relativistic first-principles calculations by means of the screened Korringa-Kohn-Rostoker (SKKR) method. As the method is well documented elsewhere in the literature, see e.g. Refs. laszlo1, ; screening1, ; screening2, ; ebert, , here we describe only the features particularly relevant to this work. We use the local spin density approximation (LSDA) of the density functional theory (DFT) as parameterized by Vosko et al.voskoCJP80 and treat the potentials within the atomic sphere approximation (ASA). In line with previous work,apl-letter the self-consistent potentials and fields are calculated from scalar-relativistic calculations and the fully relativistic Kohn-Sham-Dirac equation is then solved to derive the MAE of the system. In all calculations, an overall angular-momentum cut-off of was used.
The chemical disorder according to the model as described above was treated in terms of the coherent potential approximation (CPA).soven ; gyorffy It should be mentioned that the MAE of FexCo1-x alloys was recently investigated by using the same model of long-range chemical order.turek ; kota
In the spirit of the magnetic force theorem, the MAE is evaluated as the difference in the band energy of the system when polarized along the easy axis and perpendicular to the easy axis, along . As in Ref. apl-letter, we estimated the effect of temperature-induced spin-fluctuations by scaling down the MAE by a factor of 0.6 according to the Langevin dynamics simulations of Mryasov et al. mryasov
In order to verify our method against the experiments, first we attempt a direct comparison of our SKKR-CPA calculations to the experimental data of Ref. barmak, , see Table 1. As shown in Fig. 1, we performed three sets of calculations. The first set only takes into account changes in the lattice geometry (i.e., the variation in the lattice parameters), while assuming stoichiometric composition, , and maximum long-range chemical order, . Even by taking into account the ’temperature factor’ of 0.6, these calculations yield quite high MAE values. Such magnitude differences with respect to the experiment are, however, in agreement with previous first-principles calculations of the MAE of FePt, see e.g. Refs. lyubina, ; shick, . Furthermore, in this set of calculations only a very moderate change () of the MAE is obtained across the samples.
In the second set of calculations, we introduce the composition as given in experiment, while keeping the degree of chemical order constant at . This greatly improves the trend of the MAE, however, the relative change of the MAE from sample no. 1 to sample no. 2 is still underestimated () as compared to the experiment (). The overall magnitude of the MAE is significantly decreased, but it is still by a factor of 2-2.5 larger than the measured one. Finally, including also the variation of chemical order as given in the experiment clearly improves the above mentioned relative change between samples no 2 and 3 (), but, opposite to the experiment, it predicts a slightly decreasing trend from sample no. 2 to 3. Note, however, that these latter changes are within the range of both theoretical and experimental errors.
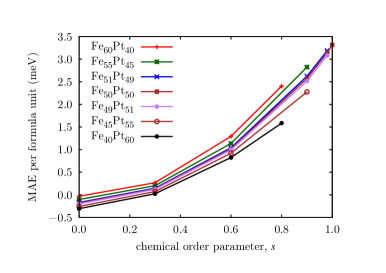
Having confirmed that the SKKR-CPA calculations satisfactorily reproduce the experimental trends, we next consider the general effects of the chemical composition and order parameter on the MAE of FePt. To this end, we used the lattice parameters measured for sample no. 3 in Ref. barmak, , Å and Å, while we independently varied the chemical order parameter as well as the composition . Note that for this theoretical study we did not scale down the MAE to mimic temperature induced effects. The results are shown in Fig. 2 for the range of compositions . (Beyond this range, the L10 structure becomes unstable with respect to other phases.whang ; massalski ) Our results are in good agreement with the conclusion of Barmak et albarmak , inasmuch for any given degree of chemical order the MAE increases monotonically with the Fe-content. However, even maximally ordered FexPt1-x alloys with cannot achieve the MAE of fully ordered Fe50Pt50 (3.31 meV per formula unit).
It should be noted that, at , the MAE becomes negative. This is in contrast to Ref. ostanin, , which reports a vanishing MAE for completely disordered FePt under the assumption of a cubic unit cell. The ’residual’ negative MAE we obtain in the case of complete chemical disorder is, therefore, due to the tetragonality of the lattice (). For real samples, where the lattice parameters cannot be frozen while varying the chemical order and composition, in the case of complete chemical disorder the unit cell is expected to become cubic, removing thus this ’residual’ MAE.
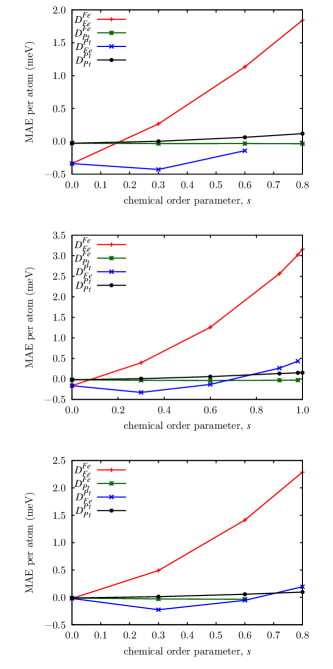
In order to elucidate the origin of the variation in the MAE with the composition and the chemical disorder, we consider next the species-resolved contributions to the MAE. The MAE per unit cell can be decomposed as
| (2) |
where ( Fe or Pt) denotes the MAE contribution from an atom of species when it is positioned in a nominal layer, i.e., within a layer, which in a perfectly ordered Fe50Pt50 alloy would contain only atoms of species . For the cases of , 0.5 and 0.6, in Fig. 3 we show as a function of the chemical order parameter, . In completely disordered FePt (), the nominal Fe layers and the nominal Pt layers are identical. Therefore, at , the Fe contributions in both layers are equal and take a small negative value for , which decreases in magnitude with increasing and practically vanishes at . The Pt contributions, on the other hand, are nearly zero for all compositions when . As the chemical order increases, the Fe contribution in the nominal Fe layers rapidly increases up to about 1.8 meV, 2.0 meV and 2.2 meV at for , 0.5 and 0.5, respectively. For the fully ordered case, and , even takes the value of about 3.15 meV, close to the total value of the MAE (3.31 meV). In contrast, the Fe contribution in nominal Pt layers decreases up to , then slightly increases and, for , reaches a small positive value ( meV) at maximal chemical order. Remarkably, the magnitude of the Pt contributions remain almost negligible ( meV) over the whole range of chemical order.
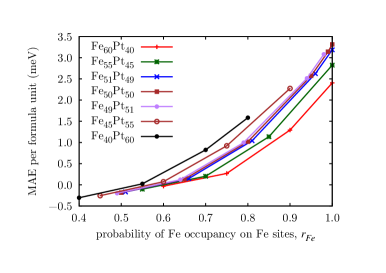
As indicated in Fig. 3, the dominant contribution to the MAE is , see Eq. (2). It is, therefore, intuitive to replot Fig. 2 as a function of the fraction, . This interpretation of the MAE is shown in Fig. 4 for different compositions . Since , it is clear that the horizontal range of the curves in Fig. 2 is halved and, more importantly, they are shifted to the right by . As a consequence, for a fixed value of the order of the curves with respect to is reversed as compared the order of curves at a given in Fig. 2 . This opposite tendency becomes obvious when considering e.g. the case of – Fe-rich FexPt1-x will exhibit completely Fe-filled nominal Fe layers at a smaller than Fe50Pt50, which requires in order to exhibit completely filled Fe layers. On the other hand, increasing disorder (i.e., decreasing ) drastically reduces the Fe contribution to the MAE in the nominal Fe layer, , and, consequently, the MAE of the system.
In conclusion, our calculations strongly support the conclusion of Barmak and co-workers in Ref. barmak, , showing that, for a given degree of chemical order, the MAE increases with the Fe concentration of FexPt1-x, at least within the range . This is due to the strongly positive effect on the MAE of the degree of Fe-filling of the nominal Fe layers, , which dominates the variation in the MAE when varying the composition , while keeping the chemical chemical disorder constant. However, FexPt1-x with cannot attain perfect chemical order () and perfectly ordered Fe50Pt50 yields a larger MAE than the Fe-rich alloys with maximum degree of long-range chemical order.
The authors would like to thank and acknowledge Professor Katayun Barmak and Professor Jingsheng Chen for helpful discussions and advice on the details of the experimental work in Refs. expl, ; barmak, . CJA is grateful to EPSRC and to Seagate Technology for the provision of a research studentship.
Support of the EU under FP7 contract NMP3-SL-2012-281043 FEMTOSPIN is gratefully acknowledged.
Financial support was in part provided by the New Széchenyi Plan of Hungary (TÁMOP-4.2.2.B-10/1–2010-0009)
and the Hungarian Scientific Research Fund (OTKA K77771).
References
- (1) S. Whang, Q. Feng, and Y.-Q. Gao, Acta Materialia 46 (1998) 6485
- (2) T. B. Massalski, J.L. Murray, L.H. Bennet and H. Baker (ed.), Binary Phase Diagrams. Materials Park, Ohio: ASM International, 1986.
- (3) S. Okamoto, N. Kikuchi, O. Kitakami, T. Miyazaki, Y. Shimada and K. Fukamichi, Phys. Rev. B 66 (2002) 024413
- (4) Y. Ding, J. Chen, E. Liu, C. Sun, and G. Chow, J. Appl. Phys. 97 (2005) 10H303
- (5) K. Barmak, J. Kim, L. H. Lewis, K. R. Coffey, M. F. Toney, A. J. Kellock and J.-U. Thiele, J. Appl. Phys. 98 (2005) 033904
- (6) J.B. Staunton, S. Ostanin, S.S.A. Razee, B. Gyorffy, L. Szunyogh, B. Ginatempo and E. Bruno, J. Phys.: Cond. Mat. 16 (2004) S5623
- (7) C.J. Aas, L. Szunyogh and R. W. Chantrell, Appl. Phys. Lett. 99 (2011) 132501
- (8) F. C. Nix and W. Shockley, Rev. Mod. Phys. 10 (1938) 1
- (9) B. Warren, X-Ray Diffraction Dover Publications, 1990.
- (10) J. Zabloudil, R. Hammerling, L. Szunyogh and P. Weinberger, Electron Scattering in Solid Matter - A Theoretical and Computational Treatise. Springer–Verlag, Berlin–Heidelberg–New York, 2005.
- (11) L. Szunyogh, B. Újfalussy, P. Weinberger and J. Kollár, Phys. Rev. B 49 (1994) 2721
- (12) R. Zeller, P.H. Dederichs, B. Újfalussy, L. Szunyogh and P. Weinberger, Phys. Rev. B 52 (1995) 8807
- (13) H. Ebert, D. Ködderitzsch and J. Minár, Rep. Prog. Phys. 74 (2011) 096501
- (14) S. H. Vosko, L. Wilk, and M. Nusair, Canadian Journal of Physics 58 (1980) 1200
- (15) P. Soven, Phys. Rev. B 2, 4715 (1970) 4715
- (16) B. L. Gyorffy, Phys. Rev. B 5 (1972) 2382
- (17) I. Turek, J. Kudrnovsky, and K. Carva, Phys. Rev. B 86 (2012) 174430
- (18) Y. Kota and A. Sakuma, Applied Physics Express 5 (2012) 113002
- (19) O.N Mryasov, U. Nowak, K.Y. Guslienko and R.W. Chantrell, Europhysics Letters 69 (2005) 805
- (20) J. Lyubina, I. Opahle, K.-H. Müller, O. Gutfleisch, M. Richter, M. Wolf, and L. Schultz, J. Phys.: Condens. Mat. 17 (2005) 4157
- (21) A. B. Shick and O. N. Mryasov, Phys. Rev. B 67 (2003) 172407
- (22) S. Ostanin, S. S. A. Razee, J. B. Staunton, B. Ginatempo, and E. Bruno, J. Appl. Phys. 93 (2003) 453