Super-exponential cutoff as a probe of annihilating dark matter
Abstract
We investigate the possibility of fitting the putative spectrum of gamma-rays from annihilating dark matter at the Galactic Center by a super-exponential template. By generating and analyzing mock data for several ongoing and future experiments (HESS, CTA and DMA), we find that the preference for a super-exponential template (over an exponential) is especially strong for dark matter annihilating to and relative to other annihilation channels.
pacs:
95.35.+d 95.85.Pw, 98.70.RzThe discovery of new physics often relies on our ability to distinguish signal from background. Sometimes, however, the ’less interesting’ background turns out to be no better known than the signal that we are seeking. When both signals have similar magnitudes, one could make use of the spectral differences between the signal and the background if they were sufficiently strong.
The study of spectral features of astrophysical signals as the putative spectrum of annihilating dark matter has recently attracted much attention. The most distinct signature could be provided by a line feature 1986PhRvL..56..263S ; Bringmann:2011ye , which may have been observed in the Galactic Center region at 130 GeV Bringmann:2012vr but this remains controversial Whiteson:2013cs . Less dramatic, but possibly more realistic, spectral features that are hitherto unobserved are the so-called cut-off features Bringmann:2011ye , and box-shaped spectra features Ibarra:2012dw .
Here we study the spectral properties of a hypothetical gamma-ray signal of dark matter annihilating in the Galactic Center region, and demonstrate that a simulated spectrum of dark matter annihilation to hard channels (such as and ) can be better fit by the so-called ’super-exponential’ fitting function rather than by the commonly adopted exponential fit.
As a template dark matter annihilation model where the signal is potentially strong, we adopt the dark matter density spike that forms around a central black hole in a dark matter halo or sub halo 1999PhRvL..83.1719G . This is visible as a point source, but similar arguments would apply to a diffuse dark matter concentration.
The point source at the Galactic Center, associated with the central black hole Sgr A*, has been identified in radio, infrared and X-ray bands, as well as in gamma-rays by HESS Aharonian:2004wa , where it appears as a point source within the angular resolution of the instrument (). The HESS Collaboration identified a possible exponential cut-off in the spectrum of the Galactic Center source at about 15 TeV Aharonian:2009zk , which could also be explained by a broken power-law. The gamma-ray emission from source HESS J1745-290 and its high energy cutoff was explained by astrophysical mechanisms in terms of acceleration and diffusion of cosmic rays Aharonian:2005ti , and alternatively in terms of annihilating dark matter Profumo:2005xd ; Belikov:2012ty . The next generation ground-based telescope CTA will provide superior spectral and angular resolution Becherini:2012iy . For completeness in our analysis we also invoke the concept of the more futuristic experiment, the Dark Matter Array (DMA) Bergstrom:2010gh . With such experiments in perspective, we argue below that improved spectral measurement of the putative TeV cut-off could discriminate between competing models. We describe the technique used to simulate the data and present the results of fits to the simulated data by exponential and super-exponential functions.
The mean number of events in the energy bin , given the flux registered by an experiment with an effective collecting area during time , is estimated as
where is the width of the energy bin and is the variance of energy, related to energy resolution of the instrument (). For the sake of simplicity, we take the effective area to be constant. Once we have the mean number of events, we generate 100 realizations of the observations for a given bin and calculate the statistical error assuming a Poisson distribution. The total error includes the statistical as well as instrument specific systematic error . The values of energy resolution, typical observation times, effective areas and systematic errors for HESS, CTA and DMA are summarized in Table 1.
| [hours] | [] | ||||
|---|---|---|---|---|---|
| HESS | 50 | 0.18 | 15% | 10% | 0.1 |
| CTA | 100 | 2.3 | 9% | 5% | 0.01 |
| DMA | 5000 | 23 | 7% | 1% | 0.001 |
We simulate the flux measured from the Galactic Center region as a sum of the dark matter annihilation spectrum plus a power-law-like background . While ground-based Cherenkov telescopes cannot distinguish gamma-rays from electrons and positrons, we assume that the major part of the electron and positron background can be excluded from the Galactic Center region due to the fact that the observed flux of electrons and positrons is approximately globally isotropic (perhaps up to a small dipole anisotropy Hooper:2008kg ).
If dark matter consists of particles of mass that annihilate with a cross section , the flux of gamma rays from a dark matter halo with the density distribution described by is given by
where is the spectral density of ’s per annihilation.
N-body simulations find that a cusp is formed at the center of a dark matter halo. The slope of the cusp was found to range from to Navarro:1995iw ; Moore:1999gc . Cores were observed in dwarf galaxies Moore:1994yx . In case a black hole resides at the center of a halo, the density profile of the halo is expected to contract in its vicinity. The slope of the spike is derived in terms of the inner slope as in the simplest adiabatic contraction model 1999PhRvL..83.1719G . The enhancement of the dark matter annihilation signal over the non-contracted profile can reach a factor of 100 in the innermost region of the Galaxy.
We normalize our dark matter profile to the dark matter density in the vicinity of the Solar system, taken to be Bovy:2012tw . We use a generalized NFW profile with or equivalently take the flux to be boosted by a factor of over the standard NFW density profile with (consistent with Belikov:2012ty ) :
with and . This profile and/or boost is equivalent to adopting a density spike, for which the conventional assumption is within pc 1999PhRvL..83.1719G .
The astrophysical diffuse background gamma-ray flux is modeled by a power law with Bergstrom:1997fj . Estimates for the spectral index of the diffuse gamma-ray flux vary from for the blazar component Venters:2009sd to Fields:2010bw for the component from star-forming galaxies. The measurement of the spectral index of the diffuse gamma-ray flux by Fermi in the range 1 to 50 GeV provided Abdo:2010nz , while a certain population of sources, such as radio quasars, are characterized by a steeper spectral index Collaboration:2010gqa .
An exponential cutoff is a template often used for describing rapidly decreasing functions. The form has been used to describe the gamma-ray spectrum of the source at the Galactic Center Aharonian:2006wh . The continuum spectrum of annihilation of dark matter into photons for most annihilation channels has a pronounced cutoff at the mass of the dark matter particle. It is tempting to model such an abrupt cutoff with functions that decay more rapidly than an exponential function. A ’super-exponential’ function is a simple generalization of an exponential function.
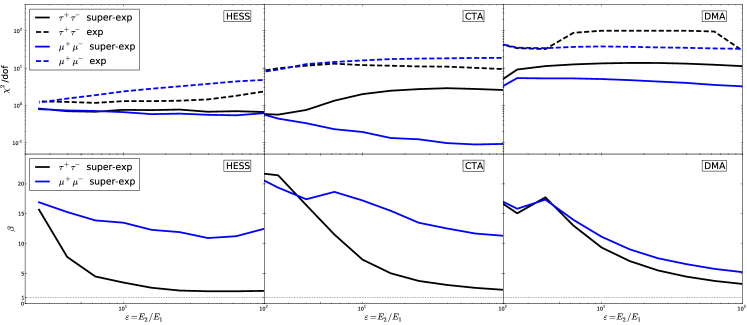
We generate datasets that are potentially observeable by HESS, CTA and DMA for , , and channels for dark matter with TeV using the PPPC4DMID code Cirelli:2010xx . After a few tests we found that for our choices of experimental parameters, the and annihilation channels benefit most from using the super-exponential spectral templates, and we decided to work specifically with these channels. Using the technique of ’scalable’ windows, we bin the data in logarithmic bins between and , for a range of . As found earlier, it is propitious to keep the geometric mean () in a fraction of the dark matter mass Bringmann:2011ye . To parametrize the background flux against the flux due to dark matter annihilation we use the fraction of energy contained in the background , where the integration is performed over the interval . For each in the interval [1,100] and each dataset, we find the best-fit parameters of the exponential and the super-exponential fits, and calculate the goodness-of-fit parameter . The average values of and are presented in Fig. 1.
Since the super-exponential function has one extra parameter over the exponential function, we expect that values for the former are at least as good as for the latter, which we find for the specified values of parameter (Table 1) for the whole range of . For HESS, the fits with the super-exponential function prove to be good in the whole range of varying for and annihilation channels, while for CTA, the channel fits well across the whole range, and the annihilation channel can be well fit with a super-exponential only in the range . However, the DMA fits with the super-exponential function are not as good for both channels (). This is due to the fact that with such overwhelming statistics and systematics, a simple super-exponential will no longer be a sufficiently good template to describe the sum of the signal and the power-law background. From Figure 1 one can see that the average exponent of the best fits is a nearly monotonically decreasing function of . For CTA and DMA and and across the whole range for HESS, the super-exponential fit to the annihilation channel requires a greater to fit the observed flux. The variance of does not exceed 30% for super-exponential fits to HESS spectra and is much less than that for the rest of the scenarios. With the increase of in the range [2.4,2.7], the mean of exponential fits increases and that of the super-exponential plots decreases, the maximum variation does not exceed 6%. The mean of best fits increases with the increase of with the maximum variation below 1%.
We note that the super-exponential fits for and channels for CTA and DMA experiments to the values of and as functions of are very similar to the and annihilation channels. However we find that for the HESS experiment the corresponding values of are not consistently greater than unity. This might be due to the fact that there is less intensity at the higher energies (close to ) for these channels.

 |
 |
 |
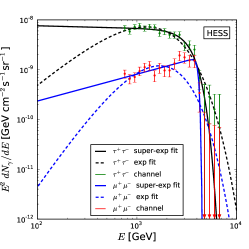
Having confirmed that for certain values of the flux observable by ground-based telescopes can be well fit for , we study the goodness of fit as a function of , the normalization of the hypothetical background (having fixed ). In Fig. 2, one can see that with the increase of , the exponential fits become better, while the super-exponential fits become worse, until at they become comparable. Thus when the background flux becomes a large enough fraction of the foreground flux (and specifically becomes comparable around the cutoff energy), the relevance of sharp-featured templates is diminished. In Fig. 3, left inset, the average exponents are plotted as functions of . The average values of the best fits to the annihilation channel are systematically greater than those of the annihilation channel. We also note the average values of the best fits are systematically greater for fits to CTA over HESS experiments. Examples of best fits to particular realization of fluxes observed from the Galactic Center by HESS and CTA are presented in Fig. 3 (center and right).
In summary, we have investigated the use of super-exponential versus exponential templates for fitting the signal of the flux of gamma-rays from dark matter annihilating at the Galactic Center and an unknown astrophysical background simulated by a power-law. We find that the super-exponential template provides better fits than the exponential template with good for the HESS and the CTA experiments. If dark matter annihilates through or channels then the use of the super-exponential template is more robust relative to other channels provided that the ratio of signal to background fluxes is smaller than 0.1. This allows us to assert that if the background can be discriminated sufficiently well, the exponential fits to the combined gamma-ray flux from the Galactic Center are significantly worse than the super-exponential ones. In this case, the signal could be plausibly explained by dark matter annihilating to or annihilation channels. The inverse statement is even stronger - if there is no gain by using a super-exponential template over an exponential one, we can place strong constraints on or and weaker on other annihilation channels.
We thank T. Bringmann, E. Moulin, M. Cirelli for useful conversations and the referee for helpful comments. The authors were supported by ERC project 267117 (DARK MATTERS) hosted by Universite Pierre et Marie Curie - Paris 6 and acknowledge the hospitality of KICP where part of this work was done.
References
- (1) M. Srednicki, S. Theisen, and J .Silk, Phys. Rev. Lett. 56, 263 (1986); L. Bergström and H. Snellman, Phys. Rev. D D37, 3737 (1988).
- (2) T. Bringmann, F. Calore, G. Vertongen, and C. Weniger, Phys. Rev. D84, 103525 (2011), arXiv:1106.1874.
- (3) T. Bringmann, X. Huang, A. Ibarra, S. Vogl and C. Weniger, JCAP 1207, 54 (2012), arXiv:1203.1312; M. Su and D. Finkbeiner, arXiv:1206.1616.
- (4) D. Whiteson, arXiv:1302.0427.
- (5) A. Ibarra, S.L. Gehler, and M. Pato, JCAP 1207, 043 (2012), arXiv:1205.0007; A. Ibarra, H.M. Lee, S.L. Gehler, W.-I.Park and M. Pato, JCAP 1205, 16 (2013), arXiv:1303.6632.
- (6) P. Gondolo and J. Silk, Phys. Rev. Lett. 83, 1719 (1999), arXiv:astro-ph/9906391; G. Bertone, G. Sigl and J. Silk, Mon. Not. Roy. Astron. Soc. 337, 98 (2002), astro-ph/0203488; G. Bertone and D. Merritt Phys. Rev. D72, 103502 (2005), astro-ph/0501555.
- (7) F. Aharonian et al., Astron.Astrophys. 425, Lett13 (2004), astro-ph/0408145; F. Aharonian et al., Astron.Astrophys. 457, 899 (2006), astro-ph/0607333.
- (8) F. Aharonian et al., Astron.Astrophys. 503, 817 (2009), arXiv:0906.1247.
- (9) F. Aharonian and A. Neronov, Space Sci. Rev. 300, 255 (2005), astro-ph/0503354; M. Chernyakova, D. Malyshev., F. Aharonian, R.M. Crocker and D.I. Jones, Astrophys.J. 726, 60 (2011), arXiv:1009.2630.
- (10) S. Profumo. Phys. Rev. D72, 103521 (2005), astro-ph/0508628; J.A.R. Cembranos, V. Gammaldi, A.L. Maroto, JCAP 1304, 51 (2013), arXiv:1302.6871.
- (11) A. Belikov, G. Zaharijas and J. Silk, Phys. Rev. D86, 083516 (2012), arXiv:1207.2412.
- (12) Y. Becherini, B. Khélifi, S. Pita and M. Punch, AIP Conf.Proc., 1505 769 (2012), arXiv:1211.5997.
- (13) L. Bergström, T. Bringmann and J. Edsjö, Phys. Rev. D83, 045024 (2011), arXiv:1011.4514.
- (14) D. Hooper, P. Blasi and P. Serpico, JCAP 0901, 25 (2009), arXiv:0810.1527; M. Ackermann et al., Phys. Rev. D82, 092003 (2010), arXiv:1008.5119.
- (15) J.F. Navarro, C.S. Frenk, and S.D.M. White, Astrophys.J. 462, 563 (1996), astro-ph/9508025.
- (16) B. Moore, T.R. Quinn, F. Governato, J. Stadel and G. Lake, Mon. Not. Roy. Astron. Soc. 310, 1147 (1999), astro-ph/9903164.
- (17) B. Moore, Nature 370, 629 (1994).
- (18) J. Bovy, and S. Tremaine, Astrophys.J. 756, 89 (2012), arXiv:1205.4033.
- (19) L. Bergström, P. Ullio and J.H. Buckley, Astropart.Phys. 9, 137 (1998), astro-ph/9712318.
- (20) T.M. Venters, V. Pavlidou, and L.C. Reyes, Astrophys.J. 703, 1939 (2009), arXiv:0909.1571.
- (21) B.D. Fields, V. Pavlidou, and T. Prodanovic, Astrophys.J. 722, L199 (2010), arXiv:1003.3647.
- (22) A.A. Abdo et al, Phys. Rev. Lett. 104, 101101 (2010), arXiv:1002.3603.
- (23) A.A. Abdo et al, Astrophys.J. 720, 435 (2010), arXiv:1003.0895.
- (24) F. Aharonian et al., Phys. Rev. Lett. 97, 221102 (2006), astro-ph/0610509.
- (25) M. Cirelli et al. JCAP 1103, 51 (2011), arXiv:1012.4515.