Experimental evidence for the coupling of Li-motion and structural distortions in LiMnPO4
Abstract
We present a detailed 7Li- and 31P-NMR study on single crystalline LiMnPO4 in the paramagnetic and antiferromagnetic phase (AFM, K). This allows us to determine the spin directions in the field-induced spin-flop phase. In addition, the anisotropic dipolar hyperfine coupling tensor of the 7Li- and 31P-nuclei is also fully determined by orientation and temperature dependent NMR experiments and compared to the calculated values from crystal structure data. Deviations of the experimental values from the theoretical ones are discussed in terms of Mn disorder which is induced by Li-disorder. In fact, the disorder in the Mn-sublattice is directly revealed by our diffuse x-ray scattering data. The present results provide experimental evidence for the Li-diffusion strongly coupling to structural distortions within the MnPO4 host, which is expected to significantly affect the Li-mobility as well as the performance of batteries based on this material.
pacs:
76.60.-k, 75.25.+z, 75.50.Ee, 61.10.NzI Introduction
Since the pioneering work of Padhi et al. Padhi et al. (1997) in 1997, the phospho-olivine materials are highly interesting for an application in rechargeable lithium batteries. LiMnPO4 is a member of the olivine type lithium phosphate family and features several advantages regarding battery technology such as excellent chemical and thermal stability, non-toxicity in contrast to LiCoO2, and economic viability and availability of the raw materials Nie et al. (2010); Martha et al. (2009); Li et al. (2002). Despite these clear advantages of LiMnPO4 for battery applications, there are also reports about its poor electrochemical performancePadhi et al. (1997); Asari et al. (2011); Yamada and Chung (2001); Yamada et al. (2001). The reasons for this currently remain unclear, but it has been found that LiMnPO4 incorporated in carbon coated nanostructures provides a competitive next generation cathode material with a stable reversible capacity up to 145 mAh/g and a rather flat discharge voltage curve at 4.1 V Wang et al. (2009); Aravindan et al. (2013).
Besides its relevance for battery applications LiMnPO4 also exhibits interesting magnetic properties. More specifically, applying a magnetic field leads to a spin flop phase with a slight ferromagnetic canting, which could exhibit magnetoelectric effects Toft-Petersen et al. (2012). In addition, in LiMPO4 with M = Co or Ni unusual ferrotoroidic domains have been discovered Van Aken et al. (2007).
In this article we address the origin of the poor electrochemical performance of LiMnPO4 as well as the possible magnetoelectric effect in this material. To this end, we performed full orientation and temperature dependent 7Li and 31P NMR experiments on a single crystal of LiMnPO4. This allowed us to determine the complete dipolar hyperfine coupling tensor which is compared to the calculated one from the positions of the atoms in the unit cell. Deviations of the experimentally obtained hyperfine coupling tensors from the calculated tensors and an anomalous broadening of the resonance lines in the paramagnetic phase are discussed in terms of Mn disorder in the samples. The conclusions from NMR are corroborated by our diffuse x-ray diffraction (HE-XRD) experiments, which directly reveal the disorder in the Mn-sublattice. The NMR spectra in the AFM phase have been measured at 4.2 K, and the number of resonance lines agrees with the calculated spectra. Furthermore, the spectra allowed us to determine the spin directions in the spin-flop phase as well as the tilt of the spins due to the applied external magnetic field, which is important in order to assess the possible magnetoelectric effect in this material.
Our findings of Mn disorder in LiMnPO4 provides firm experimental evidence that the movement of Li within LiMnPO4 is strongly coupled to the lattice. Certainly, this affects also the mobility of the Li in LiMnPO4, and therefore the performance of this material as a battery. Interestingly, our results are perfectly consistent with a recent theoretical study which found a formation of a vacancy-polaron complex by a lithium vacancy and a corresponding hole-polaron at the fully lithiated limit owing to lattice distortion and Coulomb interaction between them Asari et al. (2011), and thereby explaining the poor electrochemical performance of LiMnPO4 if non-carbon coated microstructures or single crystals are considered.
II Experimental details
II.1 Sample preparation and characterization
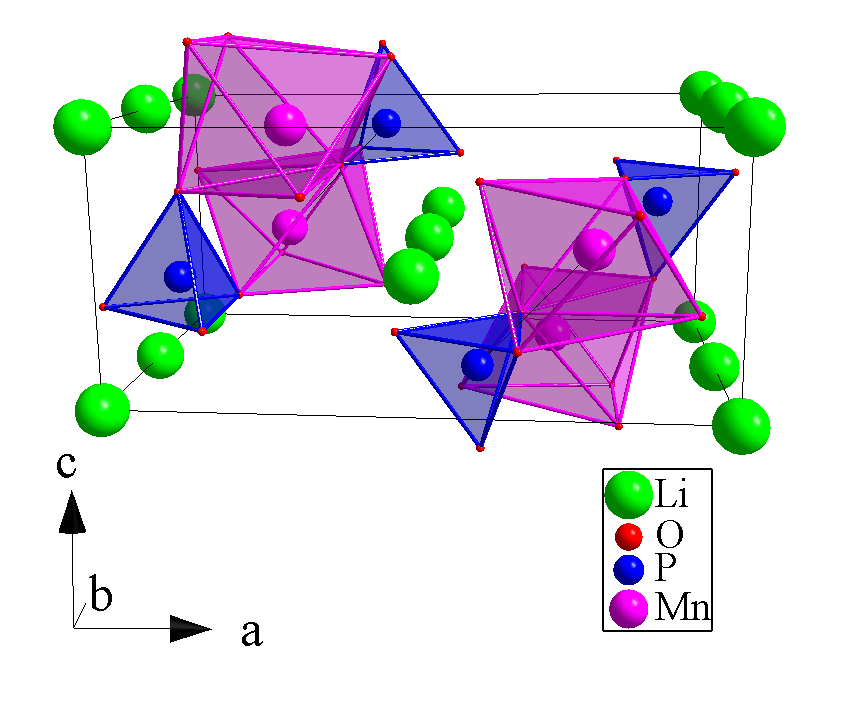
The single crystal investigated in this work was grown at the IFW Dresden by the floating-zone method Wizent et al. (2009, 2011). A phase pure single crystalline grain of the approximate size of 2 2 4 mm was cut out of the grown rod. The phase purity was checked by x-ray diffraction measurement. The crystal structure of LiMnPO4 shown in Fig. 1 belongs to the Pnma spacegroup. The Mn atoms are surrounded by distorted octahedra of oxygen atoms. The P atoms are tetrahedrally surrounded by oxygen atoms forming PO groups Mays (1963). There are four Li and four P positions which are crystallographically equivalent. The Mn ions are in a Mn2+ state resulting in a spin of and an effective magnetic moment of 5.9 Wizent et al. (2009). The Mn magnetic moments align antiferromagnetically below K Wizent et al. (2009) along the a-axis Li et al. (2009).
II.2 NMR and Hyperfine Coupling Tensor
Nuclear Magnetic Resonance (NMR) is an ideal tool to study both the Li diffusion process, which is important for application in lithium ion batteries, as well as the local magnetic properties. The Li diffusion process determines the mobility of the Li ions in a material and can be investigated by 7Li-NMR linewidth and spin lattice relaxation measurements Heitjans and Kärger (2005); Nakamura et al. (2006), while the magnetism can be probed by any nucleus in the material that is coupled to the magnetic ion. For both processes, the detailed knowledge of the hyperfine coupling tensor between the electron spin and the nuclear probes –here the nuclear spins of 7Li and 31P– is helpful.
All NMR experiments reported here are done at a constant field of T. For orientation dependent NMR measurements a probe with a single axis goniometer was used which allows to rotate the sample by a certain angle inside the magnet. The temperature dependent NMR measurements were done in a temperature range from 4.2 K up to 420 K. In the following, only the dipolar hyperfine coupling will be described in detail, since as we will see the other hyperfine couplings are either negligible (quadrupolar coupling, diamagnetic and orbital shift) or isotropic (Fermi contact from unpaired -electrons on the 31P).
The Hamiltonian describing the dipolar coupling of the nuclear spin to the Mn electronic spins is expressed by
| (1) |
Where represents the dipolar field of the electronic spin located at the Mn site. corresponds to the gyromagnetic ratio of the nuclei 7Li and 31P (=16.5461 MHz, =17.2347 MHz). is the gyromagnetic ratio of the electron. The nuclear and th electron spin are represented by and respectively. The anisotropic dipolar coupling between the nuclear and the electron spins is described by the dipolar hyperfine coupling tensor (see e.g. Abragam (1961)). It has been calculated for the paramagnetic and AFM phase from the crystal structure data.
All electron spins within a sphere with a radius of 100 Å have been considered, leading to the same tensor elements of as reported by Mays et al. Mays (1963). The different positions in the crystal of the 7Li and the 31P naturally lead to different dipolar hyperfine coupling tensors and , respectively. Crystallographically, there are four equivalent 7Li and 31P sites in the unit cell. However, for each nucleus, the diagonal elements of are the same, whereas the off diagonal elements are different. Therefore, for both nuclei, single resonance lines are expected for and , whereas the different off diagonal elements lead to a splitting of the resonance lines for angles off these high symmetry directions in the paramagnetic phase.
In the antiferromagnetically ordered state, vanishes, i.e. no internal, dipolar field remains at the Li sites, leading to an unshifted single resonance line for the 7Li. The calculation of leads to four magnetically inequivalent P sites in the AFM phase. Note that the diagonal elements of these P sites are different. Therefore, up to four 31P-NMR lines are expected in the AFM phase. The calculated tensor elements of the paramagnetic and the AFM phase for 7Li and 31P nuclei are listed in Tab. 1 where a comparison of calculated and experimentally determined values is given.
II.3 X-ray diffraction experiments
Complementary structural information has been obtained by high-energy x-ray diffraction (HE-XRD) studies on the same single crystal. The experiments were performed at the beamline BW5 at the HASYLAB in Hamburg, using x-rays with photon energies of 100 keV. Due to the large penetration depths at this energy (1 mm), surface effects have no influence on the detected signal, ensuring the detection of real bulk properties. We performed triple-axis diffraction in horizontal Laue geometry utilizing the (111) reflection of a Si/Ge-monochromator and Si/Ge-analyzer crystal.
III Results and Discussion
III.1 NMR spectra and temperature dependence
In Fig. 2 the 7Li- and 31P-NMR spectra are shown for , , and at 292 K. Due to the anisotropy of the dipolar hyperfine couplings and the resonance frequency is different for the different orientations.
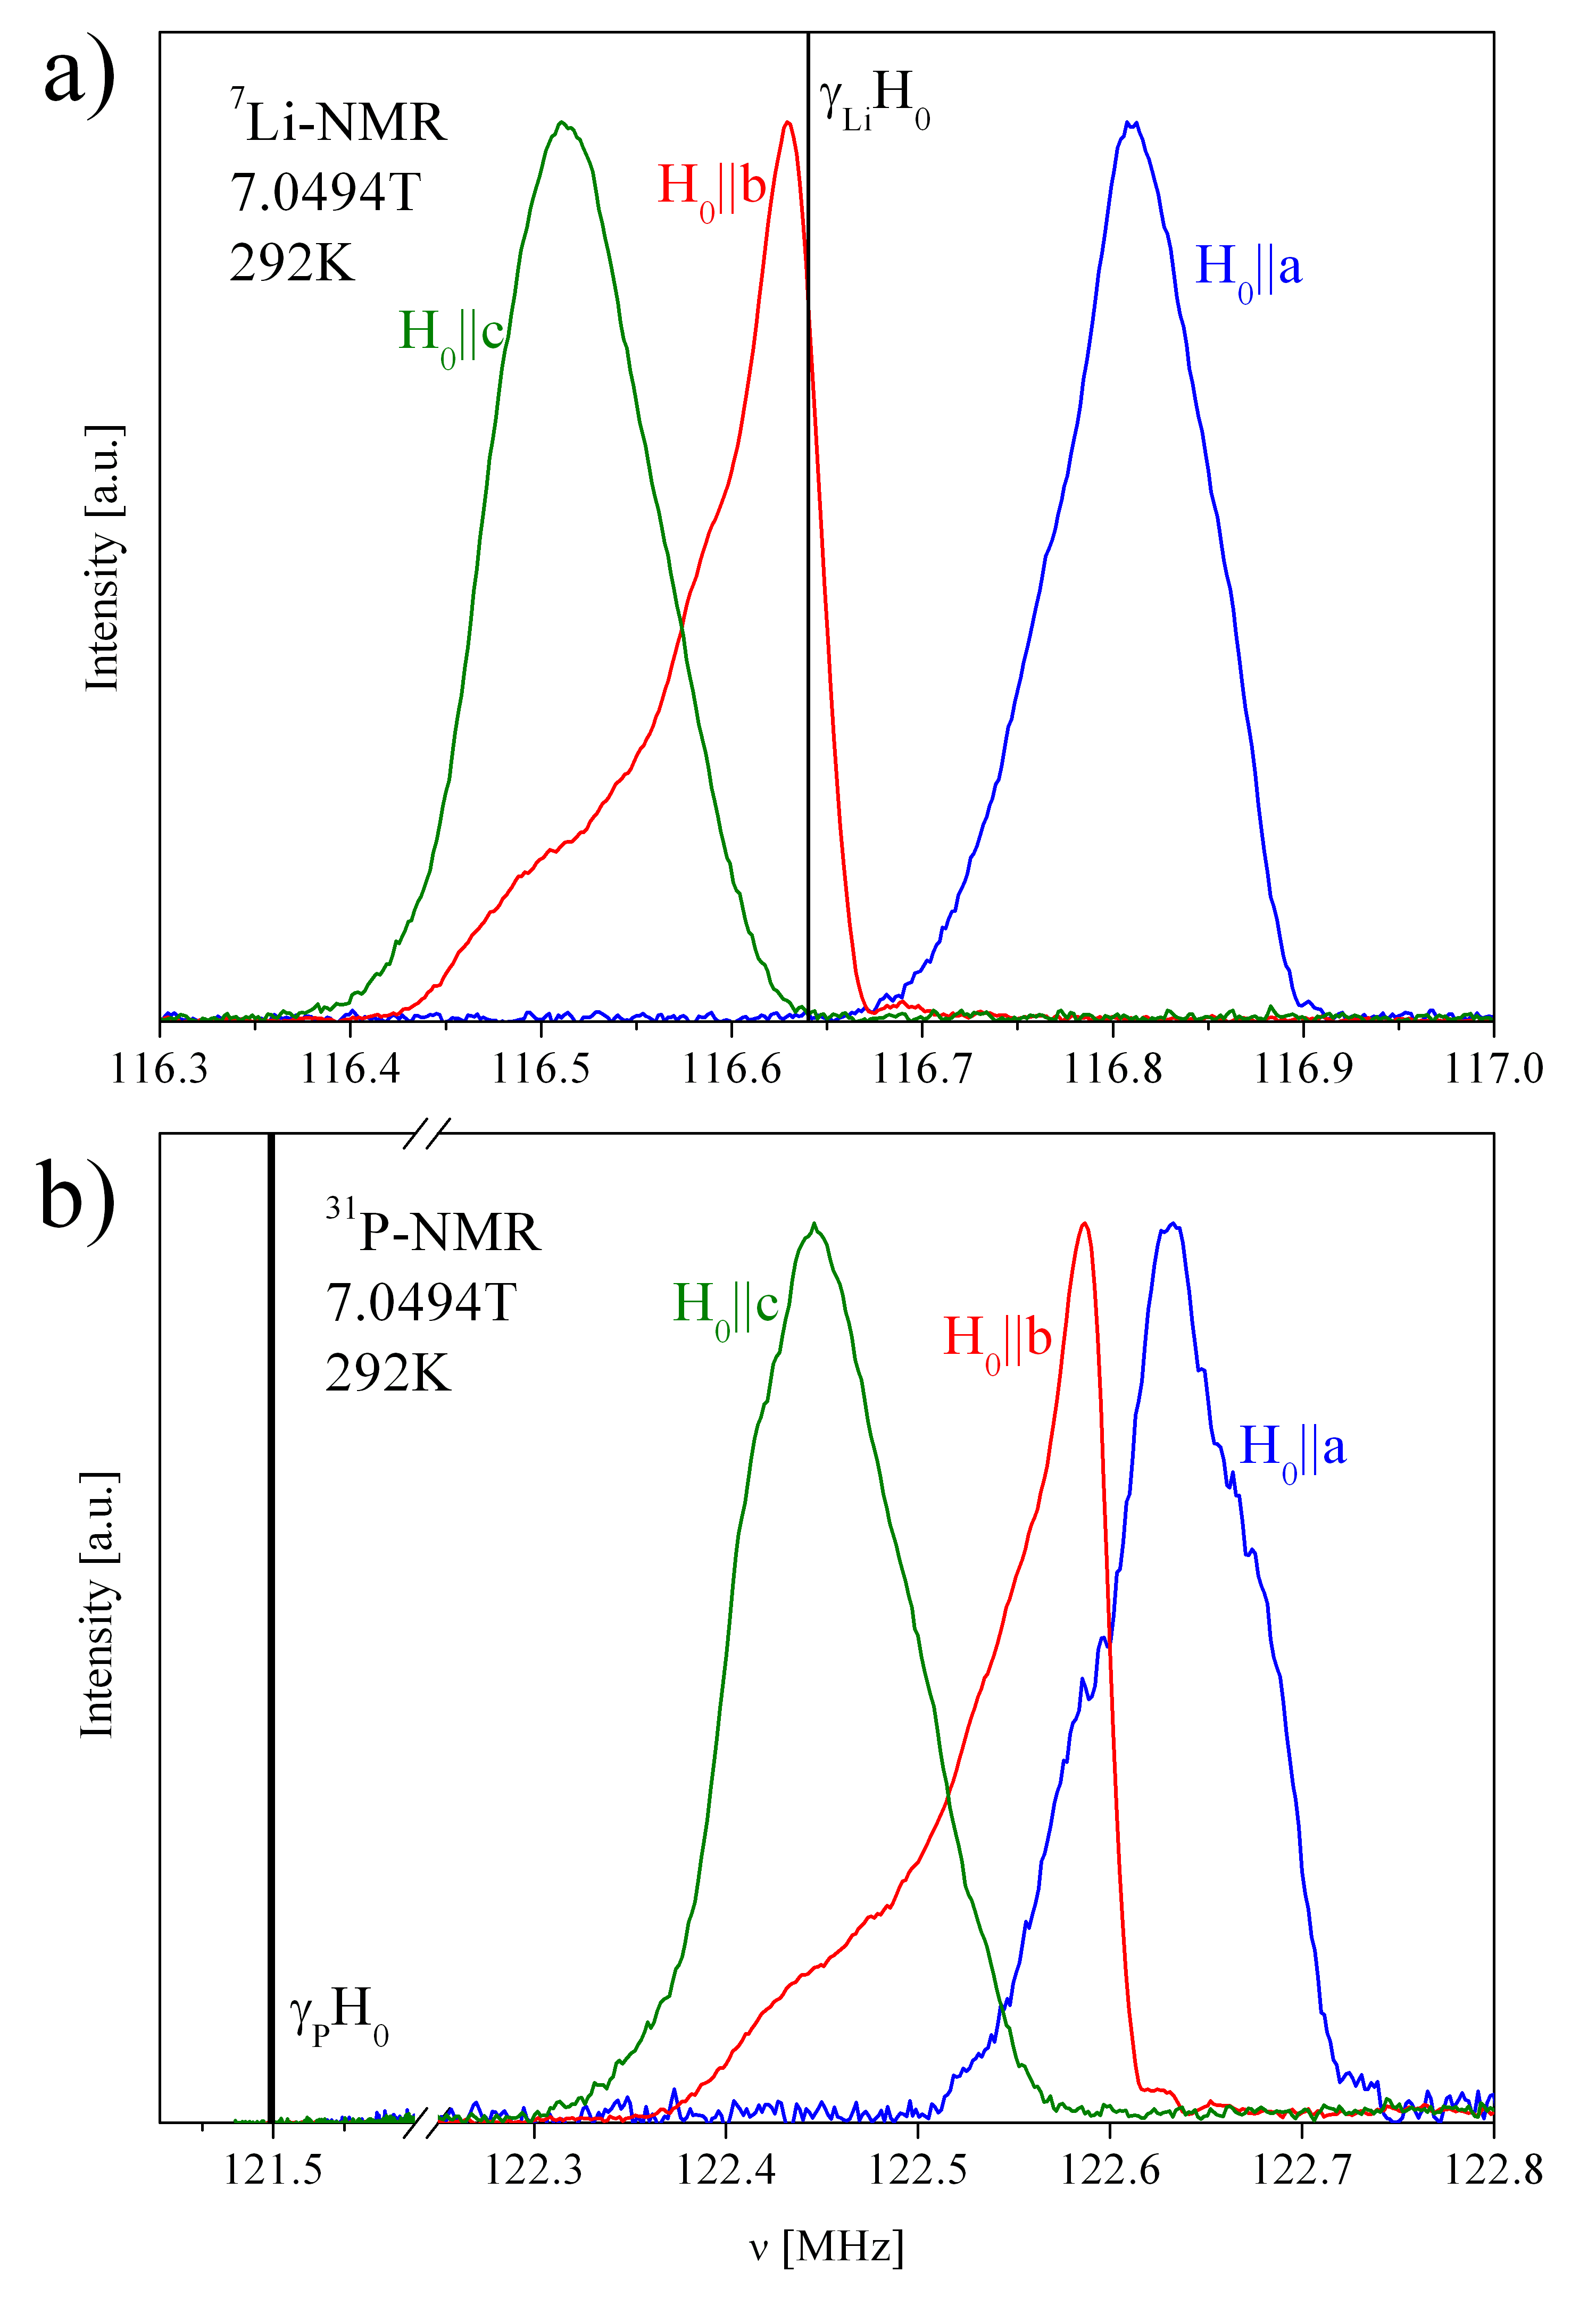
The 7Li-NMR spectra for all different orientations are spanning a frequency interval of 500 kHz at 292 K. This value agrees well with the full width of 7Li-NMR spectra in LiMnPO4 powder samples reported in Arcon et al. (2004). The linewidth shows a linear field dependence (e.g. (7T) 80 kHz, whereas (3T) 40 kHz). This indicates a dipolar broadening, where each 7Li (31P) nucleus sees a slightly different dipolar hyperfine field of the Mn electronic spins. However, the asymmetric shape of the resonance lines (especially for ) differs much from the expected Gaussian shape of a resonance line in a single crystal, indicating a substantial amount of disorder in the sample. For this reason, we have calculated the Knight shift of the 7Li and 31P from the center of gravity of the resonance lines, and the width of the spectra has been determined by the square root of the second moment.
Furthermore, a comparison of the resonance lines in Fig. 2 shows that for the corresponding orientations the shape of 7Li- and 31P-NMR spectra are very similar. This indicates that the shape of the resonance lines of both nuclei must be affected by the same factor. If only the 7Li is disordered in the crystal, this would not affect the 31P resonance lines and vice versa.
A misalignment of the external field can be excluded, too, since the crystal was accurately oriented by making use of the angle dependence of the resonance frequencies of the 7Li- and 31P resonance lines (see Fig. 5, 6, and 7). A quadrupolar broadening or splitting of the 7Li- spectra () could also not be observed, indicating a very small electric field gradient at the Li site. Therefore, the anomalous shape of the resonance lines of both nuclei must originate either from a distribution of local moments of the Mn, i.e. a distribution of the valence of the Mn, or a distribution of the hyperfine coupling which can originate from a site disorder of the Mn. Since there are no indications for a distribution of the Mn valence Wizent et al. (2009), we conclude that there is substantial Mn site disorder. A detailed comparison of the calculated and experimental hyperfine coupling tensor elements in the following points into the same direction. Further investigations by diffusive x-ray scattering (see Chapter 4) corroborate the existence of Mn site disorder in LiMnPO4.
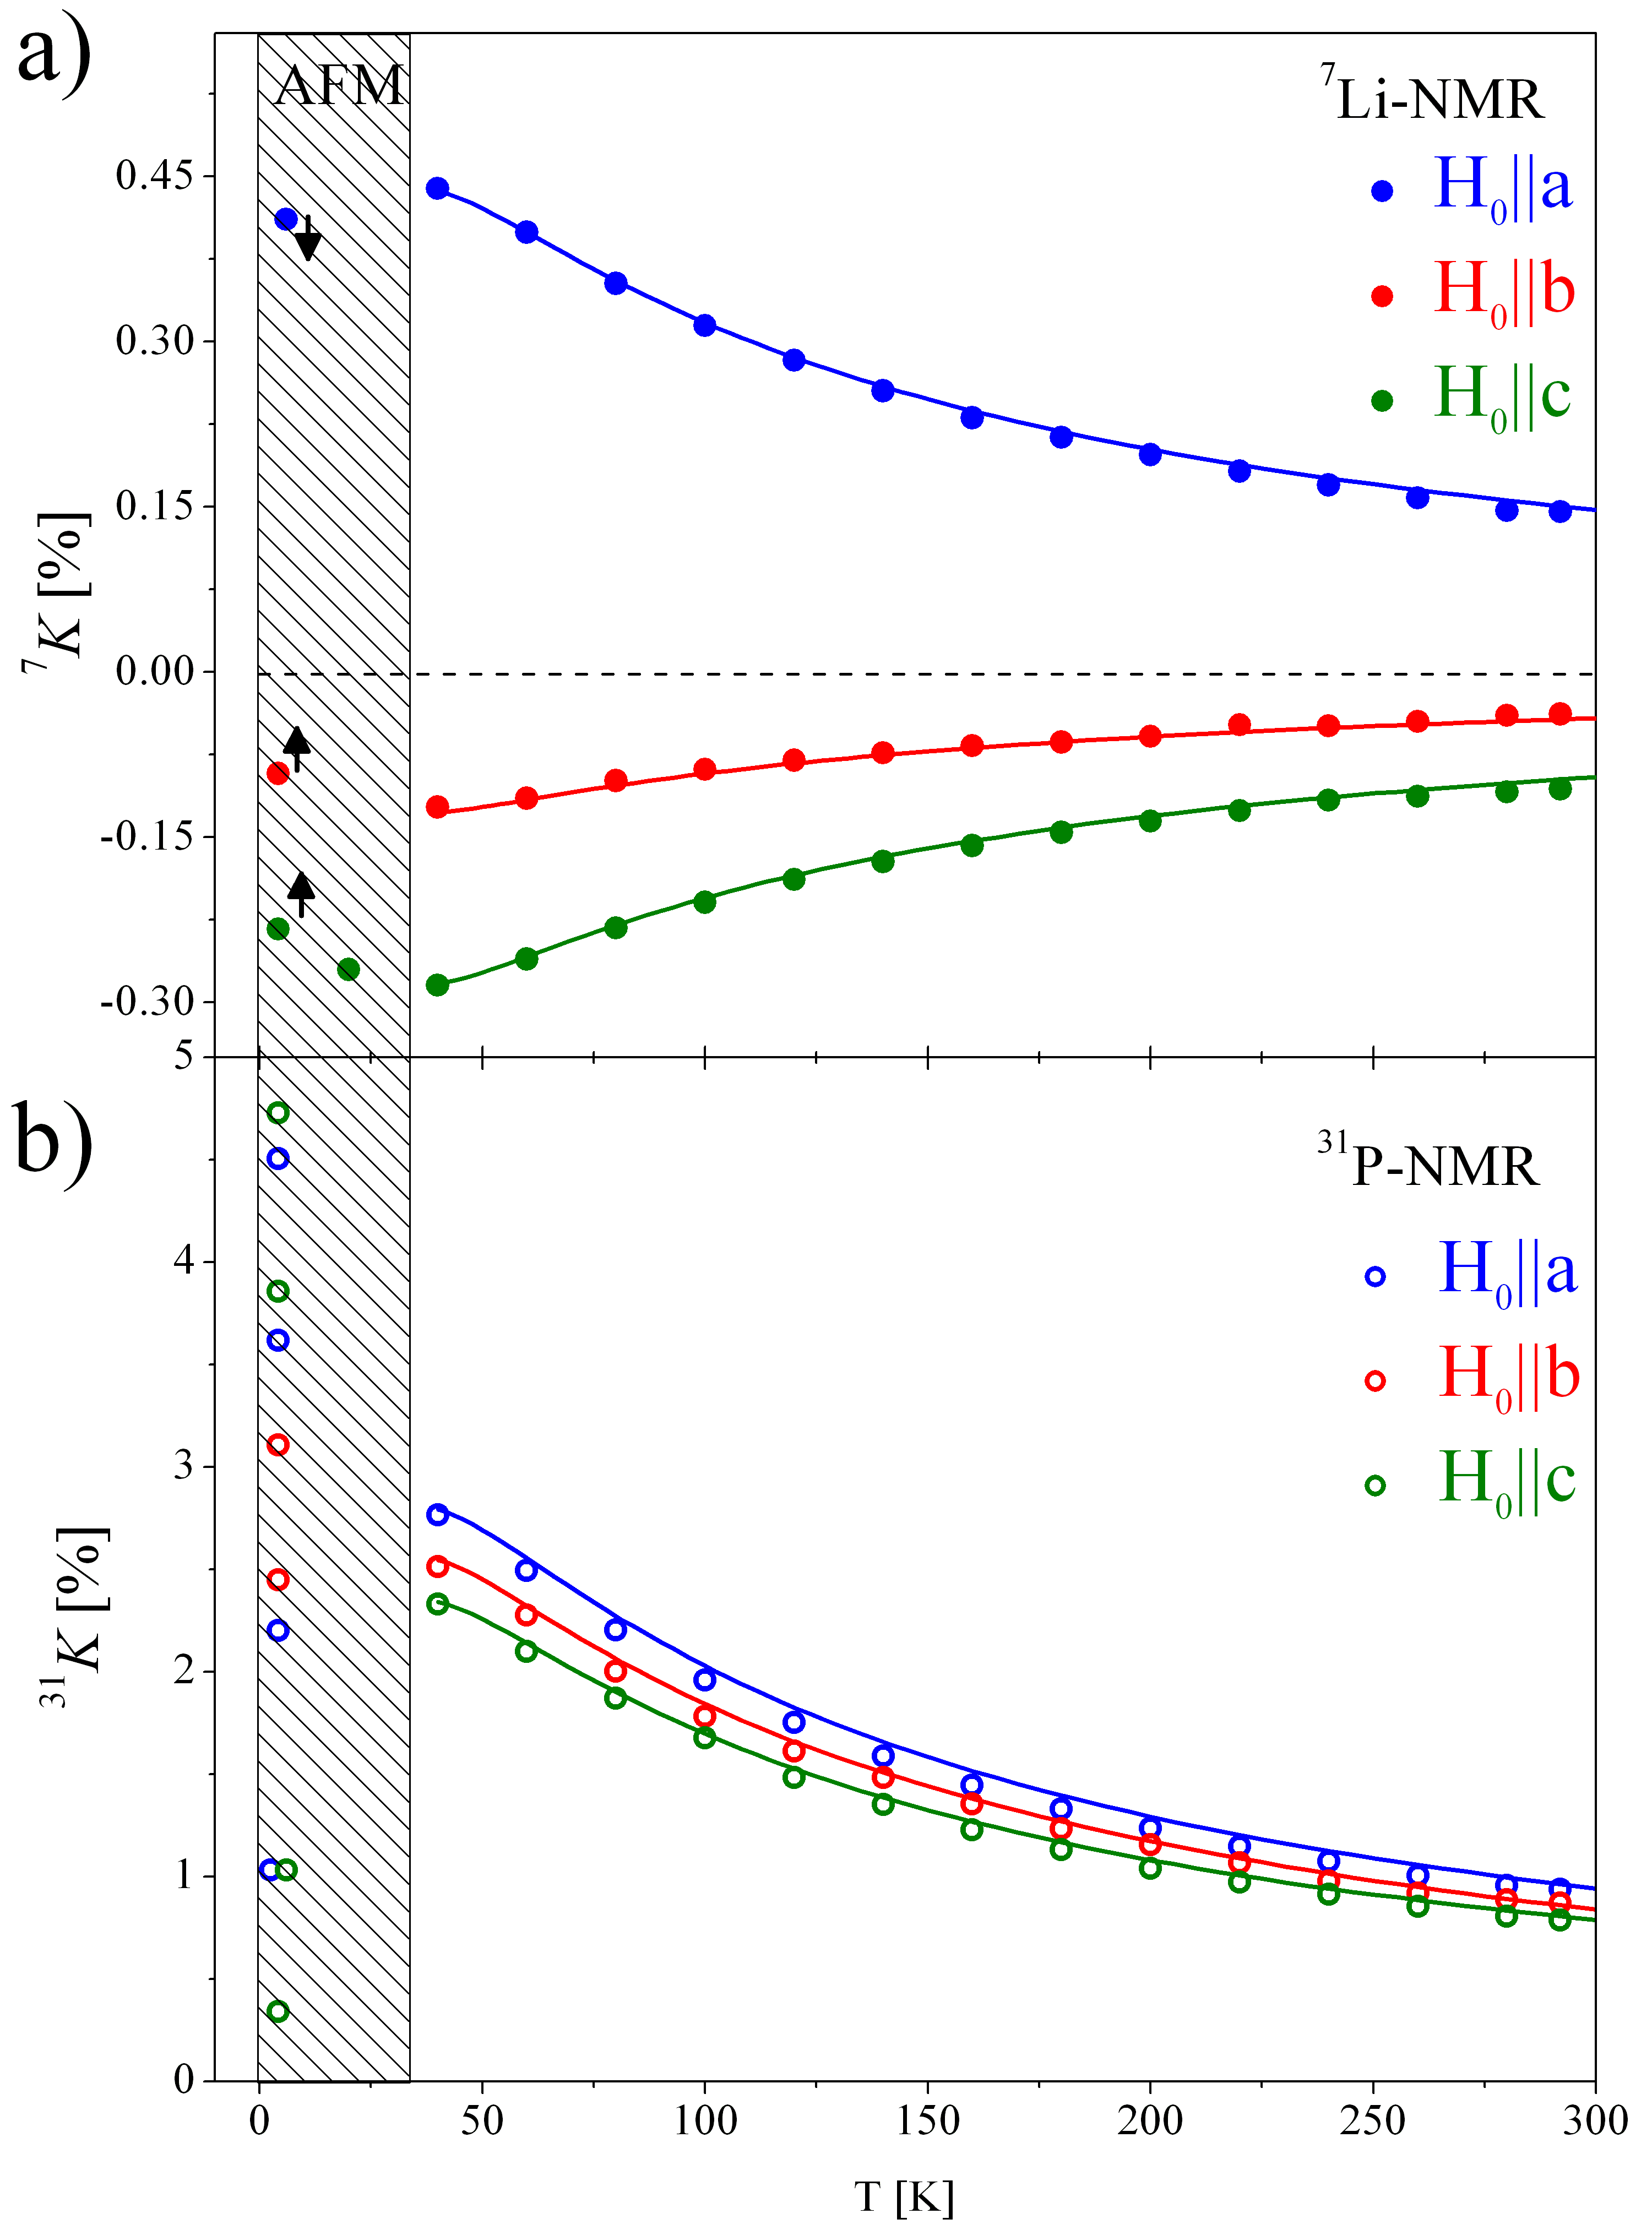
The temperature dependence of the resonance frequencies for 7Li- and 31P, , is shown in Fig. 3 (a) and (b). In the paramagnetic phase, can be described by
| (2) |
where are the diagonal dipolar hyperfine coupling tensor elements for the corresponding orientations (, , , m=1, 2, 3 respectively). The magnetic susceptibility is isotropic in the paramagnetic phase Wizent et al. (2009), and thus is a scalar in Eqn. 2. From Clogston Jaccarino plots the diagonal elements are obtained for the corresponding orientations (see Appendix Tab. 1). Since and for 7Li are negative, the resonance lines for and shift to lower frequencies. For the 31P, there is an additional temperature dependent contact term (see Fig. 2 (b)) which leads to a positive shift of the resonance frequency for all three directions. The contact term is also responsible for the large deviation of the calculated and experimentally determined coupling constants in Tab. 1. Further deviations may arise from the anomalous shape of the spectra due to the Mn disorder.
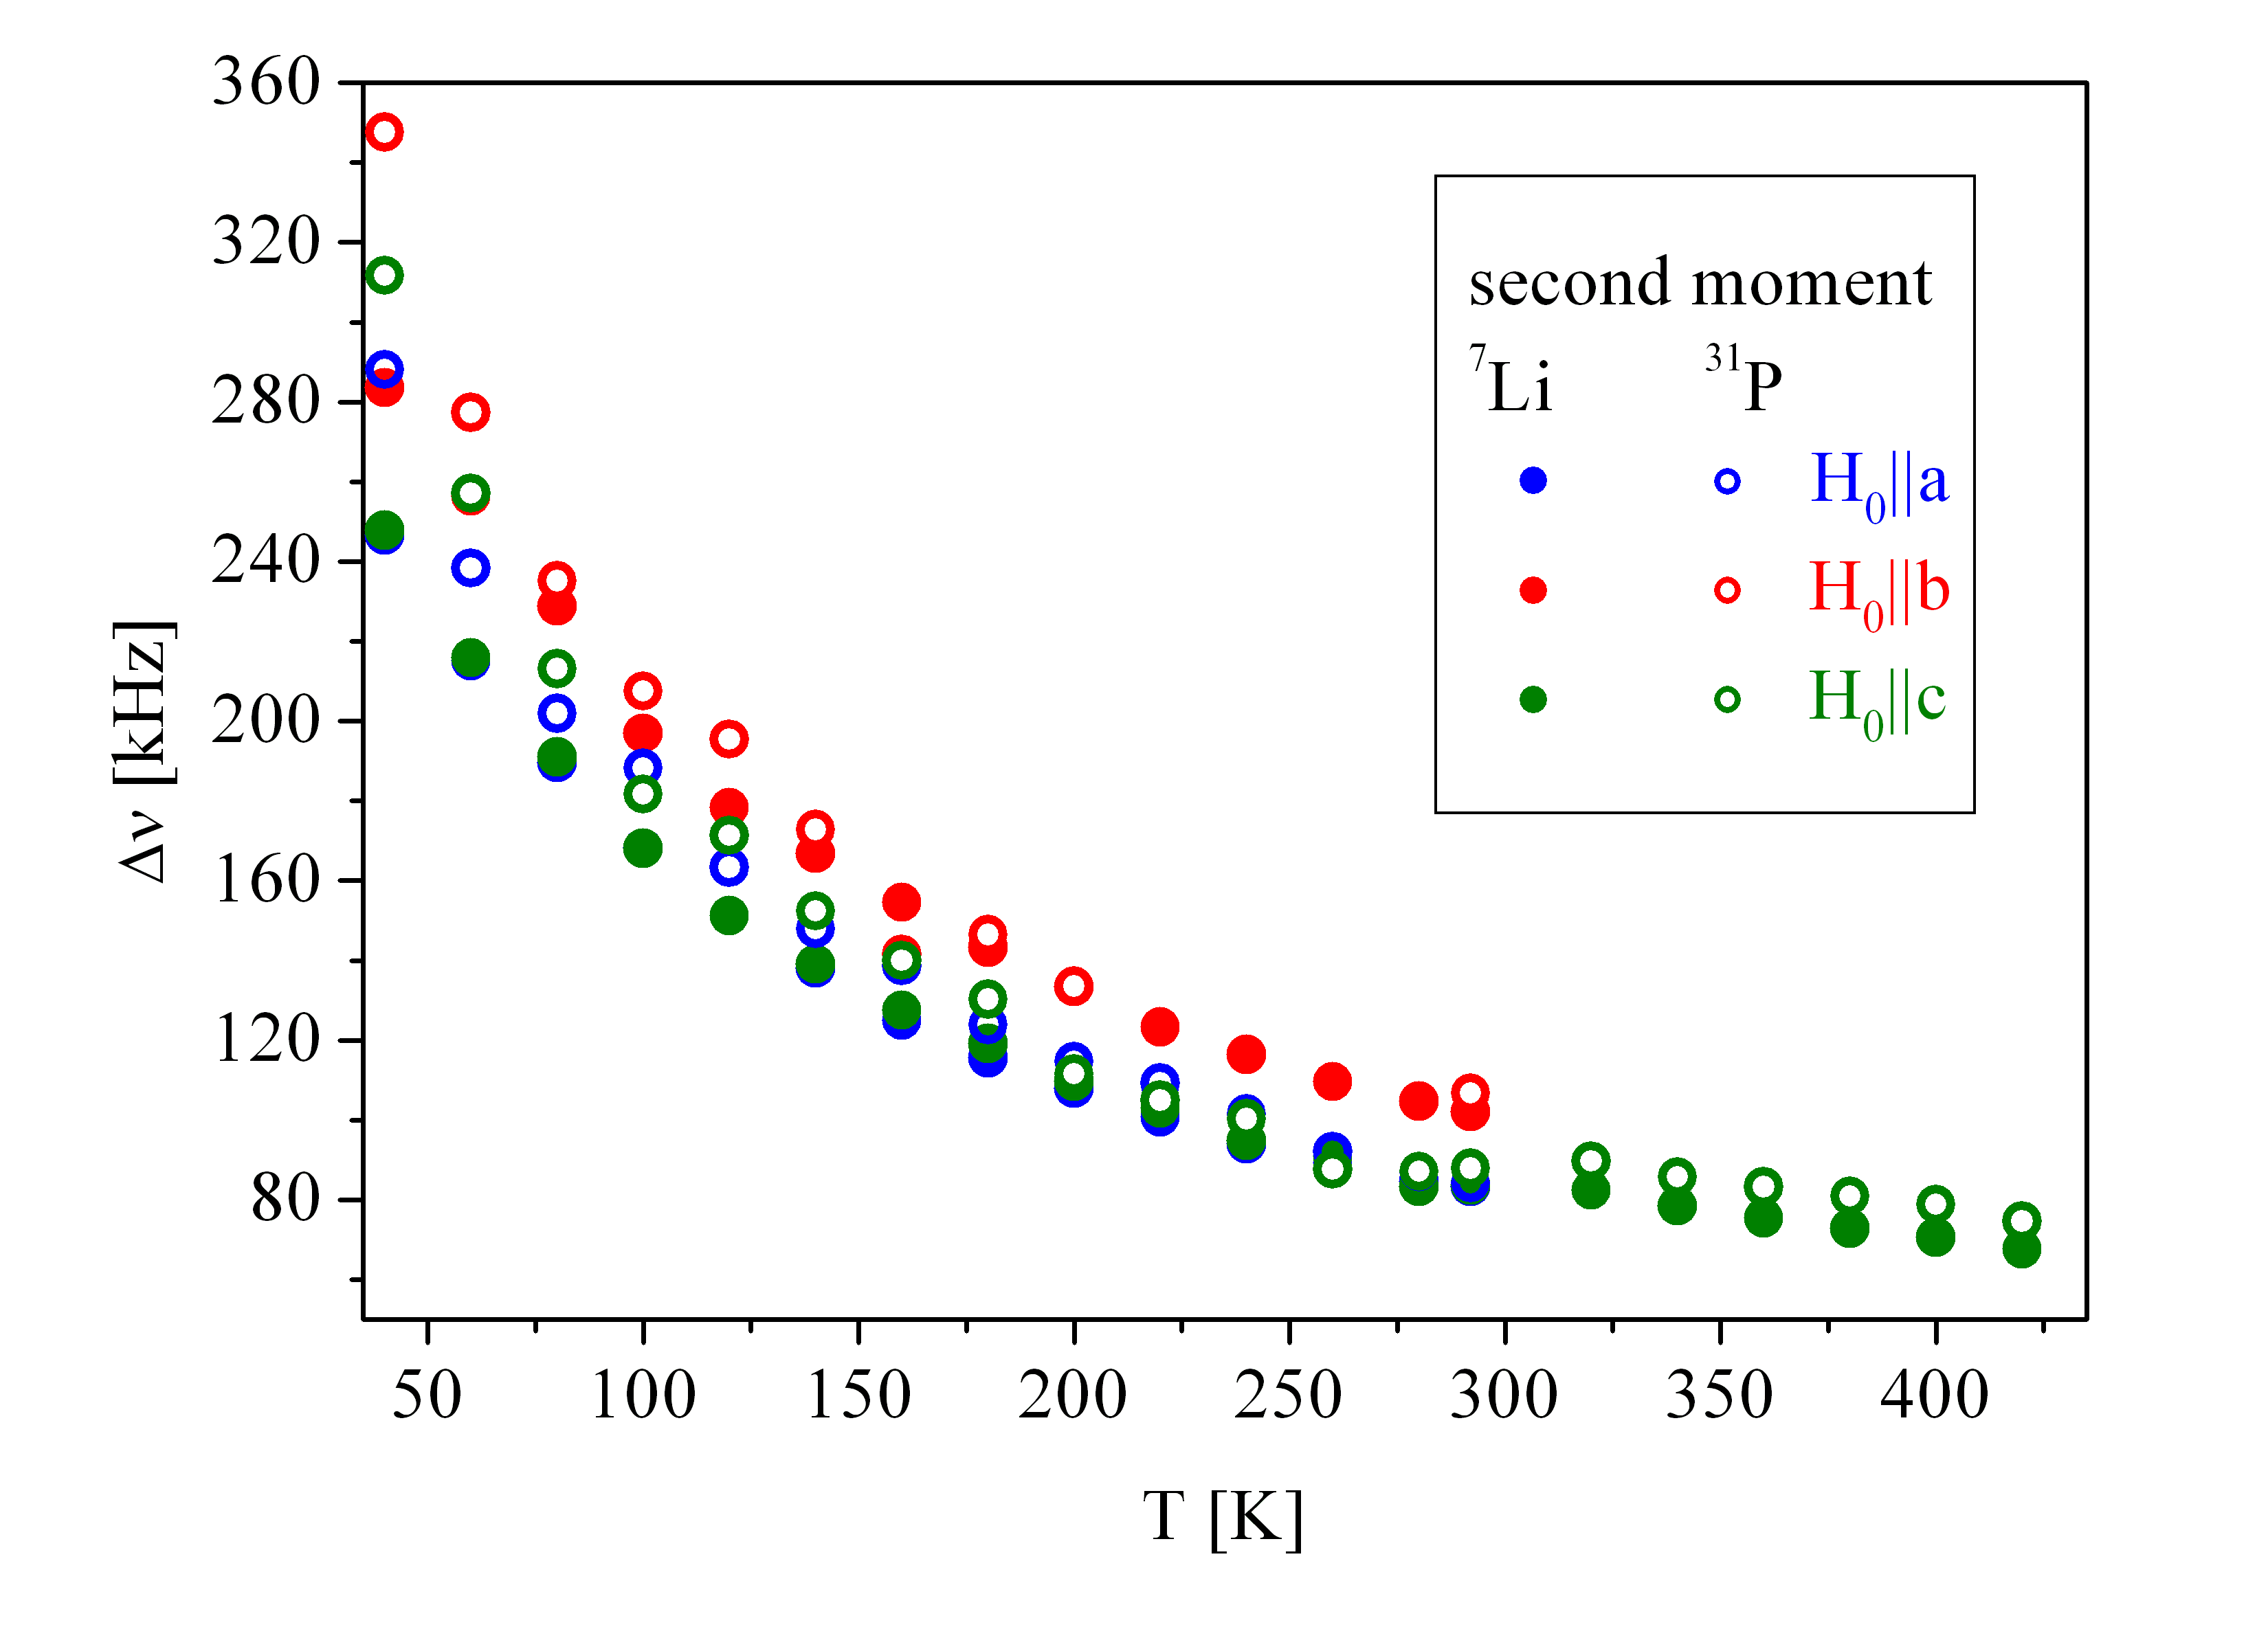
The temperature dependence of the square root of the second moment of the 7Li and 31P-NMR spectra is shown in Fig. 4. With decreasing temperature increases which is the expected behavior for magnetic broadening which scales with the susceptibility . For the spectra were measured up to 420 K (see Fig. 4). Above 300 K, the second moment is almost constant yielding a value of kHz. As can be seen in Fig. 4, of the 31P-NMR spectra is slightly larger for the corresponding orientations than of the 7Li. The reason for this could be a distribution of the hyperfine fields transferred by the contact interaction which affects only the 31P, but not the 7Li. The effect of the contact interaction is isotropic, hence the 31P-NMR spectra are broadened without additional features in the shape of the resonance line.
III.2 Angle-dependent NMR frequencies
The full experimental orientation dependence of 7Li- and 31P-NMR can be described consistently with the susceptibility data and the hyperfine coupling tensor .
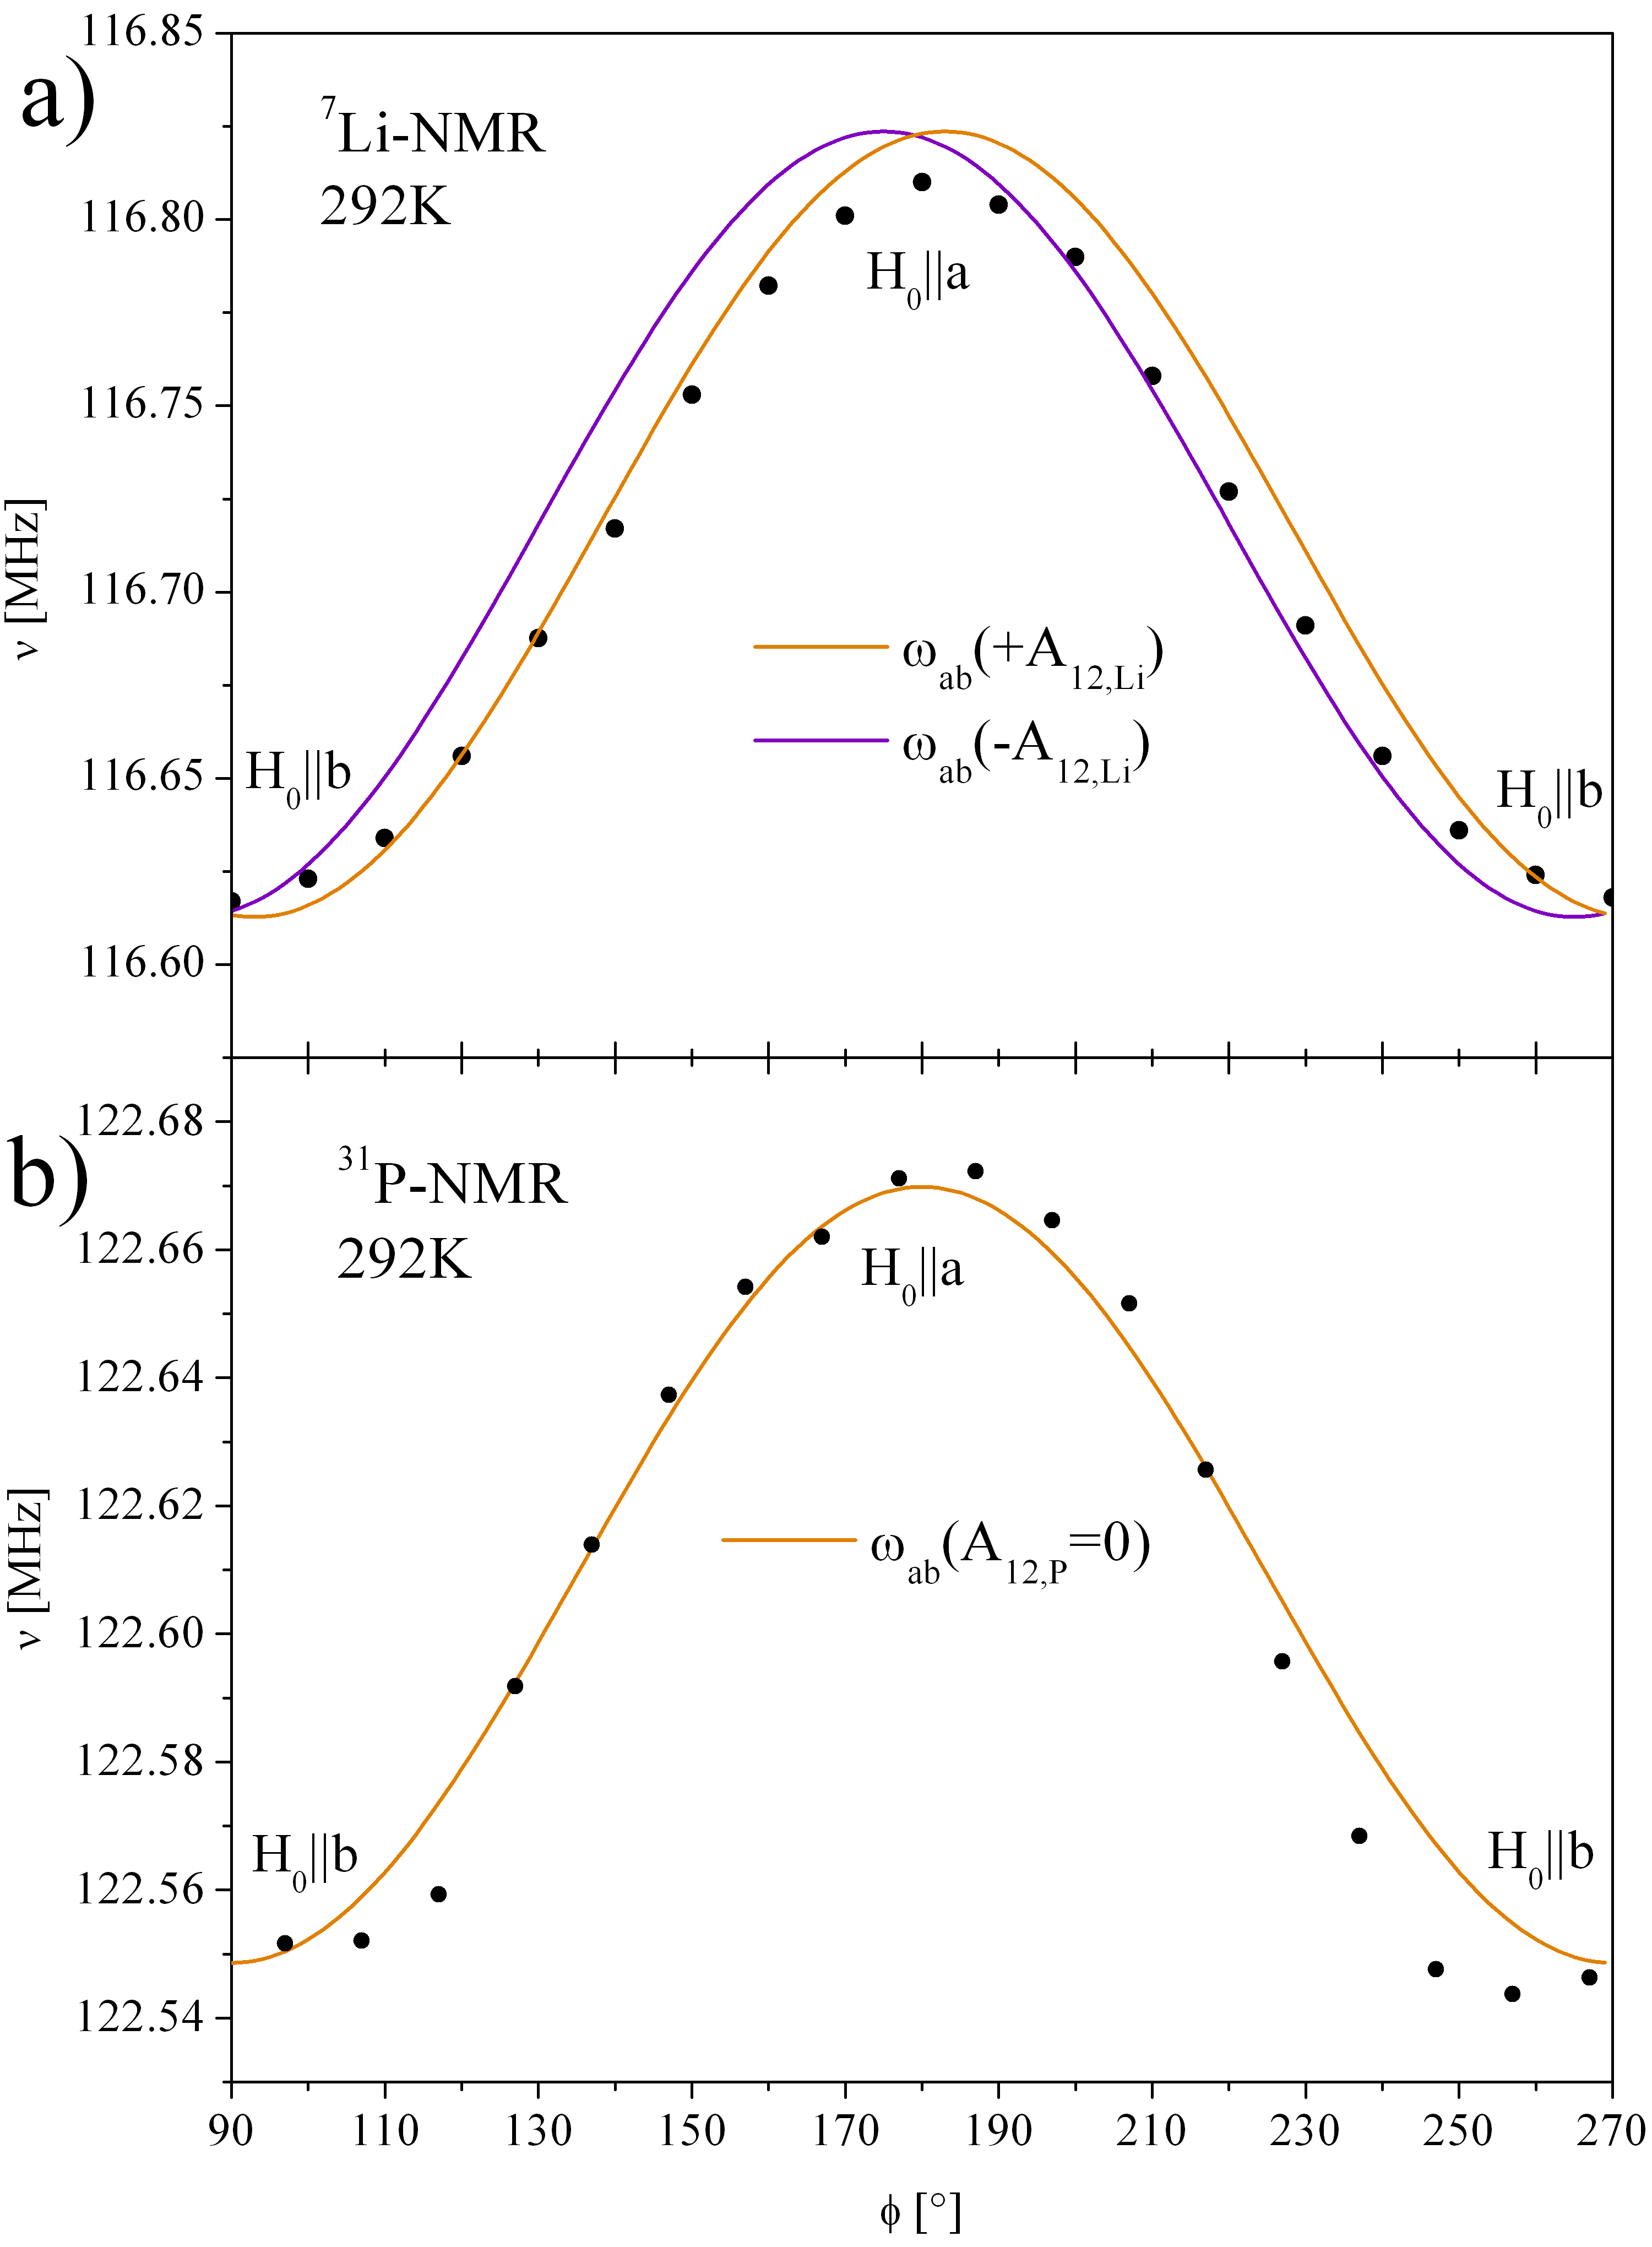
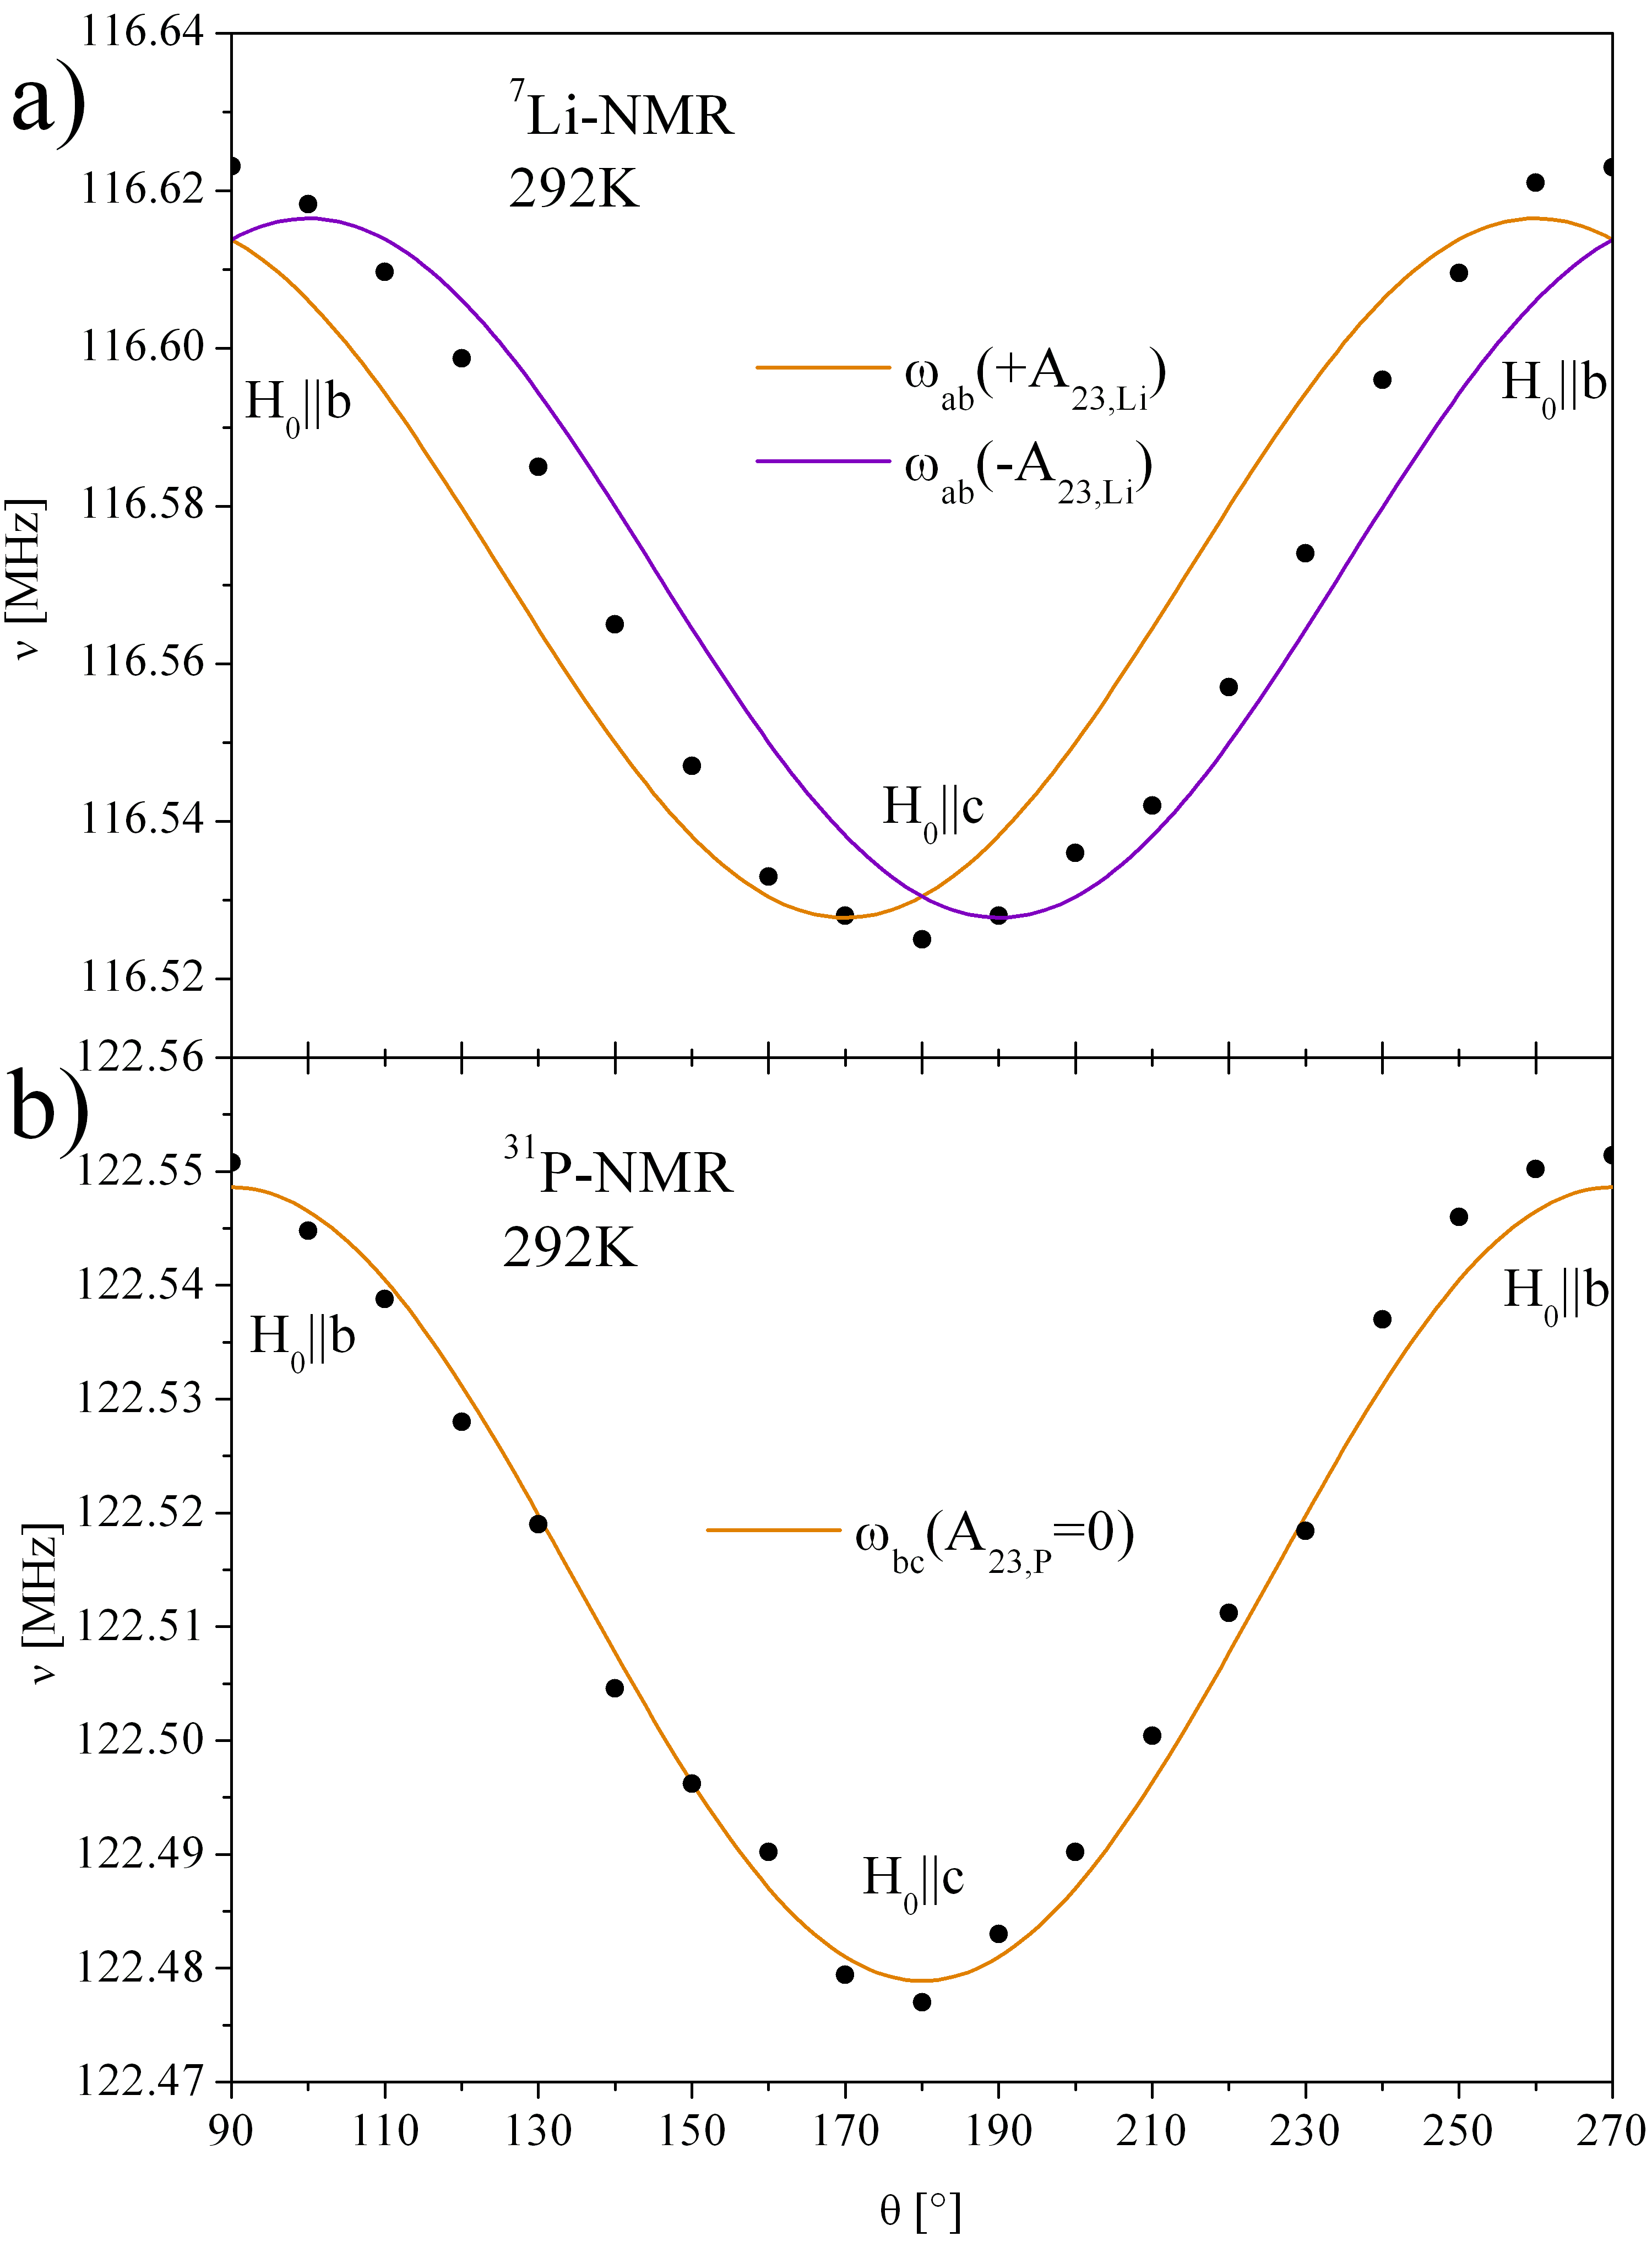
The angle-dependent NMR data was obtained by rotating the crystal around the crystal axes from to , from to , and from to at 292 K. The angle dependence at this temperature can be described by
| (3) |
where the orientation of the crystal structure in the external field is expressed by the unit vectors given in spherical coordinates. The experimental and calculated data according to Eqn. 3 are shown in Fig. 5 to Fig. 7. For the calculated curves the corresponding experimental diagonal elements and the calculated off diagonal elements are used.
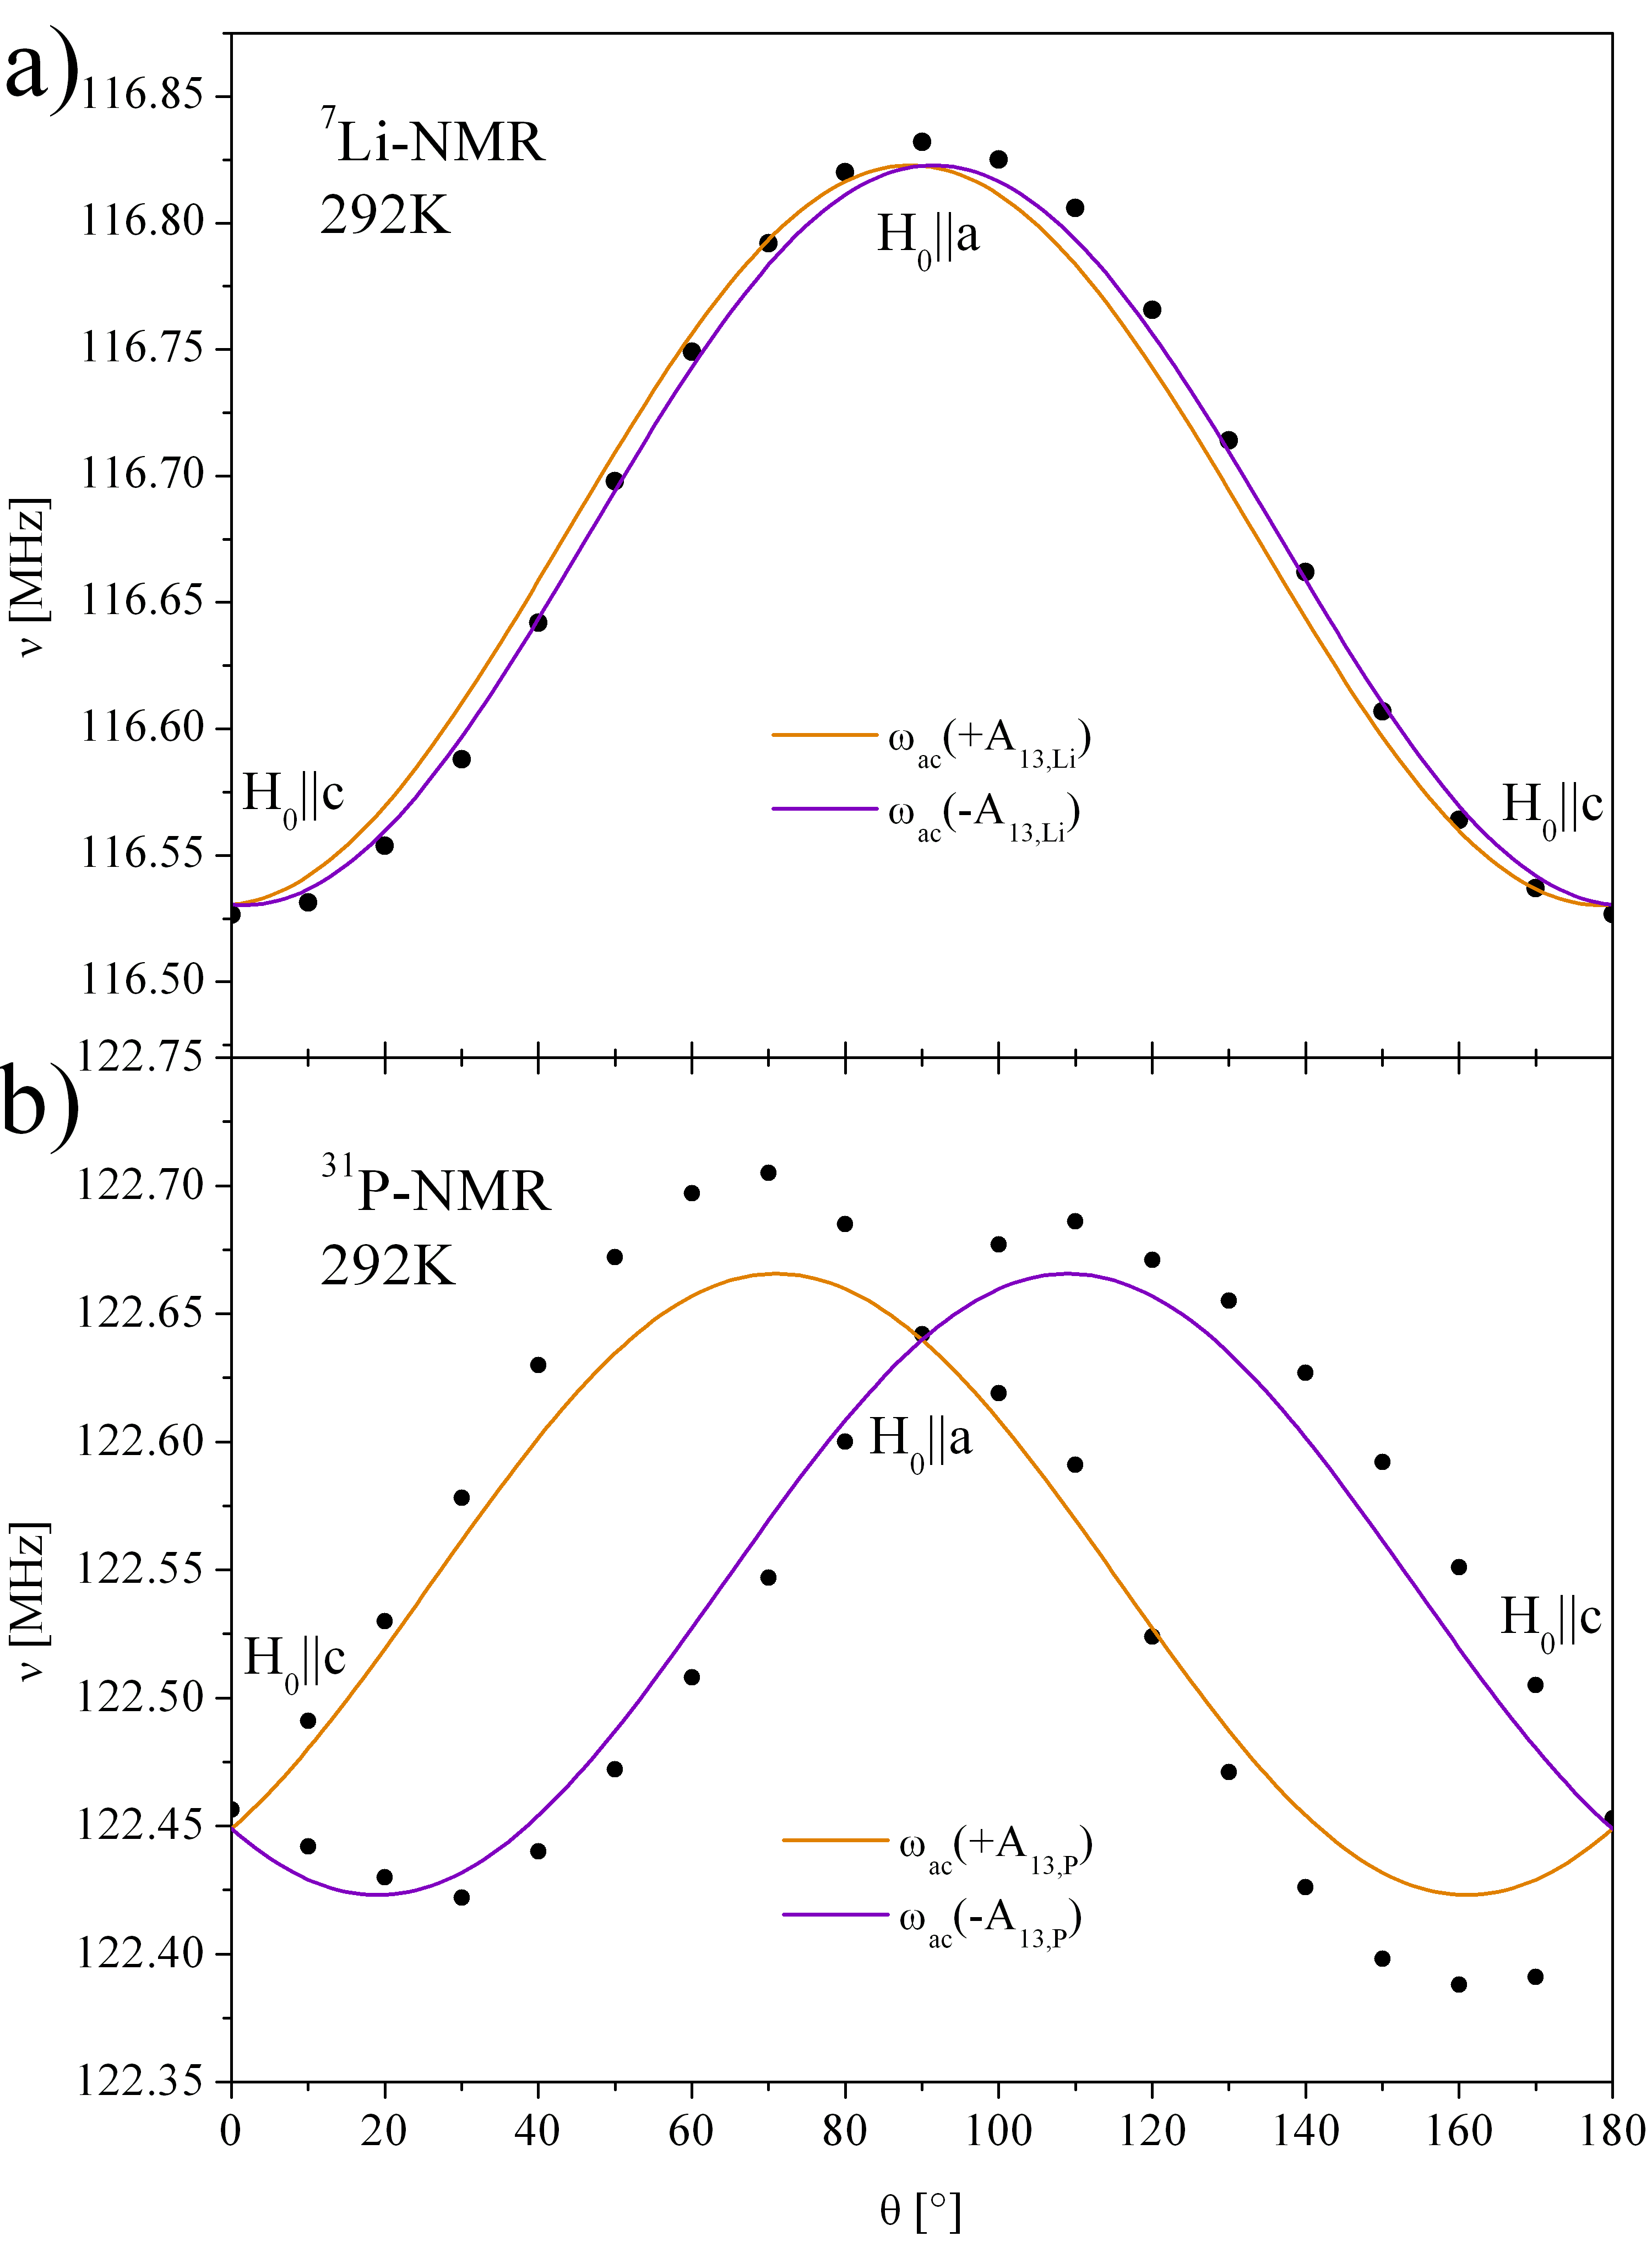
The splitting of the resonance lines for angles off the high symmetry directions is caused by the different magnetic 7Li and 31P sites (see Appendix Tab. 2). The different sites lead to positive and negative signs of the off diagonal elements , , .
In Fig. 5 (a) the 7Li-NMR spectrum shows a single resonance line in contrast to the 31P-NMR spectrum in Fig. 5 (b) which shows two resonance lines for angles off and . From comparison of the angle dependent 31P-NMR data reported in Mays (1963) and Fig. 5 (b) the crystal axes a and c are confirmed. For rotating between and , Eqn. 3 simplifies to an equation which includes only the tensor elements , , .
The absolute value of determines the size of splitting that means the difference between the violet and orange curve in Fig. 5. In the 7Li-NMR spectra the element leads to a splitting on the order of 10 kHz which is completely covered by the broad linewidth of 100 kHz. The value for 31P is 10 times larger than (see Tab. 1) and leads to a splitting of 200 kHz which can be nicely observed in the 31P-NMR spectra. Fitting the experimental 31P-NMR orientation dependent data in Fig. 5 (b) leads to experimental values for (see Appendix Tab. 1).
III.3 Discussion of the angle dependence
The angle dependence of the NMR spectra provides another indication that the broad lines and anomalous shape of the resonance lines in Fig. 2 are due to Mn disorder, and not due to differently oriented domains of the crystal. First of all, the angle dependencies of the 7Li and the 31P are completely different, but the shapes of the spectra are very similar. This can be seen in Fig. 5: whereas the 31P lines split depending on the angle , the 7Li lines do not. In contrast, the shape of the spectra for in Fig. 2 is very similar for both isotopes. An angle dependence as that of the 31P in Fig. 5 (b) would clearly lead to a different shape of the spectrum compared to the 7Li. Similar arguments hold for the other two directions. Especially for , the shape of the spectra for 7Li and 31P are very similar, but the angle dependencies in Fig. 6 and Fig. 7 are not. For example, in Fig. 6, the difference of the resonance frequency of the 7Li for and is 200 kHz, whereas it is only 120 kHz for the 31P. In contrast, the distance between the shoulder and the peak for in Fig. 2 is very similar for both isotopes, if not even larger for the 31P. The same argument is true for the linewidths in general: the angle dependent splitting is always larger for the 7Li, whereas the FWHM tends to be larger for the 31P. A broadening from differently oriented domains of a crystal would lead to the opposite trend, as can be deduced from the angle dependent measurements.
Furthermore, the comparison of the calculated and experimental tensor elements indicates the presence of an additional hyperfine interaction for the 31P nuclei, whereas the values for the 7Li in principle agree: the diagonal element determined by NMR and the value determined from the crystal structure is the same, and the values for and are showing only a small residue. The difference can be explained by the asymmetric shape of the resonance line for which is most likely due to the Mn disorder. The calculation of the resonance frequency from the center of gravity therefore leads to a smaller shift of the resonance frequency than expected from the calculated . The residue of possibly arises from the Mn disorder, too. Therefore, it can be concluded that the Mn disorder has its largest influence in b and c direction because of the larger discrepancies of and compared to . A small displacement of some of the Mn atoms from their original positions in the lattice leads to a distribution of the dipolar hyperfine couplings resulting in the broad lines and the asymmetric shape. Note that the off diagonal elements for 7Li can in principle be determined, too. However, the splitting is only very small (10-40 kHz), and therefore can not be resolved within the broad resonance lines (width 100 kHz).
In contrast to the 7Li, the comparison of the experimental and calculated diagonal hyperfine coupling elements for the 31P shows large residues (see Appendix Tab. 1). Such a discrepancy has already been reported in Mays (1963) and has been explained by non-dipolar hyperfine interactions of the 31P nucleus with unpaired (contact interaction) and/or (core polarization) electrons of the phosphorous. These unpaired and electrons arise from the Mn-O-P-O-Mn superexchange path which is responsible for the interlayer magnetic coupling Li et al. (2009). The difference between the experimental and calculated resonance frequencies of the 31P-NMR corresponds to an isotropic difference in the diagonal elements of the hyperfine coupling tensor of 0.4 T/ which underlines the isotropic character which is typical for a contact interaction.
The off diagonal element is causing a splitting of 200 kHz for angles between and which is larger than the averaged linewidth and therefore observable by 31P-NMR. From the obtained data the value of with positive and negative sign is extracted by fitting both angle dependent 31P-NMR curves in Fig. 5 (b) by using Eqn. 3. The experimental absolute values of are slightly larger. The deviations may arise from the Mn disorder.
III.4 NMR in the antiferromagnetic phase
In order to check the dipolar coupling and to investigate the influence of the spin flop on the NMR spectra, we measured the 7Li- and 31P spectra in the AFM phase at 4.2 K. In the single crystal at hand, the spin flop field at this temperature amounts to 3.9 T. The NMR spectra are shown in Fig. 8 (a) for the orientations , and . In the AFM phase the bulk susceptibility can not be used to calculate the resonance frequencies from the dipolar hyperfine coupling, because a part of electron spins changes its orientation to the opposite direction.
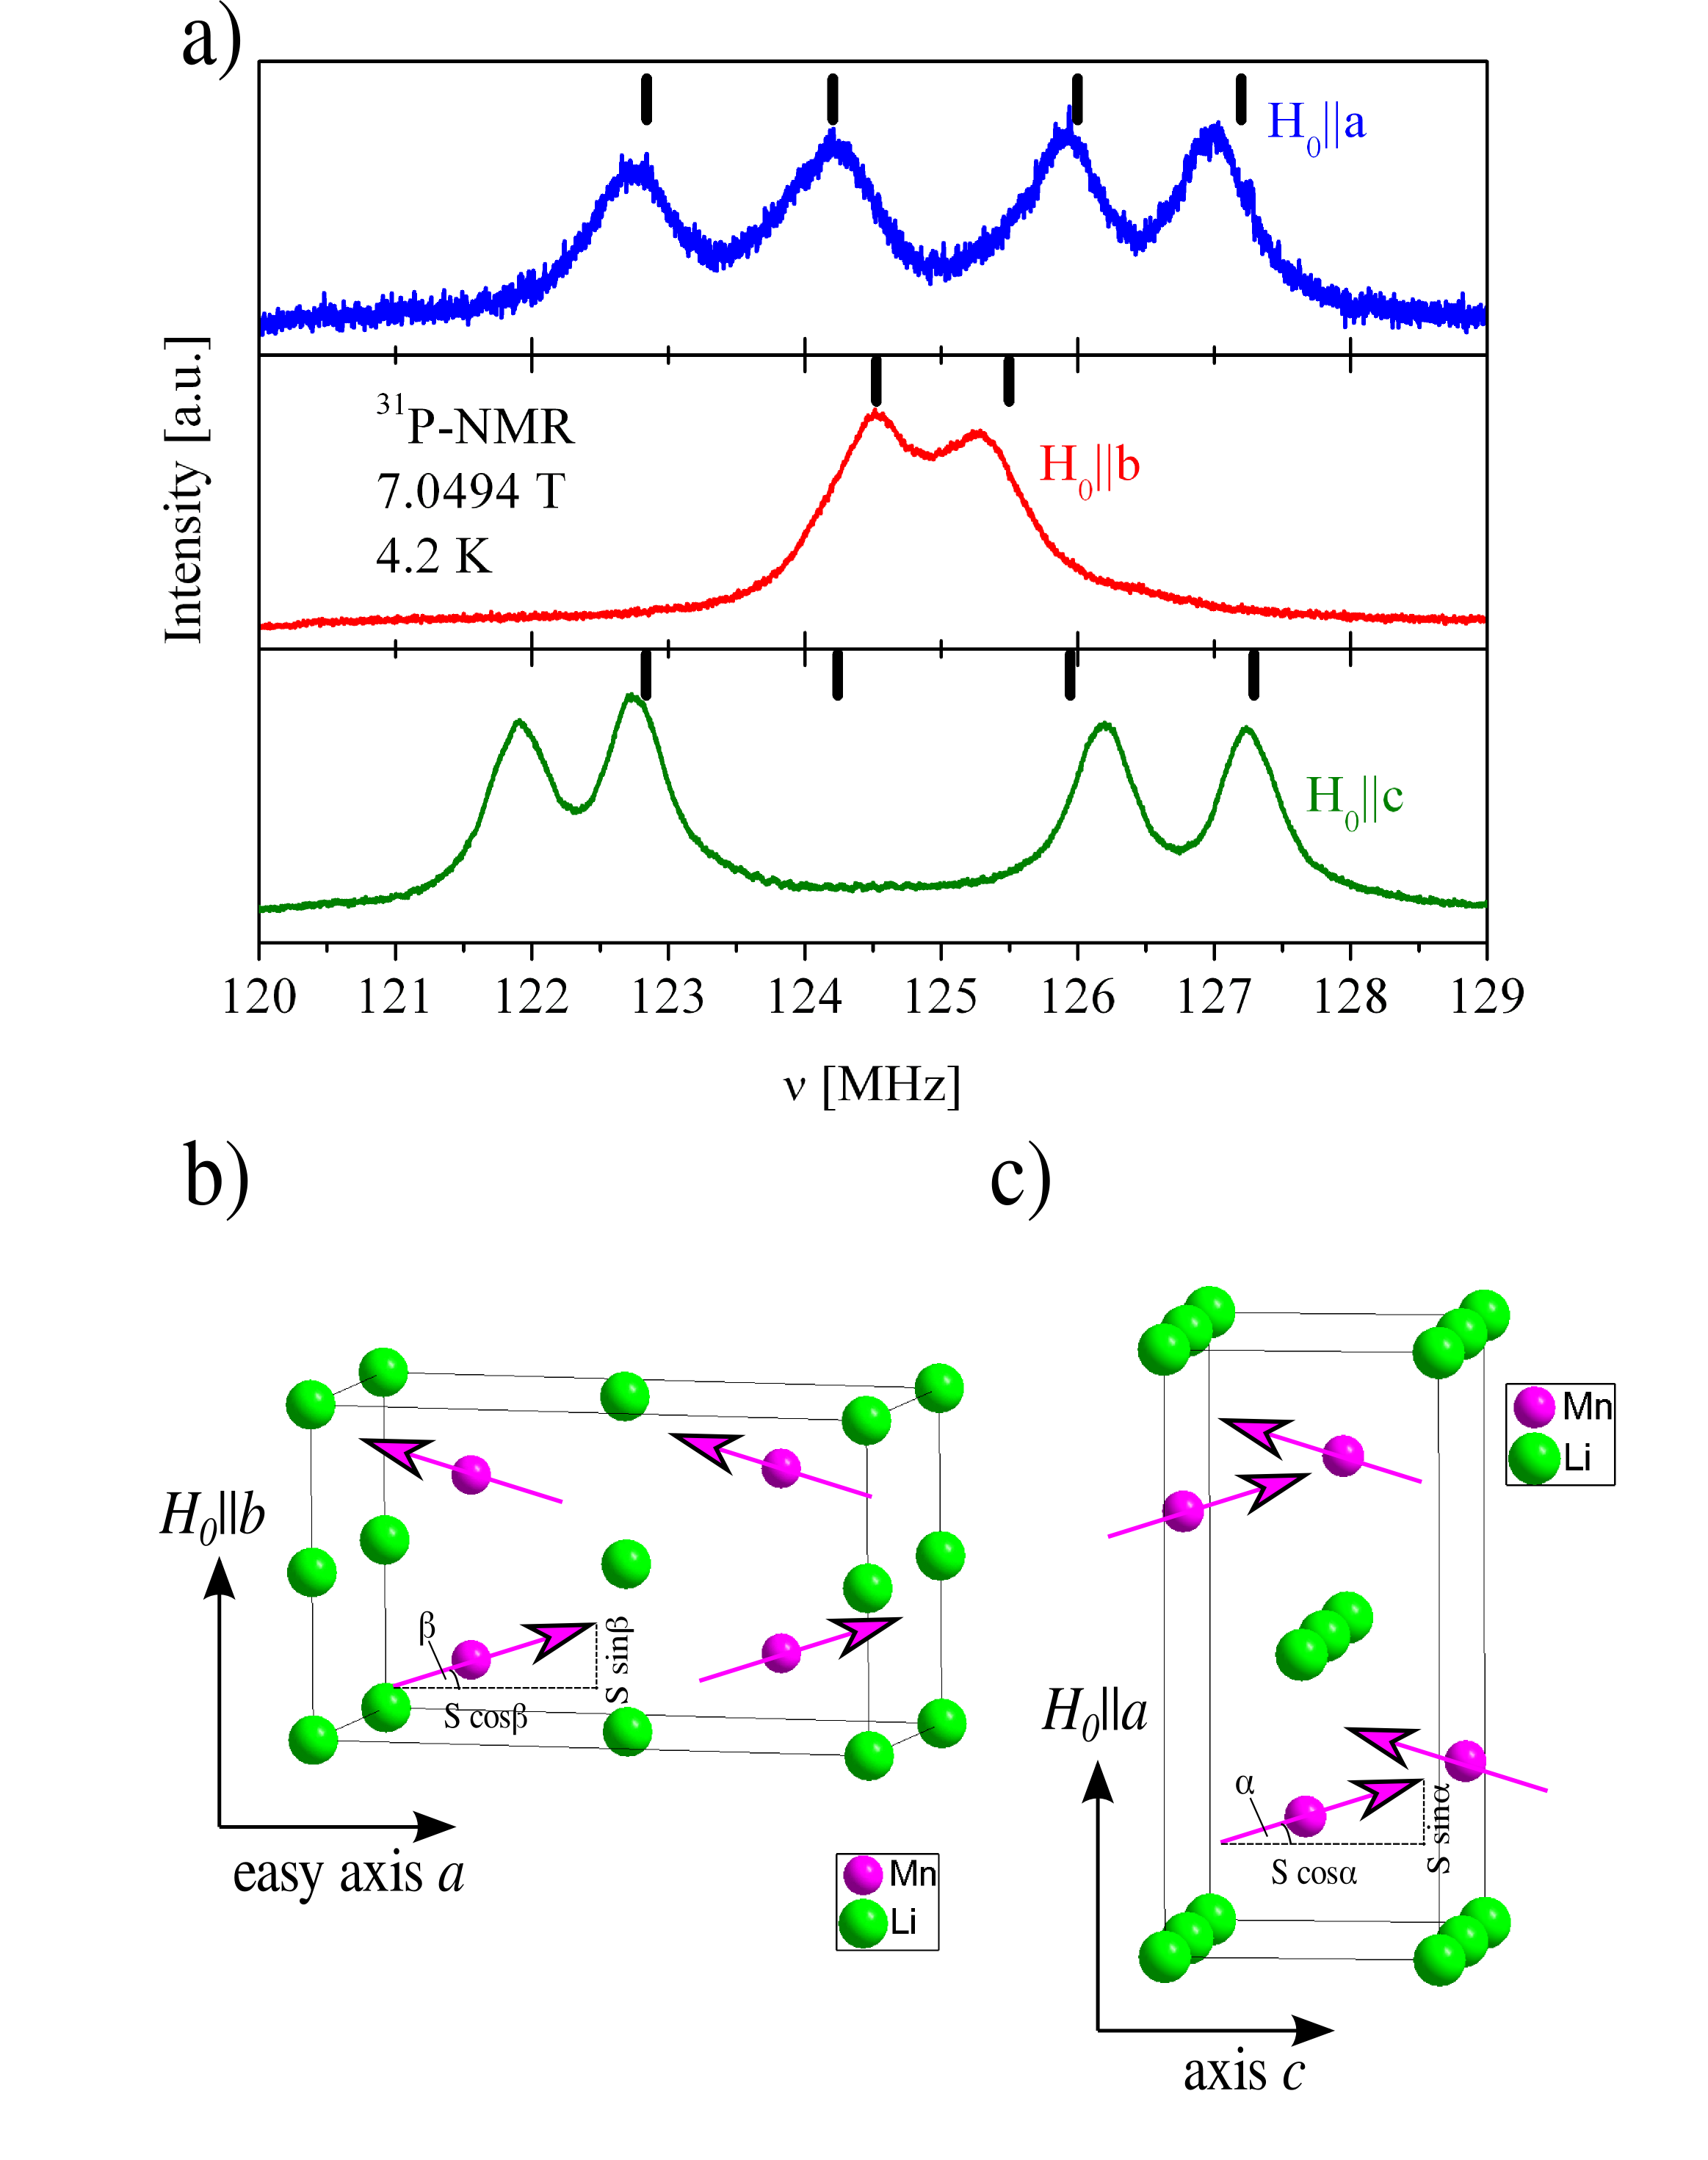
In zero external magnetic field, the electron spins align antiparallel along the crystallographic -axis. For the NMR experiments, a strong external field T has been applied which leads to a tilt of the electron spins for the directions and by the angle and , respectively, and to a spin-flop transition plus an additional tilt by the angle for the direction (see Fig. 8 (b) and (c))). The occurrence of a spin-flop transition has been reported in Toft-Petersen et al. (2012); Ranicar and Elliston (1967) for T parallel . The tilt angle in the spin flop phase is labeled .
Eqn. 4 considers the additional fields induced by the contact interaction and the dipolar field which stems from the antiferromagnetic order of the electron spins.
| (4) |
The dipolar field vanishes for the 7Li sites in the AFM phase, therefore the 7Li-NMR spectra show a single resonance line at the frequency of a bare nucleus. In Fig. 3 (a) the expected behavior is experimentally indicated by small shifts of the 7Li-NMR resonance frequencies in the direction of the unshifted frequency at 4.2 K. The incomplete shifting to can be explained by a remaining dipolar field induced by the tilted electron spins.
The resonance lines in the AFM phase of the 31P are shown in Fig. 8 (a) for the orientations , and . The number of resonance lines in the 31P-NMR spectra equals the number of different calculated dipolar fields (see Appendix Tab. 3).
The additional component in the field direction due to the tilt of the electronic spins is considered in Tab. 3 for the corresponding orientations. Then, the 31P NMR frequencies are calculated as a function of the tilt angles. The best match of experimental and calculated resonances are found for , , and . The calculated frequencies are indicated by bars in Fig.8. For and the experimental and calculated resonance frequencies agree quite well, and the value for is also consistent with the tilt angle of 5.4∘ at T determined by neutron scattering Toft-Petersen et al. (2012) since the tilt angle of the spins almost depend linearly on the field. Only for , the calculated resonances on the low frequency side for some reason do not agree well with the experimental data.
In general, our results show that it is possible to determine the magnetic structure by NMR in the AFM phase, and even to determine the small tilt of the spins due to the applied magnetic field.
IV Diffuse x-ray diffraction
The NMR lineshape and angle dependence provide strong evidence for the presence of disorder of the Mn-sublattice. In order to verify this conclusion we performed diffuse HE-XRD experiments on the same single crystals studied by NMR. The HE-XRD experiments were performed using a photon energy of 100 keV. At these energies the penetration depth of the x-rays is of the order of millimeters, which guarantees the detection of true bulk properties and enables a direct comparison to the NMR results.
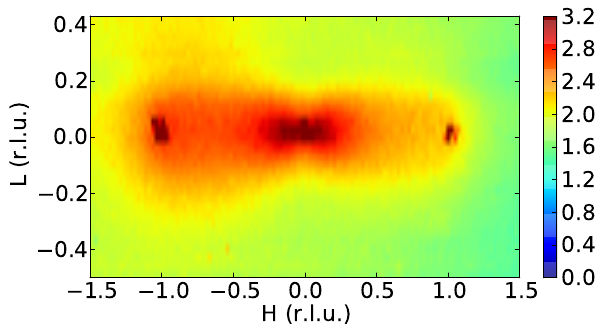
A representative data set is displayed in Fig. 9, where the diffuse scattering around the symmetry forbidden (030) is displayed. The very broad and diffuse HE-XRD intensity in the HL-plane can clearly be observed. The strong diffuse scattering reveals significant structural disorder in the studied single crystals. The HE-XRD intensity is proportional to , where is the scattering vector and represents the shift of a lattice site away from its ideal position. The diffuse scattering around =(0,3,0) therefore implies that the lattice disorder involves shifts parallel to the -axis, which are only very weakly correlated along . The distribution of the diffuse intensity is also very anisotropic within the (H3L)-plane, i.e., the underlying disorder is anisotropic in real space, consitent with the NMR results. The data in Fig. 9 further implies that the symmetry of the ideal lattice is not strictly fulfilled and therefore the symmetry forbidden (1,3,0) and (0,3,0) reflections are also observed. In addition to this the HE-XRD intensity is dominated by the shifts of the heavy elements in the lattice. The results in Fig. 9 therefore directly reveal the disorder in the Mn-sublattice and is in perfect agreement with the conclusions drawn from the NMR data.
Based on the available HE-XRD data, we cannot characterize the structural disorder in more detail. This is subject of ongoing investigations.
V Conclusions
We presented angle and temperature dependent 7Li- and 31P-NMR and diffuse x-ray diffraction measurements in a LiMnPO4 single crystal. The 7Li- and 31P-NMR resonance lines in the AFM and SF phase are consistent with the calculated resonances, when tilts of the magnetic moments in the direction of the external field are assumed. The broad 7Li- and 31P-NMR resonance lines in the paramagnetic phase indicate the existence of Mn site disorder. In combination with the susceptibility data the diagonal elements of the hyperfine coupling tensor are determined and compared with the values calculated from the crystal structure. The highest deviations show and which leads to the conclusion that the Mn disorder exists predominantly in and direction. This is fully consistent with our HE-XRD data which indicates substantial-Mn disorder along the direction. Interestingly, recent theoretical results imply a strong coupling of the Li- and the Mn-sublattice in the fully lithiated limit Asari et al. (2011). The Mn-disorder may hence be caused by the distribution of the mobile Li-ions within the MnPO4 host. Our finding of Mn disorder in LiMnPO4 therefore provides experimental evidence that the movement of Li within LiMnPO4 is significantly coupled to lattice distortions. Certainly, this will affect also the mobility of the Li in LiMnPO4, and therefore the performance of this material as a battery.
Acknowledgments
This research was financially supported by the DFG priority program SPP1473 (Grant No. GR3330/3-1 and KL1824/5). N.W. and R.K. acknowledge support by the BMBF via project 03SF0397. J.G. and S.P. gratefully acknowledge the financial support by the German Research Foundation through the Emmy-Noether program (Grant No. GE1647/2-1).
Appendix: Calculated and Experimental Hyperfine Couplings
| Nuclei | Tensor Element | Paramagnetic phase | AFM phase | ||
|---|---|---|---|---|---|
| Crystal structure | NMR | Residue | Crystal structure | ||
| (calculated) | (experimental) | (calculated) | |||
| 7Li | 0.0690 | 0.0717 | 0.0027 | 0 | |
| -0.0401 | -0.0198 | 0.0203 | 0 | ||
| -0.0289 | -0.0430 | -0.0141 | 0 | ||
| - | - | 0 | |||
| - | - | 0 | |||
| - | - | 0 | |||
| 31P | 0.0376 | 0.4429 | 0.4053 | ||
| -0.0193 | 0.3847 | 0.4040 | |||
| -0.0183 | 0.3710 | 0.3893 | |||
| 0 | - | - | 0 | ||
| +0.0388 / -0.0362 | 0.0106 / 0.0080 | ||||
| 0 | - | - | 0 | ||
| 7Li sites | 31P sites | |||||
|---|---|---|---|---|---|---|
| (0 / 0 / 0) | + | + | - | (0.907 / 0.75 / 0.591) | - | |
| (0 / 0.5 / 0) | - | + | + | (0.092 / 0.25 / 0.408) | - | |
| (0.5 / 0 / 0.5) | + | - | + | (0.407 / 0.75 /0.906) | + | |
| (0.5 / 0.5 / 0.5) | - | - | - | (0.592 / 0.25 / 0.094) | + |
| Number of | |||||
|---|---|---|---|---|---|
| different | |||||
| 4 | |||||
| 2 | |||||
| 4 |
References
- Padhi et al. (1997) A. K. Padhi, K. S. Najundaswamy, and J. B. Goodenough, J. Electrochem. Soc. 144 (1997).
- Nie et al. (2010) Z. Nie, C. Ouyang, J. Chen, Z. Zhong, Y. Du, D. Liu, S. Shi, and M. Lei, Solid State Communications 150, 40 (2010).
- Martha et al. (2009) S. K. Martha, B. Markovsky, J. Grinblat, Y. Gofer, O. Haik, E. Zinigrad, D. Aurbach, T. Drezen, D. Wang, G. Deghenghi, and I. Exnar, J. Electrochem. Soc. 156, A541 (2009).
- Li et al. (2002) G. Li, H. Azuma, and M. Tohda, Electrochemical and Solid-State Letters , A135 (2002).
- Asari et al. (2011) Y. Asari, Y. Suwa, and T. Hamada, Phys. Rev. B 84, 134113 (2011).
- Yamada and Chung (2001) A. Yamada and S. Chung, J. Electrochem. Soc. 148, A960 (2001).
- Yamada et al. (2001) A. Yamada, Y. Kudo, and K. Liu, J. Electrochem. Soc. 148, A1153 (2001).
- Wang et al. (2009) D. Wang, H. Buqa, M. Crouzet, G. Deghenghi, T. Drezen, I. Exnar, N.-H. Kwon, J. H. Miners, L. Poletto, and M. Grätzel, Journal of Power Sources 189, 624 (2009).
- Aravindan et al. (2013) V. Aravindan, J. Gnanaraj, Y.-S. Lee, and S. Madhavi, J. Mater. Chem. A 1, 3518 (2013).
- Toft-Petersen et al. (2012) R. Toft-Petersen, N. H. Andersen, H. Li, J. Li, W. Tian, S. L. Bud’ko, T. B. S. Jensen, C. Niedermayer, M. Laver, O. Zaharko, J. W. Lynn, and D. Vaknin, Phys. Rev. B 85, 224415 (2012).
- Van Aken et al. (2007) B. B. Van Aken, J.-P. Rivera, H. Schmid, and M. Fiebig, NATURE 449, 702 (2007).
- Wizent et al. (2009) N. Wizent, G. Behr, F. Lipps, I. Hellmann, R. Klingeler, V. Kataev, W. Löser, N. Sato, and B. Büchner, Journal of Crystal Growth 311, 1273 (2009).
- Wizent et al. (2011) N. Wizent, G. Behr, W. Löser, B. Büchner, and R. Klingeler, Journal of Crystal Growth 318, 995 (2011).
- Mays (1963) J. M. Mays, Physical Review 131 (1963).
- Li et al. (2009) J. Li, W. Tian, Y. Chen, J. L. Zarestky, J. W. Lynn, and D. Vaknin, Phys. Rev. B 79, 144410 (2009).
- Heitjans and Kärger (2005) P. Heitjans and J. Kärger, Diffusion in Condensed Matter - Methods, Materials, Models (Springer, 2005).
- Nakamura et al. (2006) K. Nakamura, H. Ohno, K. Okamura, Y. Michihiro, T. Moriga, I. Nakabayashi, and T. Kanashiro, Solid State Ionics 177, 821 (2006).
- Abragam (1961) A. Abragam, The Principles of Nuclear Magnetism (Clarendon Press, Oxford, 1961).
- Arcon et al. (2004) D. Arcon, A. Zorko, R. Dominko, and Z. Jaglicic, J. Phys. Condensed Matter 16, 5531 (2004).
- Ranicar and Elliston (1967) H. J. Ranicar and P. R. Elliston, Physics Letters 25A (1967).