Magnetic structure of the frustrated chain magnet LiCu2O2 doped with nonmagnetic Zn
Abstract
We present the results of magnetization, ESR and NMR measurements on single crystal samples of the frustrated chain cuprate LiCu2O2 doped with nonmagnetic Zn2+. As shown by the x-ray techniques the crystals of Li(Cu1-xZnx)2O2 with are single-phase, whereas for higher Zn concentrations the samples were polyphase. ESR spectra for all monophase samples () can be explained within the model of a planar spin structure with a uniaxial type anisotropy. The NMR spectra of the highly doped single crystal sample Li(Cu0.9Zn0.1)2O2 can be described in the frame of a planar spin-glass like magnetic structure with short-range spiral correlations in the crystal ()-planes with strongest exchange bonds. The value of magnetic moments of Cu2+ ions in this structure is close to the value obtained for undoped crystals: (0.8 0.1) .
pacs:
75.50.Ee, 76.60.-k, 75.10.Jm, 75.10.PqI Introduction
LiCu2O2 is an example of a magnet with frustrated exchange interactions. The magnetic structure of LiCu2O2 can be considered as a system of coupled chains of magnetic Cu2+ ions. Within the chains the nearest spins interact ferromagnetically and the next-nearest neighbors antiferromagnetically. Interest in magnetic systems with such a type of frustration is stimulated by theoretical predictions of unusual magnetic phases for uncoupled and weakly coupled (1D and quasi-1D) chain models (see for example Refs. Hikihara_2008, ; Sudan_2009, ). It was shown that a new type of magnetic ordering can be realized for the magnets with this particular type of frustration. Such a type of magnetic order, with zero average magnetic moment on each magnetic ion, but with long-range ordered correlations of spin components of neighboring ions, is classified as spin-nematic order.Andreev_1984 The possibility to find this new type of magnetic order experimentally is a very attractive task. According to Ref. Hikihara_2008, , for the 1D model with the intrachain exchange constants of LiCu2O2 a chiral long-range order in the low-field range and a quasi long-range ordered spin-density wave phase in higher applied magnetic fields are expected. In the experiment the planar spiral spin structure was observed at in the low-field range in LiCu2O2.Masuda_2004 ; Gippius_2004 At higher fields T another magnetic phase, which is not identified yet, was observed.Bush_2012 Probably, this phase is related to a spin-density wave phase which is predicted for the 1D model. A spin-nematic phase for the exchange integrals of LiCu2O2 is expected in even higher magnetic fields which are hardly accessible experimentally.
Introduction of non-magnetic impurities substituting for the magnetic ions provides a powerful tool to fine tune properties of the bulk magnet and to affect stability of different phases or even to stabilize new phases. The effect of non-magnetic doping was studied in the collinearly ordered magnets (e.g. Refs. Carretta_1997, ; Liu_2013, ), in the quantum magnets (e.g. Refs. tlcucl3-mg, ; dan2012, ). Recent publications (e.g. Refs. Papinutto_2005, ; Wollny_2011, ; Sen_2011, ; Sen_2012, ) have discussed the effect of non-magnetic impurities on the matrix with frustrated interactions. Quasi-one-dimensional frustrated magnets are appealing objects for the study of such doping effects: first, breaking up the spin-chain by an impurity can lead to the formation of the lengthy multi-spin defect with unusual properties.Zhitomirsky_13 Besides, in the presence of the strong next-nearest neighbor interaction unaffected by doping, substitution of the magnetic ion by non-magnetic ones results in the conservation of the magnetic correlations along the chain with the defined spin spiral phaseshift at the impurity location, while, due to the random location of the defects, weak interchain interaction becomes frustrated.
The investigation of the zinc-doped crystals of LiCu2O2 was reported recently Hsu_2010 and new magnetic phases in this system were announced. This report has stimulated the Electron Spin Resonance (ESR) and Nuclear Magnetic Resonance (NMR) investigations of the magnetic structure of Zn-doped LiCu2O2 single crystals reported here. Our x-ray, ESR and NMR research provides no support for the existence of the dimer phase at doping levels above , suggested by Hsu et al.Hsu_2010 On the contrary, we have found that at the doping up to 10% resonance response of the system remains qualitatively similar to that of the pure sample and can be understood in terms of planar noncollinear structure. The NMR study of the Li(Cu1-xZnx)2O2 single crystal with at shows coexistence of static correlations corresponding to the magnetic structure of the undoped material with a static random distribution of spin directions. The temperature evolution of NMR spectra can be described by the development of the interplane correlations with decrease of the temperature. For the temperatures the NMR spectra can be described in the model of uncorrelated spin planes.
The paper is built as follows. In the first section a short overview of the literature data about the crystal and magnetic structures of the undoped samples of LiCu2O2 is given. In the second section of the paper the details of crystal growth and sample characterization are described. In the next two sections results of ESR and NMR experiments are presented.
II Crystallographic and magnetic structures of LiCu2O2
LiCu2O2 crystallizes in an orthorhombic system (space group ) with unit cell parameters Å, Å and Å.Berg_1991 The unit cell parameter is approximately twice the unit cell parameter . Consequently, the LiCu2O2 samples, as a rule, are characterized by twinning due to the formation of crystallographic domains rotated by around their common crystallographic -axis.
The unit cell of the LiCu2O2 crystal contains four univalent nonmagnetic Cu+ cations and four divalent Cu2+ cations with spin . There are four crystallographic positions of the magnetic Cu2+ ions in the crystal unit cell of LiCu2O2, conventionally denoted as , , and .
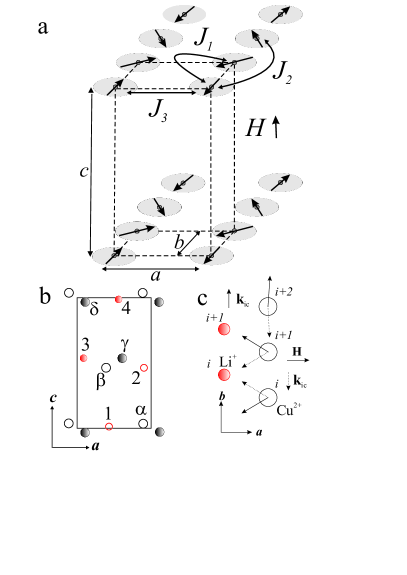
The Cu2+ ions in different positions are weakly magnetically coupled and form four almost independent systems of spin chains. Such chains formed by one of four kinds of Cu2+ ions (e.g. the -position) and relevant exchange interactionsMasuda_2005 within the system are shown schematically in Fig. 1a.
The positions of Cu2+ and Li+ ions in the crystal cell are givenBerg_1991 by copper coordinates: (0.876; 0.75; 0.095), (0.376; 0.75; 0.405), (0.624; 0.25; 0.595), (0.124; 0.25; 0.905) and by lithium coordinates: (0.376;0.75;0.068), (0.876;0.75;0.432),(0.124;0.25;0.568),(0.624;0.25;0.932). Schematic arrangement of the Cu2+ and Li+ ions in the projection of the crystal lattice onto the -plane is given in Fig. 1b.
The transition into the magnetically ordered state occurs via two stages at K and K.Seki_2008 Neutron scattering and NMR experiments have revealed that an incommensurate magnetic structure is realized in the magnetically ordered state ().Masuda_2004 ; Gippius_2004 ; Kobayashi_2009 The wave vector of the incommensurate magnetic structure coincides with the chain direction (the -axis). The magnitude of the propagation vector at 17 K is almost temperature independent and is equal to 0.8272/. The neutron scattering experiments have shown that the neighboring magnetic moments along the -direction are antiparallel, whereas those along the -direction are parallel. The investigation of the spin-wave spectra by inelastic neutron scattering Masuda_2005 shows that the incommensurate magnetic structure in LiCu2O2 is caused by a competition between the ferromagnetic exchange interaction of the nearest-neighbor magnetic ions in the chain meV and the antiferromagnetic interaction of the next-nearest neighbor ions in the chain meV. The antiparallel orientation of the magnetic moments of Cu2+ between neighboring chains is caused by the strong antiferromagnetic interaction meV. The coupling of the Cu2+ magnetic moments along the -direction and the couplings between the magnetic ions in different crystallographic positions , , or are much weaker. Masuda_2005 ; Gippius_2004 Thus, the magnetic structure of LiCu2O2 in the magnetically ordered phase can be considered as quasi-two dimensional. The quasi-two-dimensional character of the magnetic interactions in LiCu2O2 was also proven by resonant soft X-ray magnetic scattering experiments.Rusydi_2008 ; Huang_2008
The magnetic structure of LiCu2O2 at zero magnetic field was studied using different experimental methods, but so far there is no generally accepted model for it. For a review of proposed models see, for example, Ref. Bush_2012, .
In magnetic fields above 3 T, the magnetic structure realized in LiCu2O2 is much clearer. ESR and NMR studies of LiCu2O2 in the low-temperature magnetically ordered phase () established that a planar spiral magnetic structure is formed in this compound.Svistov_2009 The magnetic moments located at the (, or ) position of the crystal unit cell with coordinates , , (measured along the , and -axis of the crystal, respectively) are defined as:
| (1) |
where and are the two mutually perpendicular unit vectors, is the incommensurability vector parallel to the chain direction (-axis), is the magnetic moment of the Cu2+ ion and is a multiple of the chain period . The magetic moment per copper ion at K was evaluated as .Masuda_2004 ; Svistov_2009 The phases , , and determine the mutual orientation of the spins in the chains formed by the ions in the different crystallographic positions. Their values are extracted from the NMR dataSvistov_2009 ; Svistov_2010 : ; ; ; .
III Sample preparation and experimental details
Single crystals of Li(Cu1-xZnx)2O2 with the size of several cubic millimeters were prepared by the “solution in the melt” method.Bush_2004 Samples were grown in air by a flux method in alundum crucibles. The mixtures of analytical grade Li2CO3, CuO and ZnO of Li2CO4(1-x)CuO4xZnO compositions were melted at 1100 ∘C, and then solidified by cooling to 930 ∘C at a rate of 5.0 ∘C/hour. Next, the crucible was withdrawn from the furnace and placed on a massive copper plate to ensure rapid cooling to room temperature. Quenching from 900 ∘C was necessary, because the single phase LiCu2O2 single crystals decompose below this temperature.Bush_2004
The samples were shaped as a flat plates with the developed ()-plane. The twinning structure of the samples was studied with optical polarization microscopy.Bush_2012 In most cases, the samples were twinned with a characteristic domain size of several microns. It was possible to select samples without twinning structure for Zn concentrations up to . The absence of the twinning structure in the samples selected for the experiments was confirmed by X-ray diffraction and ESR measurements.Svistov_2009 ; Bush_2012 We have used samples without twinning for most of the experiments described below.
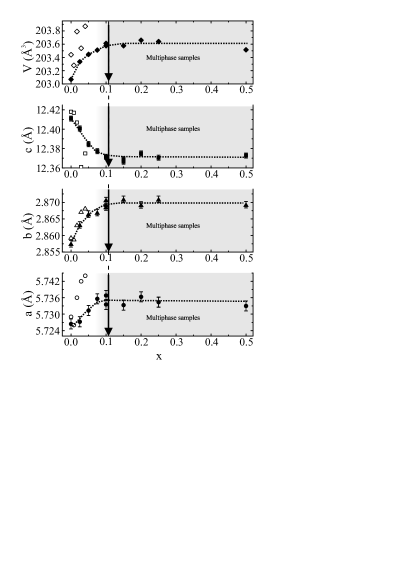
The X-ray diffraction patterns were taken in a geometry using CuK irradiation. The samples produced clearly distinguishable diffraction patterns from the - and the -planes of the crystal. The spectra obtained from twinned samples had a form of a superposition of these spectra. The Zn doping of LiCu2O2 results in a monotonic change of the cell parameters up to a concentration limit of . For samples with zinc content of initial charge no diffraction patterns due to impurity phases were observed. Additional x-ray diffraction patterns were observed for the samples with , which can be ascribed to the presence of inclusions of impurity phases. The patterns ascribed to the main phase show that the cell parameters for higher Zn content do not change. The zinc concentrations of Li(Cu1-xZnx)2O2 single crystals were measured by electron probe micro analysis on the spectrometer “Eagle II” (“EDAX”, USA). The concentration values of in our single-crystalline samples obtained with this method coincide with the values of the zinc concentration in the initial charge with precision better than for all samples with .
The dependence of the crystal cell parameters ,, of the single crystals of Li(Cu1-xZnx)2O2 on zinc concentration in initial charge is shown in Fig. 2. The solid symbols show the results obtained from the samples described above. In contrast with the data of Ref. Hsu_2010, (open symbols), we did not observe any anomaly in the concentration dependence of the cell constants at .
Magnetization curves in static magnetic fields of up to 7 T were measured with a commercial SQUID magnetometer (Quantum Design MPMS-XL7).
The ESR experiments were performed with a transmission–type spectrometer using resonators in the frequency range GHz. The magnetic field of a superconducting solenoid was varied in the range of T. Temperatures were varied within the range of K.
The NMR experiments were performed with a conventional phase coherent, homemade pulse spectrometer at a fixed frequency of MHz. We investigated the 7Li (, MHz/T) nuclei using spin–echo technique with a pulse sequence 5s––10s, where the time between pulses, , was 40 s. The spectra were collected by sweeping the applied magnetic field between T. The temperatures were stabilized with a precision better than 0.02 K.
IV Experimental results
IV.1 Magnetization measurements
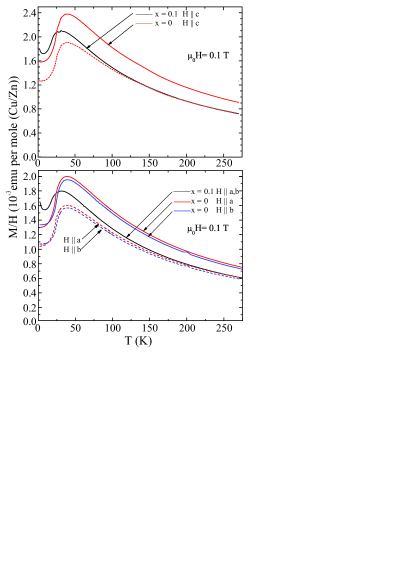
The experimental curves and their temperature derivatives for different field directions and at T are shown in Figs. 3 and 4. The dependences were obtained on the single crystal without doping () and on the twinned single crystal with . For all field directions broad maxima of were observed at K for samples without doping and at K for doped samples with . The maximum is typical for low-dimensional antiferromagnets. In the paramagnetic region, the magnetic susceptibility for exceeds that for , which is consistent with the anisotropy of the -tensor measured in the ESR experiments Vorotynov_1998 (; ). At high temperatures K the susceptibility of the doped sample is less then that of the pure sample. This reduction is close to the factor expected if all Zn2+ ions take the places of the Cu2+ ions, which would result in the corresponding decrease of the number of paramagnetic spins. To emphasize this fact the dependence for the sample without doping reduced by factor 0.8 is shown in the same figure with dashed lines. This experiment allows to conclude that the number of magnetic Cu2+ ions in the doped samples of Li(Cu1-xZnx)2O2 is reduced by the number of nonmagnetic Zn2+ ions.
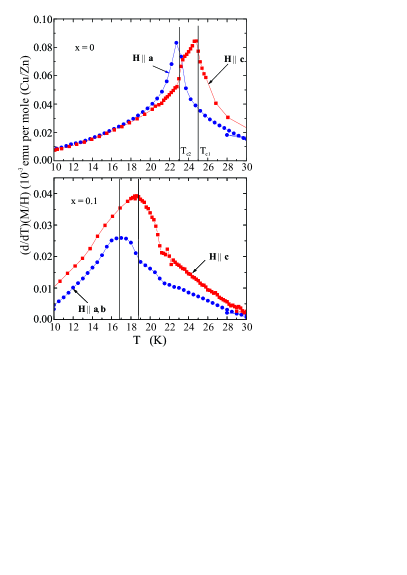
The transitions to the magnetically ordered states at and are marked by the change of the slope. These inflection points are well resolved in the temperature derivative of for the undoped sample (Fig. 4). The curves are strongly anisotropicBush_2012 : for and , there are two anomalies corresponding to two transitions at and . The temperature dependence of for shows only one sharp peak at the lower temperature near in the studied field range. For the doped sample the inflection points on the curves were smoothed, but the maximum of the slope for was observed at evidently higher temperature than for . The distance between the maxima for doped samples with are almost the same as for the samples without doping (Fig. 4). Thus the double-step transition in the magnetically ordered phase also takes place for doped samples. Note here that the double-stage transition is specific for a planar spin structure with a strong easy-plane anisotropy for the vector normal to the spin plane. The anomaly of at a field of T for which was associated with the reorientation of the spin plane observed earlier for samples without doping Bush_2012 was not observed for all studied samples with .
IV.2 Electron Spin Resonance experiments
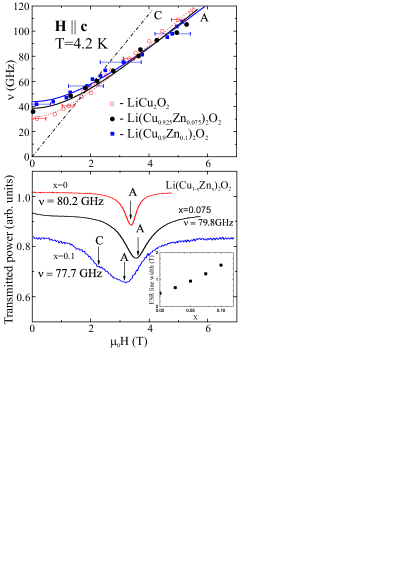
The ESR in single crystals of Li(Cu1-xZnx)2O2 was studied on the samples with . The samples with and were untwinned. ESR on the sample without doping was studied in a previous work.Svistov_2009 The typical ESR absorption lines are shown in the lower panels of Figs. 5 and 6. We present the lines for the samples with the Zn concentration , and the undoped untwinned sample from Ref. Svistov_2009, . The ESR absorption lines are systematically broader for the samples with larger Zn concentration. The insert in the lower panel of Fig. 5 shows the concentration dependence of the absorption line width for at K. The ESR frequency-field dependences for field directions , for the samples with , and are shown in the upper panels of Figs. 5 and 6. Note, that for the presence of the twinning is not essential. The sample with were twinned, but due to strong anisotropy (see below) it was easy to separate the absorption lines only from the domain with . The dash-dotted lines in the upper panels of Figs. 5 and 6 mark dependences of electron paramagnetic resonance for LiCu2O2: (; ).Vorotynov_1998 Resonance fields of the relatively weak component “C” are well described by such a paramagnetic dependence. Probably, this component is due to paramagnetic inclusions.
The experimental data which correspond to the absorption component “C” are not shown in the upper panels of Figs. 5 and 6. The ESR frequency-field dependences () of the intermediate Zn concentrations , (not shown) and interpolate between those of the samples with extreme doping concentration and . The error bars in the upper panels of Figs. 5 and 6 show the antiferromagnetic resonance line widths measured at the half of the absorbed intensities.
The main features of the ESR frequency-field dependences () for different Zn concentrations remain the same as for the undoped sample. The frequency-field dependences () consist of a single branch for and two branches for . In the case of pure compound mode “A” was ascribed to the oscillations of the spin plane around -axis.Svistov_2009 The sudden change of this mode resonance frequency at at is associated with spin-flop transition.
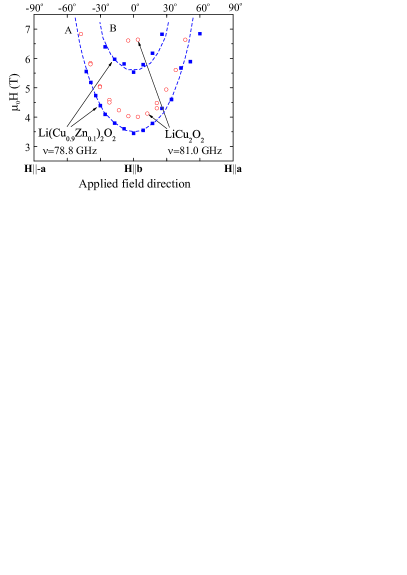
The zero-field gap grows on doping from GHz for the undoped sample () to GHz for doped samples with . Angular dependences of the resonance fields on rotation in the -plane for samples with are shown in Fig. 7. Both resonance fields shift to higher fields as approaches . Such a behavior was observed also for a rotation of the applied magnetic field in the -plane. Thus, rotation of the static field towards the -direction flattens the dependence, which finally becomes field independent for (as was reported for the pure compound in Ref. Svistov_2009, ). From these data we conclude that the strong uniaxial anisotropy along the -direction remains for all studied doped samples. Such an anisotropy corresponds to the easy -plane anisotropy for the vector normal to the spin plane.
The branches marked as ”A” for are quasi linear with field: . The coefficient is noticeably smaller than the gyromagnetic ratio . Such a field dependence is typical for a planar spin structure with strong “easy-plane” anisotropy for vector perpendicular to the spin plane and field direction perpendicular to the anisotropy axis (). (See attachment) The coefficient is defined by the anisotropy of the susceptibility of the spin structure: (here and are the susceptibilities for field directions parallel and perpendicular to the vector of the spiral spin structure). Using the value of as a fit parameter we obtained that the anisotropy of the susceptibility slightly decreases from to with the increase of doping from to .
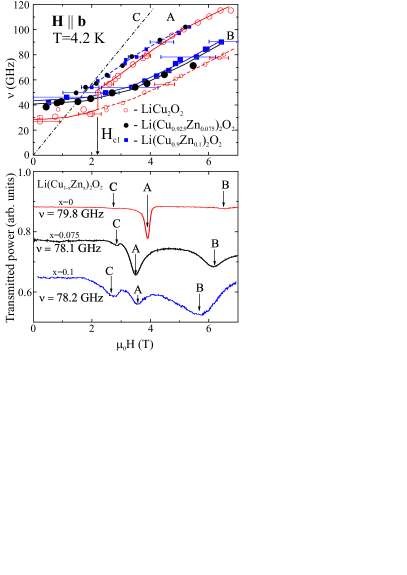
For the field orientation the magnetic structure of the undoped LiCu2O2 samples undergoes a reorientation at a field of T. Earlier experiments have shown that at this field the spin plane of the spiral structure rotates from the to the -plane.Svistov_2009 ; Bush_2012 The magnetic susceptibility at this field undergoes a step like increase. The ESR frequency-field dependence for this orientation is shown in the upper panel of Fig. 6. The transition field is marked by the jump of the frequency-field dependence for the undoped sample. The intensive component of the ESR absorption line changes form the “B”-branch of the frequency-field diagram to the “A”-branch at the transition field for the undoped sample. Thus, the “A”-component dominates the absorption spectrum of the undoped sample at high fields (Fig. 6). For the doped sample with the absorption component “B” was more than 10 times more intensive than the component “A” in the whole field range. No jumps of the position of the intense component in the frequency-field diagram was observed for the doped samples.
From these observations we conclude that for doped samples no magnetic reorientation takes place in the studied field range. This conclusion is in agreement with the absence of anomalies in the curves mentioned in the previous subsection. Note that the value of and the sharpness of the transition are strongly dependent on the quality of the samples even for the crystals without doping.Svistov_2009 ; Bush_2012
IV.3 Nuclear Magnetic Resonance experiments
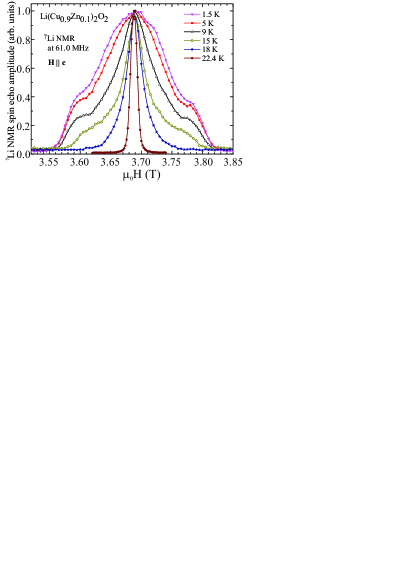
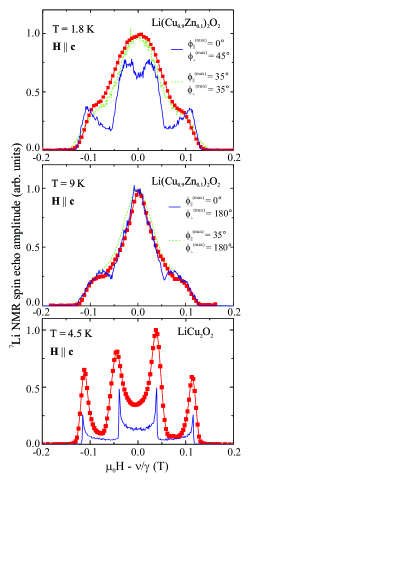
The magnetic structure of the single crystals of Li(Cu1-xZnx)2O2 with was tested with the NMR technique. 7Li NMR field-sweep spectra measured at different temperatures at field orientation and fixed frequency MHz are shown in Fig. 8. The shape of the NMR spectra transforms from a single component spectrum at high temperatures to a spectrum with characteristic shoulders at temperatures below K (see Fig. 8). Similar NMR spectra evolution was reported in Ref. Hsu_2010-1, for the sample with Zn content .
The spin echo NMR signal in the low temperature range was observed in a broad field range T which is approximately the same as for LiCu2O2 without doping (see Fig. 9). At temperatures close to the central line of the NMR spectra dominates. This fact demonstrates, that close to Neel temperature the number of nuclei with paramagnetic environment increases.
In Fig. 9 the lines show the fitting results of the NMR spectra. The 7Li NMR spectra for doped and undoped samples were fitted by taking into account dipolar fields within the model of a planar spiral magnetic structure in the -plane with an incommensurate wave vector aligned along the -direction and an effective magnetic moment on the Cu2+ position equal to . Note, that the contribution of the contact field for such spin arrangement at can be neglected since the spin plane is perpendicular to the magnetic field.chemshift The magnetic structure for the sample without doping is described by Eqn.(1). The mutual orientation of the spins from neighboring -planes defined by phases are given in the end of the section II. The line width of individual groups of resonating lithium nuclei for this computation was taken as T, which is much smaller than all peculiarities on the experimental spectra. This value of roughly corresponds to the value of quadrupolar splitting of NMR line on 7Li nuclei in LiCu2O2 ( kHz, Ref. Gippius_2004, ).
To explain the main features of our experimentally observed NMR spectra we consider effective fields at lithium sites which are generated by an individual magnetic chain of Cu2+ ions nearest to the lithium nuclei (see the fragment of the spiral structure shown in Fig. 1c). For simplicity we suppose that the Li+ ion, the Cu2+ chain, the spin vectors, and the applied static field lies in the plane of the figure. The projection of the effective field from neighboring spins on the applied field changes along the spin chain sinusoidally. For a given propagation vector the NMR spectra exhibit a shape with two characteristic maxima at the extremum fields . Since the Li+ ions are located symmetrically between two Cu2+ ions, the extreme fields will correspond to the arrangement of the spins in the copper chain symmetric with respect to the chosen Li+ ion (marked with index in Fig. 1c). As it is schematically shown in Fig. 1c, such a symmetric arrangement corresponding to the magnetic structures, with opposite wave vectors (solid arrows) and (dotted arrows), yields different dipolar contributions to effective field. Thus for such simple model structure we can expect a broad NMR spectrum with four characteristic maxima corresponding to two magnetic domains with opposite wave vectors.
The magnetic structure expected for LiCu2O2 at an arbitrary orientation of the applied magnetic field provides NMR spectra with 8 maxima corresponding to the four extremal fields at the lithium nuclei from different positions Li1, Li2, Li3, and Li4 (Fig. 1b). For the field orientation the number of maxima of the spectra is reduced to four (see bottom panel of Fig. 9).
In order to interpret the NMR spectra of doped samples we simulated the NMR spectra for the structures with random static deviations of the spin directions from the spin orientations of undoped model. For modeling purposes the deviation angles within the spin plane were set to the random value , where the maximal deviation was used as a model fitting parameter. Taking into account that the exchange interactions between planes is weaker than the in-plane interactions, we used different deviation parameters for spins within -plane, and for spins from different planes. The NMR spectra of doped samples at 9 K can be fitted in the model of totally random mutual orientation of the spins of the neighbor planes, i.e. (see middle panel of Fig. 9). The NMR spectra obtained in this model are only weakly sensitive to the disorder within the individual spin plane. The solid blue line shows the computed NMR spectra with the assumption of ordered moments within each -plane (). The dashed green line shows NMR spectra obtained under the assumption that the spin directions of ions within the -planes are oriented randomly around undisturbed directions within the angle . For the fit we took as the absolute value of the magnetic Cu2+ moments at this particular temperature of K. As temperature decreases the central maximum of the spectra starts to broaden (see Fig. 8). Such transformation can be explained by the development of spin correlations between ions of neighboring -planes on cooling. The NMR spectrum measured at K (squares) and the fitting results (lines) are given in the top panel of Fig. 9. Again, the solid blue line shows the computed NMR spectrum with the assumption of ordered moments within each (ab)-plane () and random deviations of nearest spins from neighboring planes within the angle . A better agreement between our model and the low-temperature experimental NMR spectrum is obtained for the case of a magnetic structure with short ranged static correlations for both in-plane and inter-plane correlations according to the green dashed line. It shows the computed NMR spectrum with the assumption of random deviations of spins described by the parameters . Again, the absolute value of the magnetic moments of Cu2+ was taken to be for the fit.
Finally, we must note that the local field at the probing nuclei is defined mostly by four nearest coordination spheres, which means that the NMR spectra are testing the short-range static correlations only. These correlations must be static at least during the time window of s set by our NMR experiment. Thus, the simulation does not actually rely on the assumption of the long-range order and the same results can be obtained if we assume presence of only short-range order superimposed by the static random variations.
V Discussion
X-ray diffraction and electron probe micro analysis of the single-phase crystals of Li(Cu1-xZnx)2O2 show that Zn ions enter into the lattice without destruction of the crystal structure in the broad concentration range . The scaling of the high-temperature susceptibility as , shown in the Fig. 2, indicates that Zn ions substitute for Cu2+ and each Zn2+ ion reduces the number of magnetic ions by one. Nonmagnetic dilution should also affect the effective interspin interactions (i.e. Curie-Weiss temperature ). The fit of our susceptibility data in the temperature range shows that the Curie-Weiss temperature decreases from for the pure compound to for the doped compound. The Curie-Weiss temperature of the doped system is also about of that for the pure compound, which is again close to the factor describing the decrease of the average number of neighbors of the magnetic ion with doping. On the other hand, even for the doping the curves demonstrate the same characteristic broad maximum around as for the pure compound. Thus, magnetization measurements prove that the magnetic subsystem of Li(Cu1-xZnx)2O2 can still be considered as a system of spins with frustrated exchange interactions, where the spins are arranged in chains along the crystallographic b-axis.
According to Ref. Masuda_2005, the strongest exchange interactions for undoped Li(Cu1-xZnx)2O2 are the interactions between copper ions within the ()-planes: intrachain interactions of nearest spins , intrachain interactions of next-nearest spins and interchain interaction (see Fig. 1). These interactions lead to a spiral long-range magnetic order with an incommensurate wave vector directed along the crystallographic -axis. The solitary nonmagnetic Zn2+ defects disturb this spiral magnetic structure in their immediate surroundings only. Since a nonmagnetic defect breaks up nearest-neighbor exchange bonds along the chain, but leaves next-nearest exchange bond almost unperturbed, the effect of the solitary defect on the spiral structure can be envisioned as a spiral phaseshift at the defect location. Interchain couplings fix relative phases of the neighboring spirals far away from the solitary defect which results in the formation of the disturbed area of the finite size. For small concentrations the characteristic size of the disturbed area around nonmagnetic defects can be evaluated as cell units, which yields a value of 4 cell units in the case of LiCu2O2. For the average distance between the defects within the chains amounts to lattice constants and, therefore, the disturbed areas strongly overlap.
As the defect positions in the neighboring chains are uncorrelated, the interchain coupling became frustrated since all interchain bonds obviously can not be satisfied simultaneously because of the spiral phaseshift at the defect location. The doped frustrated quasi-one dimensional system differs significantly from the non-frustrated doped system: in the case of the non-frustrated system fragments of the spin chain on the both sides of the defect are decoupled and weak interchain interactions can be completely satisfied by properly setting orientation of the each fragment. Thus, at the strong doping level long-range order in the frustrated quasi-one dimensional system is most likely destroyed, while the short-range chiral correlations should persist. We suggest that such a disordered state of the frustrated spin chain can be a realization of a novel spin-glass like state with short-range static chiral correlations in the -planes. The possibility of such state in Zn doped LiCu2O2 was suggested earlier by Hsu at al. Hsu_2010-1
The ESR experiments show that the main features of the low-frequency spectrum of excitations in Li(Cu1-xZnx)2O2 do not change at a doping of . The spectra can be explained in the frame of a planar spin structure with strong easy-axis anisotropy along the a-axis of the crystal. This means that the spins of this spin-glass like structure lie in the plane defined by the applied magnetic field and the axial-anisotropy vector along the a-axis for all concentrations within the entire range . The absorption line width of Li(Cu1-xZnx)2O2 strongly increases with the Zn concentration (insert in Fig. 5) and the absorption lines of the highly doped samples are asymmetric: the low-field part of the absorption lines is more broadened than the high-field part. Probably, this asymmetry is due to a nonuniformity of the magnetic structure of the doped Li(Cu1-xZnx)2O2. The defects in the magnetic structure might trigger excitations of magnons with nonzero wave vectors (see for example Ref. Krug_2010, ). The resonance condition for such excitations is expected for applied magnetic fields lower than the antiferromagnetic resonance field.
The NMR experiments indicate that the value of the magnetic moments at the position of Cu2+ ions at low temperature in doped samples is nearly the same as in the samples without doping at temperatures less then 15 K. Additionally, the shape of the NMR spectra of zinc doped samples indicates short-range static correlations the same as in undoped samples. These correlations appear at the temperature K, where the anomaly on magnetization curve was observed and the ESR spectra start to be gaped. The temperature evolution of the shape of NMR spectra of doped samples can be explained by appearance of short-range correlations between spins of neighbor -planes with decrease of the temperature from 9 to 1.8 K. The interpretation of the experimental spectra and our fitting results is natural and one of the simplest. But we can not exclude other models, which can describe the NMR spectra in another way. The results of NMR experiments on strongly doped Li(Cu1-xZnx)2O2, for are in agreement with the spin-glass like magnetic structure suggested above.
VI Conclusions
Untwinned single-crystalline samples of Li(Cu1-xZnx)2O2 were grown for . It is shown that the zinc doping diminishes the number of magnetic copper ions Cu2+ and a single crystallographic phase is maintained for all samples within the entire doping range . The ESR spectra for all doping concentrations within can be well explained in the model of a planar spin structure with strong easy-plane type anisotropy for the vector normal to the spin plane. The NMR spectra of the highly doped single crystal Li(Cu0.9Zn0.1)2O2 can be well described by planar spin-glass like magnetic structure with static short-range spiral correlations. The value of magnetic moments of Cu2+ ions in this structure is close to the value obtained for undoped crystals: (0.8 0.1) .
VII Attachment
According to the theory of exchange symmetry Andreev_1980 the order parameter in a coplanar exchange structure is represented by two mutually perpendicular unit spin vectors and which transform according to a particular irreducible representation of the crystal symmetry group. In a helical magnetic structure, the order parameter with respect to the subgroup of translations transforms according to the representation with an incommensurate wave vector. Lagrange function for this system can be written as
where , and - small addition to the exchange part of the energy due to relativistic effects. and the susceptibility tensor components are related by the expressions: . In the spiral magnetic structure, depends only on the orientation of the vector with respect to the crystal axes. In the simplest case, when the direction of all the spirals coincide, senior terms in the expansion of the quantity in the components of the vector for a biaxial crystal can be written as . For a magnetic field directed along one of the symmetry axes, vector also directed along one of the twofold axes. The coordinate axes are chosen so that, in a zero magnetic field, the vector is parallel to the -axis. Then, the coefficients and satisfy the inequalities , . In the absence of the magnetic field, oscillation frequencies are
The third oscillation frequency is equal to zero also for . In the magnetic field directed along the -axis, the resonance frequencies are determined by the formula
| (2) |
For
For
The reorientation transitions occurs in the following fields:
If and
And if and directed along or
respectively. In the first case, the oscillation frequencies in fields above the field of the spin-flop are given by
depending on whether the constant B is positive at or negative in . In the second case, the frequencies are determined by expression (1), into which is necessary to substitute
for and
for
In a more complex case, where not all the spirals twisted to one side, in the expansion of can also add member . In this case, as well as the fields are not directed along the axes of symmetry of the crystal, expressions for the frequencies are too bulky and the orientation of the order parameter and the frequency of small oscillations are found by numerical calculations of the equilibrium orientation of the order parameter, relative to the crystal axes and the frequencies of small oscillations.
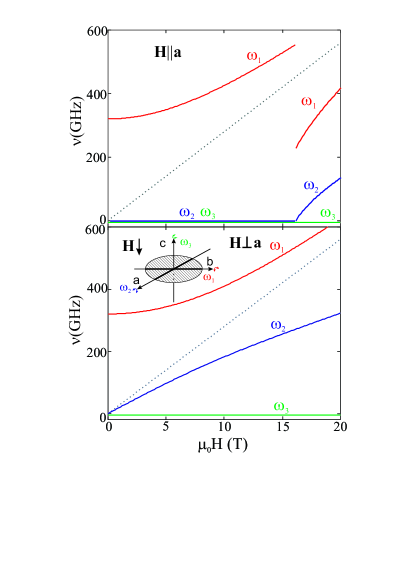
Fig. 10 shows the calculated spectra for LiCu2O2 in the model of planar spiral antiferromagnet with uniaxial anisotropy: and parameters: GHz, GHz and .
Acknowledgements.
We are thankful for the useful and enlightening discussions to S. S. Sosin. This work is supported by the Grants 12-02-00557-a, 10-02-01105-a, 11-02-92707-IND-a of the Russian Foundation for Basic Research, Program of Russian Scientific Schools, and by the German Research Society (DFG) within the Transregional Collaborative Research Center (TRR 80).References
- (1) T. Hikihara, L. Kecke, T. Momoi and A. Furusaki, Phys. Rev. B 78, 144404 (2008).
- (2) J. Sudan, A. Lüscher, and A. M. Läuchli, Phys. Rev. B 80, 140402(R) (2009).
- (3) A. F. Andreev, I. A. Grishchuk, Sov. Phys. JETP 60, 267 (1984).
- (4) T. Masuda, A. Zheludev, A. Bush, M. Markina, and A. Vasiliev, Phys. Rev. Lett. 92, 177201 (2004).
- (5) A. A. Gippius, E. N. Morozova, A. S. Moskvin, A. V. Zalessky, A. A. Bush, M. Baenitz, H. Rosner, and S.-L. Drechsler, Phys. Rev. B 70, 020406 (2004)
- (6) A. A. Bush, V. N. Glazkov, M. Hagiwara, T. Kashiwagi, S. Kimura, K. Omura, L. A. Prozorova, L. E. Svistov, A. M. Vasiliev, A. Zheludev, Phys. Rev. B 85, 054421 (2012)
- (7) P. Carretta, A. Rigamonti, and R. Sala, Phys. Rev. B 55, 3734 (1997)
- (8) Shiu Liu, A.L.Chernyshev Phys. Rev. B 87, 064415 (2013)
- (9) Akira Oosawa, Toshio Ono, and Hidekazu Tanaka, Phys. Rev. B 66, 020405(R) (2002)
- (10) D. Hüvonen, S. Zhao, M. Mansson, T. Yankova, E. Ressouche, C. Niedermayer, M. Laver, S. N. Gvasaliya, and A. Zheludev, Phys. Rev. B 85, 100410 (2012)
- (11) N. Papinutto, P. Carretta, S. Gonthier, and P. Millet, Phys. Rev. B 71, 174425 (2005).
- (12) Alexander Wollny, Lars Fritz, and Matthias Vojta, Phys. Rev. Lett, 107 137204 (2011).
- (13) Arnab Sen, Kedar Damle, and R Moessner, Phys. Rev. Lett. 106, 127203 (2011).
- (14) Arnab Sen, Kedar Damle, and R Moessner, Phys. Rev. B 86, 205134 (2012).
- (15) M.Zhitomirsky, private communications
- (16) H. C. Hsu, J.-Y. Lin, W. L. Lee, M.-W. Chu, T. Imai, Y. J. Kao, C. D. Hu, H. L. Liu, and F. C. Chou, Phys. Rev. B 82, 094450 (2010).
- (17) R. Berger, A. Meetsma, S. v. Smaalen, J. Less-Common Met. , 119 (1991)
- (18) T. Masuda, A. Zheludev, B. Roessli, A. Bush, M. Markina, and A. Vasiliev, Phys. Rev. 72, 014405 (2005).
- (19) S. Seki, Y. Yamasaki, M. Soda, M. Matsuura, K. Hirota, and Y. Tokura, Phys. Rev. Lett. 100, 127201 (2008).
- (20) Y. Kobayashi, K. Sato, Y. Yasui, T. Moyoshi, M. Sato, and K. Kakurai, J. Phys. Soc. Jpn. 78, 084721 (2009).
- (21) A. Rusydi, I. Mahns, S. Müller, M. Rübhausen, S. Park, Y. J. Choi, C. L. Zhang, S.-W. Cheong, S. Smadici, P. Abbamonte, M. v. Zimmermann, and G. A. Sawatzky, Appl. Phys. Lett. 92, 262506 (2008).
- (22) S. W. Huanga, D. J. Huanga, J. Okamoto, W. B. Wu, C. T. Chen, K. W. Yeh, C. L. Chen, M. K. Wu, H. C. Hsu, F. C. Chou, Sol. State Com. 147, 234 (2008).
- (23) L. E. Svistov, L. A. Prozorova, A. M. Farutin, A. A. Gippius, K. S. Okhotnikov, A. A. Bush, K. E. Kamentsev, and É. A. Tishchenko, JETP 135, 1151 (2009).
- (24) L. E. Svistov, L. A. Prozorova, A. A. Bush, K. E. Kamentsev, J. Phys.: Conf. Series 200, 022062 (2010)
- (25) A. A. Bush, K. E. Kamentsev, E. A. Tishchenko, Inorganic Materials 40, 44 (2004).
- (26) A. M. Vorotynov, A. I. Pankrats, G. A. Petrakovski., K. A. Sablina, V. Pashkovich, and G. Shimchak, JETP 86, 1020 (1998).
- (27) H. C. Hsu, W. L. Lee, J.-Y. Lin, H. L. Liu, and F. C. Chou Phys. Rev. B 81, 212407 (2010)
- (28) The value of the chemical shift, as determined in our experiments at the paramagnetic phase (T=29K), is equal to T/ at .
- (29) H. - A. Krug von Nidda, L. E. Svistov, L. A. Prozorova, Fizika Nizkih Temperatur, 36, 926 (2010)
- (30) A. F. Andreev and V. I. Marchenko Usp. Fiz. Nauk 130, 39, (1980).