Measuring and Modeling Behavioral Decision Dynamics in Collective Evacuation
Abstract
Approved for public release; distribution is unlimited.
Identifying and quantifying factors influencing human decision making remains an outstanding challenge, impacting the performance and predictability of social and technological systems. In many cases, system failures are traced to human factors including congestion, overload, miscommunication, and delays. Here we report results of a behavioral network science experiment, targeting decision making in a natural disaster. In each scenario, individuals are faced with a forced “go” versus “no go” evacuation decision, based on information available on competing broadcast and peer-to-peer sources. In this controlled setting, all actions and observations are recorded prior to the decision, enabling development of a quantitative decision making model that accounts for the disaster likelihood, severity, and temporal urgency, as well as competition between networked individuals for limited emergency resources. Individual differences in behavior within this social setting are correlated with individual differences in inherent risk attitudes, as measured by standard psychological assessments. Identification of robust methods for quantifying human decisions in the face of risk has implications for policy in disasters and other threat scenarios.
Introduction
The development of new communication technologies enables rapid information dissemination and decision making among groups of individuals, but it also creates new challenges in the coordination of collective behavior. For example, the adoption of social networking technologies such as Twitter and Facebook can empower the masses but makes them hard to control Oliver et al. (1985); Gonz lez-Bail n et al. (2011); Howard et al. (2011); Chen (2011); Khondker (2011); Lotan et al. (2011); Farrell (2012); Barnsby (2012). More generally, the advent of contemporary network technologies has brought with it a new set of fragilities stemming from the complexity of human behavior: people rarely behave optimally, randomly, or uniformly, as often naively assumed in technological design and policy development.
Within the field of network science, the study of social networks plays an increasingly important role in method development and associated applications, with widespread implications in marketing, politics, education, epidemics, and disasters. Considerable effort is directed towards understanding how information diffuses through social groups Zhao et al. (2010); Gómez et al. (2013); Myers et al. (2012); Guille et al. (2013); Shafiq and Liu (2013); Baños et al. (2013), with particular emphasis on the role of news websites Leskovec et al. (2009), blogs Leskovec et al. (2007), Facebook Onnela and Reed-Tsochas (2010), Twitter Bakshy et al. (2011), and other social media Lerman and Ghosh (2010); Simmons et al. (2011).
As information diffuses, individuals can display a range of decision making behaviors driven by new information. Phenomena of particular interest include (1) the dynamics of cascading behavior, which can explain how and why fads emerge Watts (2002) or rumors spread so quickly Doerr et al. (2012); Zhang et al. (2013), and (2) the role that individuals play as “spreaders” in facilitating the propagation of this behavior Kitsak et al. (2010); Borge-Holthoefer and Moreno (2012); Borge-Holthoefer et al. (2012), or similarly the roll that “homophily” can play in abrogating uptake of a behavior Centola (2011). Social epidemics, much like their biological counterparts Dodds and Watts (2005); Bettencourt et al. (2006); Diaz-Aviles et al. (2012); Li et al. (2013), are often modeled as single- Burt (1987) or multi-stage Melnik et al. (2013) complex contagion processes Centola et al. (2007); Centola and Macy (2007); Centola (2010).
Recent theoretical investigations have examined how this information exchange leads to collective action. In one class of models, individual agents occupy nodes on a network, and a set of rules defines information propagation dynamics and individual decision making behavior (e.g., see Dodds and Watts (2005); Bassett et al. (2012); Zhang et al. (2013)). Complementary data driven investigations describe computational algorithms that begin to unravel rules for influence and decision making from large databases, such as Twitter, Facebook, and wireless communication networks (e.g., Lotan et al. (2011); Barahona et al. (2012); Borge-Holthoefer et al. (2012); Sano et al. (2013)). In most cases the databases identify decisions that are made and delineate links between network members. However, information about the factors that drive human decisions, including individual observations, attention, history, personality, and risk perception is generally unavailable.
This paper focuses on a critical link between simulation studies and empirical observations of large scale networks. Specifically, we conducted a behavioral experiment involving a group of 50 individuals in a computer laboratory. Because human behavior is often far from what is predicted by idealized models, experimental observation in “live” and controlled environments are essential for improved understanding and modeling of social phenomena. Our work adapts the framework of Kearns et al. Kearns et al. (2006, 2009); Judd et al. (2010); Kearns (2012), who have conducted a series of “behavioral network science” (BNS) experiments that have focused on collective problem solving tasks, such as abstract graph coloring problems or economic investment games. These experiments, and similar experiments from other research groups, have demonstrated that “human subjects perform remarkably well at the collective level” in a number of tasks and scenarios, both competitive and cooperative Kearns (2012); Mason and Watts (2012); Nedic et al. (2012). However, disasters and other crisis situations often display the opposite effect Drabek (1986); Lindell et al. (2006); Dash and Gladwin (2007); Sweeney (2008); Conneally . Social interactions affect traffic flow Helbing et al. (2000); Helbing (2001), and can lead to a “mob mentality” Banerjee (1992); Bosse et al. (2012); Edelson et al. (2011) that hinders evacuation and may lead to injury and violence. Moreover, associated spatiotemporal clustering of departure times can lead to traffic congestion and delays Church and Sexton (2002); of Transportation and of Homeland Security (2006); Huang (2011).
Therefore, in contrast to previous BNS research involving idealized, abstract games, our investigations involve decision making in a threat scenario. Specifically, our study is set in the context of an impending natural disaster, where each individual occupies a node in a social network and must decide whether or not to evacuate. The experiment is conducted for a sequence of time-evolving disaster scenarios. In each scenario, individuals receive real time updates from a centralized information source about the likelihood, severity, and timing of a disaster that threatens their virtual community. Individuals also receive social information regarding decisions of their neighbors, and availability of space in a virtual shelter. Thus, participants face a tradeoff in competing types of information (i.e., centralized broadcast information versus decentralized social information) in a laboratory setting that emphasizes risk and loss.
Compared to large data driven studies, the experiment provides a much more complete, quantitative set of measurements, enabling us to assess factors and isolate tensions that arise in human decision making. In addition to observing the ultimate evacuation decisions, our experimental setup allows us to monitor the behavior of individuals as they gather information. Prior to the experiment, we also assess individual personality profiles and risk attitudes using standardized tests. The ability to acquire this extensive set of static and dynamic measurements both prior to and during the decision making process allows us to quantify links between psychological assessments and heterogeneity in group behavior.
A primary outcome of this study is the identification of a decision model for evacuation behavior based on empirical observations. The model output fits the observations remarkably well and can be used to quantify individual differences in decision dynamics. The empirical model reduces the catalog of scenarios and observations to a few key parameters involving an overall multiplicative rate factor for evacuation, an average decision threshold based on the disaster likelihood, and variability about the average threshold, reflecting how consistently the decision making threshold was applied. The model enables us to isolate and compare two sources of urgency in the experiment that differentially impact observed behavior: time pressure for the evacuation decision and competition for shelter space. This empirical model stands in contrast to a set of models typically used in numerical simulations or large scale, data driven studies that treat decisions as random, optimal, or based on a threshold applied to a state variable representing opinion, which is updated by an assumed interaction rule (e.g., Banerjee (1992); Watts (2002); Sood et al. (2008); Huang (2011); Bassett et al. (2012); Bosse et al. (2012); Helbing et al. (2000); Helbing (2001)).
While our experiment is admittedly well removed from a true natural disaster, it allows us to isolate and quantify tensions that arise in a crisis, in a manner that would not be possible during an actual event. Furthermore, the experimental design takes into account known psychological factors associated with risk perception, threat, and information processing Gigerenzer (2002); Chib et al. (2012); Edwards et al. (2012); D. R. Bach (2012). A key component of behavioral network science is to use the observed human behavior as inspiration for the development of novel computational models of behavior, which can in turn be tested in future experiments. This spiral development of model-experiment-model or experiment-model-experiment may be used to develop optimal strategies for disseminating information during a disaster, and insuring sufficient allocation of resources for disaster response.
Materials and Methods
On May 18, 2012 an experiment was conducted at the University of California, Santa Barbara (UCSB) in which 50 student participants within a virtual community each decided if and when to evacuate from impending natural disasters. All participants provided written informed consent, and the experimental protocol was approved by the Institutional Review Board of UCSB. The demographic composition of the participants was not released for publication. Prior to taking part in the study, the personality profile of each participant was measured using the Big Five Inventory (BFI-44) questionnaire John et al. (2008, 1991); Benet-Martinez and John (1998), and the risk preferences of each participant were also measured in six domains (social, investment, gambling, health & safety, ethical, and recreational) using a Domain Specific Risk Attitude Scale Weber et al. (2002); Blais and Weber (2006). The Big Five Inventory is a commonly used set of 44 questions that enables the assessment of an individual’s personality along the following dimensions: extraversion, neuroticism, openness, conscientiousness, and agreeableness. The Big Five is used extensively in psychological research as well as in translational applications such as the assessment of learning styles and employee placement. The Domain Specific Risk Attitude Scale is used in psychological research to assess risk perception and risk behavior, to predict human behavior, and to develop policy in areas such as health and natural hazards. Administration of each questionnaire lasted approximately 7 minutes.
Individuals participated in 47 scenarios (runs) that lasted one minute each. At the beginning of each scenario, each participant was given 100 monetary “points” that were at risk from a simulated disaster. During each scenario, participants were provided with information about the progression of the disaster, and they were offered the opportunity to evacuate from this disaster (a binding decision) and occupy one of a limited number of spaces in a virtual disaster shelter. Depending on their decision and the outcome of the disaster, they could lose some or all of their monetary points. The magnitude of the loss was a function of whether or not the individual successfully evacuated to the shelter, and whether or not the disaster struck. The total amount paid to a participant at the end of the experiment was a function of their cumulative score over the 47 runs. The running cumulative scores of all of the participants were ranked and displayed on a leader board at the front of the room. This allowed individuals evaluate their strategy and provided a competitive incentive.
Experiment Layout
The primary objective of this project was to understand the way in which individual decision makers use and share information, and how this information leads to collective action of the group as a whole. Of particular interest was obtaining insight into the influence of competing sources of information on individual and group behavior.
To reach these objectives, we employ an experimental setup derived from that of Kearns et al. Kearns et al. (2006, 2009); Judd et al. (2010); Kearns (2012). We customize the computational framework and user interface to our evacuation problem. Each participant sits in front of a computer screen, see Figure 1A, containing two tabbed windows, labeled “Disaster Information” and “Social Information.” The participant may only view one window at a time and can switch between these two sources of information by clicking on the tabs.
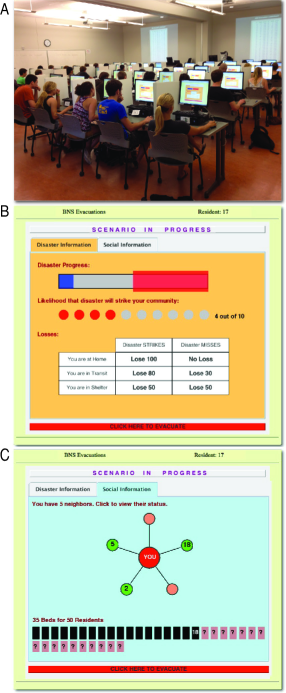
The Disaster Tab, shown in Figure 1B, provides participants with information about the simulated time-evolving disaster. At the top of this tab is a disaster progress bar, which incrementally turns blue as time goes by; a red box around the scenario progress bar signifies the time window in which the disaster could strike. The likelihood that the evolving disaster will strike the community is presented in real time as the proportion of filled circles (e.g., 4 out of 10 filled circles indicates a current probability of 40%). A loss matrix shows how many points an individual will lose at the end of the current scenario depending on the outcome of the disaster and the individual’s final location. Finally, a button at the bottom of the Disaster Tab allows participants to evacuate. When an individual clicks the button, they transition from being “AtHome” to being “InTransit.” If there is still space available in the shelter, the individual immediately transitions to being “InShelter.” However, if the shelter is already full, the participant remains InTransit through the rest of the current scenario.
The Social Tab, shown in Figure 1C, allows the participant to query the status of neighbors in their social network by clicking on each neighbor’s node. If the neighbor is still AtHome, then the letter ‘H’ appears on the neighbor node. If the neighbor has evacuated, a subsequent click is required to identify this. If the neighbor is InTransit, then the letter ‘T’ appears. If the neighbor is in the shelter, then the shelter space (or “bed”) number that the neighbor occupies in the shelter appears. This value provides a lower bound on the number of beds occupied in the shelter and is also recorded in a shelter diagram toward the bottom of the Social Tab. The evacuation button located on the Disaster Tab is mirrored on the Social Tab to enable participants to make their evacuation decision irrespective of their current tab location.
Psychometrics of Participants
Personality metrics.
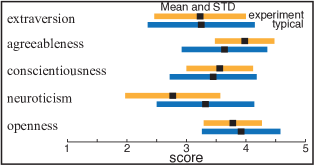
The Big Five Inventory measures an individual’s personality based on five characteristics: extraversion, agreeableness, conscientiousness, neuroticism, and openness John et al. (2008, 1991); Benet-Martinez and John (1998). As shown in Fig. 2, the group of individuals that volunteered to take part in our experiment displayed similar personality profiles to the typical values for a similar age group Srivastava et al. (2003), with the exception of neuroticism which was significantly lower than in the general population.
Risk Attitude:
The risk attitude questionnaire scores both general risk attitude and specific risk types in the following domains: investment, health & safety, gambling, social, ethical, and recreational. The evacuation scenarios in this experiment were developed predicated on the assumption that individuals would be averse to the loss of monetary points (financial risk), and loss of life and property (health & safety risk). Participant responses to questions on the Domain Specific Risk Attitude Scale test ranged from “1” (Risk Averse) to “5” (Risk Seeking) with “3” indicating a risk neutral attitude. The general risk attitude distribution was risk averse (). When segregated into the separate domains, the population displayed a range of risk attitudes summarized in Table 1.
| Domain | Mean | STD | Attitude Tendency |
|---|---|---|---|
| Social | 3.49 | 0.57 | Risk Seeking |
| Recreational | 3.09 | 0.90 | Risk Neutral |
| Gambling | 1.59 | 0.77 | Risk Averse |
| Health & Safety | 2.65 | 0.64 | Risk Averse |
| Ethical | 2.02 | 0.56 | Risk Averse |
| Investment | 2.76 | 0.92 | Risk Neutral |
Risk attitude scores in 6 domains: mean and standard deviation (STD) calculated over all 50 participants.
Scenario Simulation Mechanics
Our experimental setup had several key features designed to enable the isolation of external drivers and the identification of tradeoffs in decision mechanics. These features included a network structure linking participants and constraining information diffusion, time-evolving disaster trajectories, and scenario-to-scenario variation in shelter capacity, time pressure, and potential risk to monetary “points”. We describe these features in greater detail below.
Network Structure.
In our experiment, a network structure enables participants to observe the actions of others. In each scenario, participants are assigned at random to a node in an underlying social network topology designed by the researchers. This allows an individual to have a different number of neighbors in each scenario, and for the number of neighbors to vary by individual in a single scenario. There were 8 networks used in the experiment: 3 “regular” ring lattice graphs, where each node was connected to nodes within a distance 1, 2, or 3, resulting in fixed node degree 2, 4, or 6, respectively; and 5 “variable” graphs where nodes had degree with an average . More specifically, the latter networks were generated as random graphs with specified degree sequence {1(10), 2(8), 3(7), 4(6), 5(5), 6(4), 7(4), 8(3), 9(2), 10(1)}, according to the algorithm specified in Bayati et al. (2010) and implemented in the NetworkX Python library Hagberg et al. (2008). Number of neighbors was varied to measure the affect on frequency of seeking social information. Different network structures were used as they predict different rates of information diffusion, with random networks having rapid diffusion, and regular lattice graphs having a slow rate of diffusion Easley and Kleinberg (2010).
Disaster Trajectories.
The disaster strike probability as a function of time , denoted by , was generated in advance from a well-defined stochastic process (details of its construction can be found in Crews (2012)). The process corresponds to a two-dimensional progression of a threat that moves toward a notional “target” with random lateral motion in one dimension and monotonic forward progression in the other dimension. The lateral motion is simulated with a range of step sizes limited by a prescribed volatility, while the forward motion may either have variation or step deterministically. We record a “Hit” (corresponding to a disaster strike) if the threat contacts a target, or a “Miss” if the forward motion causes the threat to pass the target without hitting. Participants can observe a truncated value of on the Disaster Tab which is updated every second, however the overall trajectory is not shown. There were a total of 23 trajectories used in the experiment, with many of the trajectories repeated with different settings for other experimental variables.
Shelter Capacity.
Scenarios varied in shelter capacity. There were 5 different shelter capacity scenarios: 50, 40, 30, 20, and 10 beds. When the number of beds in the scenario was less than 50 (the number of participants), individuals had to compete for access to these beds and could access information on the availability of shelter space through their social network.
Time Pressure.
Scenarios varied in time pressure for an evacuation decision. When forward motion in the disaster trajectory model was deterministic, the disaster would either Hit or Miss at exactly 60 seconds. This type of time pressure is denoted “CertainTime”. For runs with variable time steps in the disaster trajectory model, the disaster could hit at any point between 30 and 60 seconds, with an end time that is not known in advance to the participants. We refer to this type of time pressure as “VariableTime”. The distinction between these types of scenarios could be observed by participants through the red box around the scenario progress bar on the Disaster Tab. These different scenarios were designed to test how temporal uncertainty affected evacuation strategies.
Potential Loss.
Scenarios varied in potential risk to monetary “points”. At the start of a scenario, each participant is staked 100 points. The amount lost due to the disaster depends on the loss matrix, the outcome of the scenario, and by the individual’s location at the end of the run (AtHome, InShelter, or InTransit). Three loss matrices were used in the experiment and were based on underlying incentive structures designed by the researchers, with the values changing between runs acting to simulate varying disaster severity. The six entries in the loss matrix (seen on the Disaster Tab) correspond to the combination of the three end-state possibilities and the two disaster outcome possibilities. All loss matrices had a 0 point loss for an (AtHome, Miss) outcome, with increasing loss for (InTransit, Miss) and (InShelter, Miss). When the disaster hit, loss is minimized for the combination (InShelter, Hit), followed by (InTransit, Hit), and the most costly outcome is (AtHome, Hit). While one could envision many disaster scenarios where it would be more costly to be InTransit than AtHome, our modeling choice was motivated by InTransit resulting in distancing oneself from the disaster epicenter, and more generally, taking some action rather than none. Values in the loss matrix were deliberately chosen to prevent trivial solutions, such as always evacuate or always stay home, from being winning strategies.
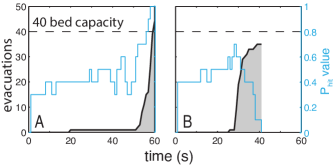
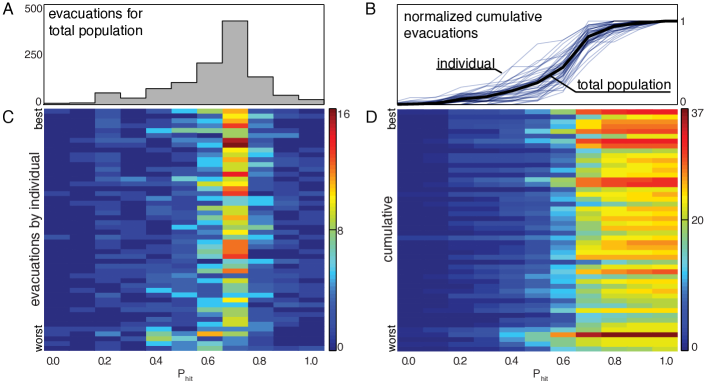
To summarize our setup and participant behavior, we plot the cumulative behavior for two evacuation scenarios in Figure 3. The overall behavior in each scenario can be observed by the interaction of the trajectory (in blue), the cumulative number of evacuations (grey fill), the number of available shelter spaces (dashed line), and the end time of the scenario. The scenario in Figure 3A is CertainTime while the scenario in Figure 3B is VariableTime. In both scenarios, there are 40 shelter spaces (beds) available for the 50 participants. In Figure 3A, we observe evidence of a stampede in which participants evacuated for limited shelter space toward the end of the scenario; some participants were left stranded in the state InTransit. In Figure 3B, we observe that a large number of participants evacuated at approximately the 30 second point in the scenario (the first time the run might end), but that the disaster did not happen.
Results
The data collected during the experiment include every mouse click, for all 50 participants in each of the 47 disaster scenarios. From the data we can identify what each individual was seeing, when they were seeing it, and if and when they evacuated. This section describes empirical observations and statistical analysis based on these results, which is used to develop a quantitative decision model in the next section. Key variables include the strike probability () trajectory (Fig. 3 blue), the loss matrix, the number of beds in the shelter (Fig. 3 dashed-black), and time pressure for the evacuation decision.
Participant rankings and scores.
The success of each participant in each scenario is depicted in Figure 4A. We quantify a participant’s success using the total point score retained at the conclusion of the 47 runs. The three types of successful decisions [(InShelter, Hit); (InTransit, Hit); (AtHome, Miss)] are shown in white, while unsuccessful decisions are shown in black. In the “hardest” scenario (located towards the left-most side of the panel in Figure 4A), there were zero successes in the population, while in the “easiest” scenarios (located towards the right-most side of the panel) a single participant was unsuccessful in each run.
The distribution of cumulative scores is skewed: the lowest scoring participant is far below the rest (see Figure 4B). We analyze the differences in decision making patterns for different individuals in more detail in a later section entitled Individual Variation.

Participant score correlates with risk attitude.
We hypothesized that risk attitude in both the financial domain and the health & safety domain would be a significant factor in overall performance. We estimated an individual’s general financial risk attitude by averaging their scores from both gambling and investment risk domains Blais and Weber (2006); Weber et al. (2002), and we estimated their overall performance using the cumulative score. Cumulative score was significantly correlated with health & safety risk attitude (Pearson correlation: , ) but not with financial risk attitude (, ). These results indicate that individuals that were more averse to health & safety risks (and therefore potentially more susceptible to the specific influences associated with an evacuation decision scenario) performed better than those that were less averse.
An interesting question is whether the observed correlation between risk attitude and performance was consistently observed over the population or whether it was driven by a subset of individuals. From a psychological perspective, one meaningful segregation of individuals into groups is a partition based on the consistency of individual risk preferences across domains. Individuals with consistent risk preferences across domains often display different personality traits — which could directly lead to differences in behavior — than those with inconsistent risk preferences across domains Soane and Chmiel (2005). To estimate the consistency of risk attitudes we computed the standard deviation of mean scores across the 6 risk domains. We separated participants into a “consistent” group, composed of those individuals with (N=31), and an “inconsistent” group, composed of those individuals with (N=19). The observed correlation between performance and health & safety risk attitude appears to be driven by individuals with inconsistent risk attitudes (, ) rather than by individual with consistent risk attitudes (, ). This suggests that individuals with domain specific risk attitudes might tune their behavior more closely to the risk structure of the experiment.
Participants focus on Disaster Tab.
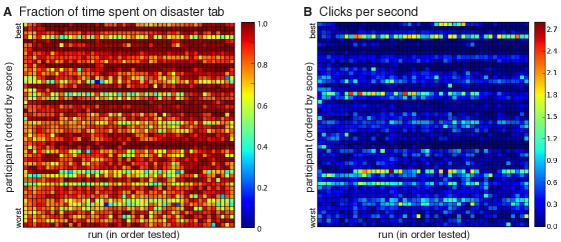
Our results indicate that participants viewed the Disaster Tab more than the Social Tab. Individuals spent the vast majority of their overall scenario time on the Disaster Tab, and they made 99% of evacuation decisions while on this tab (see Fig. 5A). Although on average participants did not tend to spend as much time on the Social Tab, there was significant variation. We did not observe a significant relationship between time spent on each tab and performance.
Clicking behavior links to Social Tab.
Click frequencies for all participants in all scenarios are shown in Figure 5B, which lists participants by their overall performance (highest first). We can see from this figure that the higher click frequency individuals spent less time on the Disaster Tab and therefore more time on the Social Tab. The majority of participants displayed low values of clicking activity, indicating that they accessed social network information infrequently. We did not observe a significant relationship between click frequency and performance.
Network structure drives time spent on Social Tab.
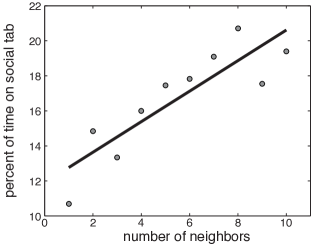
The total number of neighbors a participant could have in any single scenario ranged between one and ten. Fig. 6 shows that participants with many neighbors tended to spend more time on the Social Tab than those with few neighbors. This result is intuitively consistent with the fact that highly connected individuals could gain more social information than less connected individuals, and might therefore be predisposed to spend more time on the Social Tab to obtain this information.
Evacuation decision tied to disaster likelihood.
Disaster likelihood values strongly influenced decision making, as shown in Fig. 7A. Here we see each observed evacuation grouped by value at the time of evacuation. The distribution has a sharp peak at . The cumulative distribution is shown in Figure 7B (black) and indicates that across all scenarios, about 90% of evacuations occurred before exceeded 80%.
High scoring individuals evacuate frequently.
We observed a significant correlation between score and number of evacuations at (Pearson correlation: , ). The lowest scoring individuals (see Fig. 7C, bottom) evacuate earlier and have a greater variation in the values at which they evacuate. In Fig. 7D we present the cumulative number of evacuations, a running sum of the the data in Fig. 7C. Here we observe a relationship between the total number of evacuations and score: highest scoring participants (top) are more likely to have a higher number of total evacuations than lower scoring participants (bottom). We confirmed this observation by calculating the Pearson correlation between score and total number of evacuations: with . A notable exception to this trend is the fourth lowest scoring participant who also has the highest number of evacuations. Interestingly, this participant tended to evacuate much earlier than the other participants, resulting in many erroneous evacuations and therefore a lower cumulative score.
Analysis
Following the experimental observations described above, our objective is to identify a model for evacuation decision making that can be used to quantitatively capture the main features of population level behavior (this section) and the heterogeneity of individual behavior (next section). The model will allow us to infer how the different experimental variables affect evacuation decision making. Our strategy uses data from the behavioral experiment to determine a decision model that depends on a few key state variables in the experiment (e.g., the probability of the disaster event ). Based on summary statistics of evacuation behavior, we identify the functional form of the model and quantitatively estimate parameters. We then evaluate the accuracy of the model for predicting evacuations using state variables and detailed time trajectories from each individual run of the experiment. Our approach enables a concrete validation of our model, and provides direction for future experiments and large scale simulations of population behavior in similar scenarios.
Determining the dynamics of decision making strategies from the distribution of evacuations (Fig. 7A) is a complex problem that can be confounded by various factors including the distribution of values observed by a participant and individual differences in reaction time. To account for these factors we introduce a rate model relating the number of participants evacuated to the number of participants AtHome, and determine how state variables such as affect the rate.
As changes every second in our scenarios, it is natural for us to examine the data in one second intervals, within which is constant. We then define two indicator functions that enable us to quantify the number of participants evacuated and the number of participants AtHome. First, we define the indicator variable if participant was AtHome at the start of the interval during run , and otherwise (i.e., the participant had already evacuated). Second, we define the indicator variable if participant evacuated during interval on run , and otherwise. These quantities are related by the equation:
| (1) |
We approximate an individual’s decision to evacuate as a Bernoulli process in the following way. First we note that when , we can model the probability of evacuating during the interval as a rate, denoted , where . We treat the observed value for the indicator variable as one sample of an underlying stochastic process that can take a value of either or . A single sample of the data provides a poor estimate of the rate . However, by modeling the data as a Bernoulli process, we can estimate the variance in rate, based on our limited number of observations. This approach enables us to derive a decision model without overestimating our confidence in small samples of data.
We hypothesize that varies in a predictable manner according to a small set of state variables that capture the essential decision parameters in the experiment. To uncover these trends, we partition the data in a number of ways in this and the following section. In this section, we combine data for all the participants to obtain aggregate rates for the population as a whole, and in the following section, we consider heterogeneity in the evacuation rates of individual participants.
We begin by aggregating the data for specific disaster likelihoods , which in the experiment can take on values . For each possible value , we determine the total number of intervals in the aggregate experiment where a participant who is AtHome observed :
| (2) |
We likewise determine the total number of times such participants then evacuated:
| (3) |
We use the uppercase to indicate the evacuation rate for each value . If we think of as a random variable (modeled as a sum of Bernoulli variables) given and , then has a binomial distribution. Conversely, the likelihood of given and , has a Beta distribution Otto and Day (2007), with parameters and . We thus measure rates from the data using the expected value of this Beta distribution:
| (4) |
The standard deviation of these estimates is given by:
| (5) |
Given an abundance of data, the measured rate converges to the more intuitive fraction of evacuations . However, when data is limited the approach described above yields a more accurate description of the evacuation behavior.
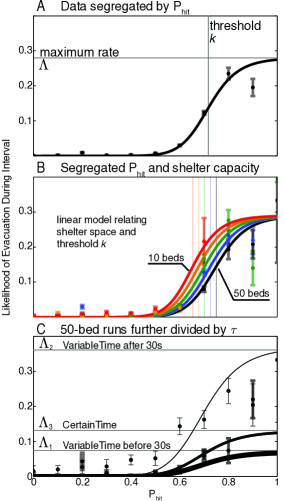
Fig. 8A shows the estimated rates (black dots) associated with the 11 possible values of the disaster likelihood . We observe that the rates increase approximately monotonically with in a manner that is reminiscent of a Hill function Shuler and Kargi (2001). We therefore model using the following functional form:
| (6) |
which enables us to describe the decision making dynamics of the population using three parameters. First, denotes the maximum evacuation rate; when is large, saturates to this value. can therefore be used to estimate how quickly participants are able to react to rapidly changing conditions. Second, the threshold parameter represents the half maximum value of , i.e., . Third, the Hill-parameter dictates the steepness of at . For large values of (e.g., ), is threshold-like, being approximately for , and approximately for . For smaller values of the transition is more gradual. Threshold policies have been extensively studied in previous work and are postulated to accurately characterize individual decision making behaviors in a variety of scenarios Granovetter (1978); Macy (1991); Watts (2002); Bassett et al. (2012).
All models used in the manuscript are fit to the data by evaluating the measured rates at each value of the disaster likelihood to obtain . We then vary , and to maximize the expression:
| (7) |
a fit directly to the and values, not the values. This expression is derived through maximum likelihood estimation Bevington and Robinson (2002) for Beta distributed measurements. The more common minimization for curve fitting is similarly derived from maximum likelihood estimation for Gaussian distributed measurements Bevington and Robinson (2002), and our formula serves the corresponding role.
Fitting our model to the measured rates in Fig. 8A, we obtain , , and . The standard deviations reported here were obtained via bootstrapping Press et al. (1992) where we constructed synthetic data sets by randomly selecting 47 runs with replacement from the original data, then aggregating the data and fitting the model to the synthetic data using the method described above. The best fit model is plotted in Fig. 8A (solid black line). For most values of , we find that this model accurately captures the observed behavior. However, we also observe systematic variations between the model and the experimental data. One set of variations appears to stem from shelter capacity while the other appears to stem from temporal urgency for the evacuation decision.
To examine the role of shelter capacity in decision making, we aggregate the data for each of the disaster likelihoods at each of the values of shelter capacity . We adapt our use of the subscript to now indicate this finer-grained aggregation into sets of data. The measured rates confirm our expectation that evacuation rates were high when shelter space was scarce and low when shelter space was abundant (see Fig. 8B).
To model the role of shelter capacity in modulating the average form of the evacuation decision, we consider two families of Hill functions based on our previous fits: one family drawn from variations in and a second family drawn from variations in . To guide our choice between these two alternatives, we consider optimal decision making behavior. If shelter space is abundant and information is precise, the optimal evacuation decision rule will be a threshold-like function in which the value of the threshold is just below . This behavior ensures that the individual evacuates when there is near certainty that the disaster will hit the community. If instead there is very limited shelter space and the costs of the two possible incorrect decisions are equal, the expected evacuation decision rule will also be a threshold-like function, but in this case the value of the threshold will be just above . This behavior ensures the best chance of getting a bed in the shelter, which is the lowest loss associated with a wrong decision.
Because the threshold value appears critical for optimal decision making behavior in scenarios of both abundant and scarce shelter space, we choose the family of Hill functions obtained from varying . We find that the following linear model of versus :
| (8) |
fits the data well. In Fig. 8B, we show the set of curves extracted for the best fit to the model in (8) alongside the raw empirical data. The best fit values for are and .
To test the accuracy of this model and to identify systematic differences between the best fit model and the data, we compared the predictions of this model to the data, and found a systematic trend whereby we overestimate the number of evacuations occurring prior to 30 seconds in VariableTime runs and underestimated the number of evacuations occurring after 30 seconds in those runs. The difference between actual and predicted evacuations was profound and the shift between overestimating to underestimating was abrupt, shifting at exactly the 30 second mark in nearly every VariableTime run. These results show that an individual’s behavior is additionally influenced by temporal urgency.
To quantify the effect of temporal urgency, we extend our model in the following way. As in the previous versions of the model, we aggregate the data for each of the values at each of the values of shelter capacity . However, in this case we additionally aggregate data for the following separate cases with differing temporal urgency: prior to 30 seconds in VariableTime runs (), after 30 seconds in those runs (), and all data in CertainTime runs (). We again adapt our use of the subscript to now indicate this even finer-grained aggregation into sets of data.
To determine if temporal urgency had a more significant effect on or on the threshold parameters (, and ), we fit the model equation in Eq. 8 independently to the 3 cases. From these fits and the confidence intervals on the parameter estimates we were able to determine that the variation of with temporal urgency was more significant than the variation of , , or . We therefore constrained variation with temporal urgency to , adopting a six parameter model:
| (9) |
which has three values. The best fit values are presented in Table 2.
| Parameter | Symbol | Value | STD |
|---|---|---|---|
| Hill-coefficient | 9.3 | ||
| Maximum rates: | |||
| 0.07 | |||
| 0.37 | |||
| 0.13 | |||
| Threshold parameters: | () | ||
| Offset | 0.60 | ||
| Proportionality const. | 2 |
Figure 8C illustrates the measured rates and model curves for a characteristic subset of the data (runs with 50 beds) for each of the three time windows (). For this partitioning of the data both the first 30 seconds of VariableTime runs () and the full 60 seconds of CertainTime runs () are described by similar low evacuation rates evacuations/second and evacuations/second, respectively. Both of these are significantly smaller than the corresponding rate evacuations/second for original aggregated data (Figure 8A) as well as the rate evacuations/second observed after 30 seconds in the VariableTime runs (). The increase in rate during the uncertain window in the VariableTime runs reflects a high temporal urgency associated with a disaster that could strike at any moment. It also suggests participants will respond quickly to changing values under these conditions.
The relatively low values of and are likely due to the fact that in these cases the disaster strike is only possible in the last time increment of these partitions, a low temporal urgency. In each case, urgency increases towards the end of the interval, and this occurs to a greater degree for (CertainTime) than for (first time window in VariableTime). In CertainTime runs, the scenerio terminates at exactly 60 seconds, so in this case the last observed value describes the likelihood of a strike at 60 seconds, whereas in the first 30 seconds of the VariableTime runs the value of at the end of the interval reflects the probability of a Hit not necessarily in the next time increment, but rather at some time within the uncertain 30 second window. We expect this distinction underlies our observation that .
Simulations
We test our decision model by using it to simulate evacuation behavior for the 47 scenarios in the behavioral experiment. The appropriateness of our model can then be quantified by the difference between simulated and observed behavior, with small differences indicating that our model could be used as a generative model in future numerical studies.
In the experiment, each scenario is characterized by a shelter capacity and time pressure , as well as a prescribed sequence of disaster likelihood values . Using our decision rule, we can compute the expected rate of evacuations at each instantaneous value of . If we initialize every simulation with 50 individuals at home (), we can compute the expected number of people AtHome in each interval using:
| (10) |
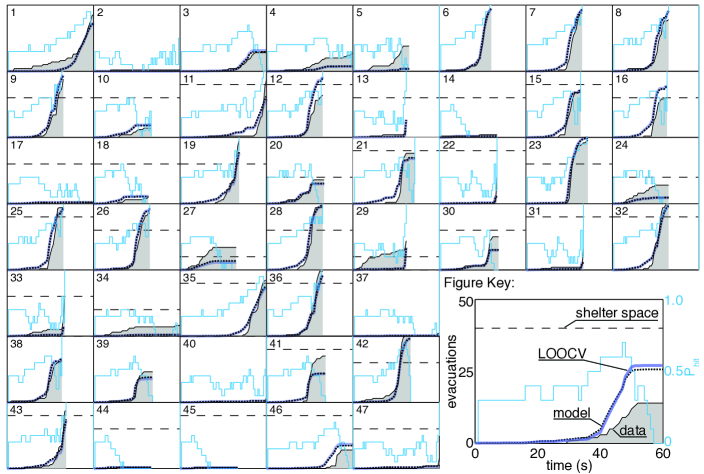
In the paragraphs below, we comment briefly on several key results from our simulations (see Fig. 9).
Decision model accurately describes experimental observations.
In the majority of scenarios the simulated behavior has very little deviation from the observed behavior. This result is striking because our model aggregates the data over all participants over all scenarios to a reduced set of six parameters, with no time resolution aside from separation into the three bins associated with the different time pressure variables. In the majority of scenarios the simulated evacuation behavior is qualitatively, and in many cases quantitatively, matched to the observed behavior of experiment participants.
As a check that we have not over-fit the model, we have performed a leave-one-out cross-validation (LOOCV) Hastie et al. (2009), where for each of the 47 runs, we exclude the data from that run, and see how the model trained on the other 46 runs predicts the outcome. The LOOCV results (Fig. 9, violet curves) were nearly identical to the predictions of the full model (Fig. 9, dotted curves), indicating that the model is not over-fit. This result also suggests that the model will predict the outcome of other scenarios with the same accuracy of the simulations shown here, assuming that the trajectories are created using the same rules.
We begin our description of Fig. 9 with the three runs where participants had the most success, 36, 44, and 45. As can be seen here and in Fig. 4A (far right), all but a single individual made the correct evacuation decision in these runs. In run 36, the disaster had a very predictable trajectory, gradually increasing in before eventually striking. In runs 44 and 45, the disaster had a poor likelihood of striking and decayed fairly rapidly. In contrast, the most difficult run was number 42. The trajectory in this run peaked at 0.9 before the chance of a disaster strike rapidly decayed and the run ended with a Miss. As can be seen here and in Fig. 4A (far left) every participant was left either InShelter or InTransit.
We observed sub-optimal decision making.
In general, the optimal decision to evacuate in a given scenario depends not only on the likelihood and volatility of the underlying disaster process, as well as on the loss matrix, but also on the shelter capacity and the decisions of other individuals. However, scenarios 1, 2, 3, 4, 37, and 40 are unusually simple in that participants knew that these scenarios would each last exactly 60 seconds, and that there was adequate shelter capacity for all participants. These two simplifying factors ensured that the actions of other participants had no direct effect (though they could presumably influence behavior, e.g. peer pressure). In these scenarios, it would be optimal to wait until immediately before the potential disaster strike to evacuate. As Fig. 9 indicates, in scenarios 1, 3, and 4, participants did not follow the optimal strategy; rather a significant number of participants evacuated well before the end of the scenario. In fact, many participants evacuated after only approximately 30 seconds. This behavior proved costly for them in scenarios 3 and 4. Scenarios 2, 37, and 40 are less conclusive because the strike likelihood in these scenarios never exceeded 0.5 (and the disaster did not hit), making it relatively easy to decide not to evacuate.
Participant behavior adapts over time.
By construction, several scenarios contained identical trajectories but differed in other parameters. Among these “repeated” disasters, we observe evidence of learning with regard to time pressure. In runs 1, 3, and 8 there were some unnecessarily early evacuations, but participants waited longer to evacuate in the corresponding runs occurring later in the experiment (runs 35, 46 and 25).
This observed adaptation could be explained either by effects of time pressure or by effects of strike likelihood. To determine the dominant driver of the adaptation, we compared the evacuation rates in runs 1-8 with those in runs 37-40 to determine whether there was evidence for adaptation in decision making strategies. While these runs differed in strike likelihood, the measured rates observed in the two groups did not show a significant change at high values. This suggests that although participants seemed to adapt their strategies in relation to time pressure, they did not adjust their behavior in relation to strike likelihood.
Unexpectedly extreme sensitivity to shelter capacity.
In each of scenario runs 27 and 29, shelter beds were scarce (10 beds for 50 people) and more participants evacuated early in the scenario than our model predicted. It is possible that either (1) our linear model of the variation of the threshold with shelter capacity is inadequate when shelter space is very scarce, (2) that time pressure affects player behavior before 30 seconds in VariableTime runs with low shelter capacity, or (3) the participants were reacting to each of these scenarios also immediately following runs in which a large number of individuals evacuated after the shelter was full, leaving those individuals stuck InTransit (runs 26 and 28). The early evacuations in runs 27 and 29 could therefore be a reaction to participants being caught InTransit in the previous run. We are unable to discriminate between these three possibilities with this data set; we leave this for future work.
Individual Variation
Our success in identifying a decision making model that captures the observed collective evacuation behavior in the experiment led us to test whether a similar method could differentiate between individual decision making strategies. In the previous analyses, we combined data for all of the participants, which enabled us to fit the model to several experimental variables. Because the evacuation data for individual participants is relatively sparse, here we focus exclusively on the influence of the disaster likelihood in decision making and do not separately consider the effect of shelter capacity or time pressure.
To extend the collective decision making model to individuals we estimated the evacuation rates for each participant at each value using Eq. 4. We show this data in Fig. 10, where individuals are ranked by score from highest scoring (top left) to lowest (bottom right). Some individuals had as few as 9 measured rates, as they consistently evacuated before (see truncated curves in Fig. 10).
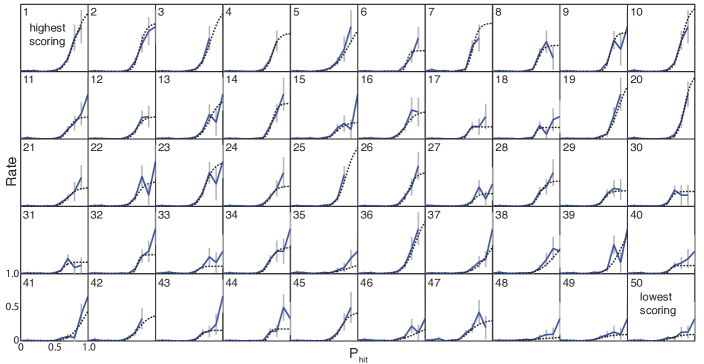
Comparing the raw data in Fig. 10 for individuals with the corresponding measured rates for the aggregate population shown in Fig. 8 illustrates an interesting deviation in the measurements at high values of . For the aggregate population there is a significant and somewhat counterintuitive drop in measured rate from to 0.9; the value of the measured rate represented by the data points at lies below the value represented at . However, while non-monotonicity is observed on the scale of individuals the trend is not systematic (see Fig. 10). The difference between the population and individual fits suggests that the observed drop in the measured rate at high in aggregate data is driven by heterogeneity in the population. Participants with high evacuation rates tend to leave before . Those who remain and observe high values of typically display low evacuation rates, thereby biasing the summary rates measured at the population scale.
To capture individual decision making strategies, we fit a three-parameter Hill function (Eq. 6) to each individual’s measured rates using Eq. 7. As shown in Fig. 10, the best fit models based on the Hill function capture the measured rate curves of each participant with striking accuracy.
Higher evacuation rates accompany better performance.
The wide range of participant decision making behavior is clearly visible in Fig. 10. The variability is especially apparent when we compare the highest scoring individuals with the lowest scoring individuals. The highest scoring participants exhibit rates that increase sharply and monotonically, approximately beginning at . The lowest scoring individuals rarely evacuate; we observe flat evacuation rate curves, with measured rates that are relatively much lower and less systematic in their variations compared to high scoring individuals. As is apparent from the accuracy of the fits, this distinction is well captured by our model.
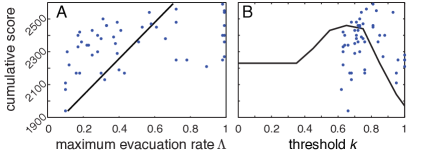
A fundamental goal of our experiment was to identify psychological and behavioral predictors of individual performance. First, we ask whether parameter values from the best fit models on individual participants could be related to behavioral performance in the experiment. The best fit models yielded rates , with values for every individual displayed in Fig. 11 A. Overall, we observe a significant positive correlation between the maximum evacuation rate in the best fit models and cumulative score (Pearson , ; see Fig. 11A). We speculate that the maximum evacuation rate could be related to a participant’s fundamental reaction time. If true, our results suggest that participants who can react quickly to rapidly changing conditions in their environment are more successful in the experiment.
As expected, we do not see a significant linear correlation between cumulative score and threshold parameter . This results from a mid-range value of having an optimal effect, with low thresholds resulting in erroneous evacuations, and high thresholds resulting in disaster strikes while AtHome. To illustrate this optimum we plot the cumulative score varying for a strict threshold model (i.e. high , ) in Fig. 11 B (black curve). Here we see that the maximum cumulative score for this type of decision model is at . This calculation does not take into account shelter space or time pressure, which individuals (blue dots) used in order to get improved scores. The population as a whole had a higher threshold parameter () reflecting the use of this additional information in obtaining higher cumulative scores. Decisions also had a considerable stochastic component for low and , giving more variability in scores.
Investment risk seeking may give higher evacuation thresholds.
To identify potential psychological predictors of individual performance, we tested whether risk scores in the financial domain and health & safety domain were related to individual differences in decision making strategies. We found a significant relationship between and risk score in the investment domain (, ), indicating that individuals with higher decision thresholds tend to have more risk seeking attitudes. We interpret this result with caution due to the possibility of Type II errors in the large number of tests performed (3 risk scores and 3 best fit model parameters = 9 tested correlations). However, a correlation between these two variables is plausible; it suggests that participants who tolerate more financial risk are more likely to wait until the disaster is imminent before evacuating.
Similar decision models can produce different scores.
It is noteworthy that some low and intermediate scoring participants display reduced (binned) decision statistics, and consequently decision model parameters, that are almost identical to those of the highest scoring participants. For example, participants 1 and 36 have very similar decision models but very different scores (2590 and 2270). This result indicates that in some cases similar decision making strategies can produce very different performance outcomes.
Our decision model reduces the data to a single scenario parameter () and therefore fails to capture the other features that are likely to be important in distinguishing between individuals such as timing of the decision. Our data on the population scale suggested that time pressure and shelter capacity are important variables and likely have similar importance on the scale of individuals. By comparing the detailed time evolution of individual runs, we observe instances where higher scoring participants tended to wait longer before evacuating than lower scoring participants, a more successful strategy.
While we are unable to quantify with significance these effects in the current experiment due to limited data, our model provides a tool for estimating the quantity of data needed to robustly quantify these parameters in driving individual decision dynamics.
Discussion
The behavioral network science experiment reported in this paper quantifies several key factors influencing individual evacuation decision making in a controlled laboratory setting. The experiment includes tensions between broadcast and peer-to-peer information, and contrasts the effects of temporal urgency associated with the imminence of the disaster and the effects of limited shelter capacity for evacuees. In this section we summarize our key findings, discuss several methodological considerations, and describe implications for future work.
Predictive, scalable model of collective and individual human decision making
Based on empirical measurements of the cumulative rate of evacuations as a function of the instantaneous disaster likelihood, we developed a quantitative model for decision making that captures remarkably well the main features of observed collective behavior across the 47 disaster scenarios. Moreover, we are able to capture the sensitivity of individual and population level decision behaviors to external pressure on resources (limited shelter capacity) and time (imminence of disaster). Systematic deviations from the model provide meaningful estimates of variability in the collective response. Our analysis uncovers a temporal evolution in individual behavior over the course of the experiment, indicative of increasing attention and swiftness of response, and consistent with the expectation that individuals learn from previous incidents.
Data from the experiment reveal significant heterogeneity in individual decision making patterns captured by significant variation in model parameter fits to participants. The results distinguish between high scoring individuals whose decisions to evacuate are strongly linked to a tight range of disaster likelihoods, versus others who exhibit significantly more variable decision making patterns and did not score as well in the experiment. Both the individuals’ overall success rate in the experiment and the decision making variables that model their behavior are correlated with heterogeneities in individual risk attitudes, as measured by established psychological tests.
These results suggest new directions for numerical modeling. For example, simulation studies that extrapolate decision making strategies identified in small groups to larger collectives could more accurately predict behavior in large scale populations and coalitions. Additionally, simple mathematical models are needed to better understand the tensions and tradeoffs identified in this experiment. Effects of competing broadcast and social information in collective decision dynamics have been investigated previously in a numerical simulation, where individuals were represented by nodes in a network, and obtained information from a broadcast source as well as neighboring sites in the network Bassett et al. (2012). In that case, decision making was modeled as a threshold on an individual state variable representing opinion, and the opinion of each individual was updated based on a stochastic contact rule with the broadcast source (essentially a warning that the disaster was coming) and other individuals (who might or might not have received any information about the disaster). The results presented in this paper suggest important extensions to that model that (1) incorporate different types of information from broadcast and social sources, including an underlying physical process involving likelihood and urgency and (2) directly implement the individual decision model developed in this study rather than assuming the more simplistic update rule employed previously. Our current research is focused on the design of experiments that will better characterize the role of social information and network structure.
Methodological considerations
While no laboratory experiment can fully capture the tensions associated with a true disaster, known factors influencing human risk perception and urgency were accounted for wherever possible in the experimental design. These include both linguistic and visual elements, which are well studied in the psychology and risk literature. Examples include the use and representation of disaster likelihood rather than probability, as well as scores for each scenario represented in terms of a potential loss rather than a payoff for a scenario. Previous studies have shown that humans respond differently to losses than gains Gigerenzer (2002); Chib et al. (2012), and are significantly more accurate in decision making based on data presented as likelihoods than on data presented as probabilities Edwards et al. (2012); D. R. Bach (2012).
The changing likelihood presented to the participants in this study represents the uncertain, and highly variable physical processes that govern the real time approach of natural disasters, such as wildfires or hurricanes Lindell et al. (2006); McCaffrey (2004); Church and Sexton (2002); Regnier (2008a); Huang (2011); Service (2012), and that ultimately result in either a “Hit” or a “Miss” for individual homeowners or communities. The existence of an underlying, quantifiable process for the disaster introduces objective parameters that govern volatility, difficulty, and uncertainty that can be varied in the experiment. Higher volatility, as well as variable time steps, leads to an outcome that is more difficult to predict. Based on the rules of the process, it is possible to calculate the likelihood of the disaster at each time increment (which is the only aspect of the process presented to the participants in this experiment, and it is presented at limited resolution), as well as the optimal evacuation decision (in the absence of shelter capacity limitations) Crews (2012).
The details of this process were deliberately hidden from the participants, who were only presented with the current estimated likelihood of the disaster hitting their community, updated at one second intervals. Our decision to obscure most of the details from the participants was based on observations of realistic disaster event scenarios where the public has access to limited information about the disaster likelihood. The complexities of geophysical events are commonly reduced to highly simplified trajectories and “likelihoods” when presented to the public whether it be the chances of rain, or the chances of a disaster Regnier (2008b).
In any behavioral experiment, it is of interest to compare participants’ actual behavior to optimal behavior from a profit-maximization perspective. In our experiment, the optimal evacuation time depends both on the volatility of the disaster process and on the potentially confounding actions of other participants. While the choice of an underlying stochastic process in principle allows for the calculation of a limiting theoretical optimal decision strategy Crews (2012), our results demonstrate that human behavior departs from optimality at a more primitive level. As previously discussed, even in the simplest cases where an optimal strategy is easily obtained (i.e., where there is no competition for shelter space, and the time of the possible disaster strike is known in advance), the participants still act sub-optimally. This result highlights the critical importance of uncovering predictive models of the suboptimal decision strategies that humans employ in real and laboratory settings.
A framework for quantitative analysis and prediction of human behavior in disasters
In the development and assessment of policy for disaster mitigation and response, human behavioral factors are often the least well quantified, understood, and modeled. Plans for evacuation based on broadcast communication and transportation alone can be rendered ineffective if humans do not act as expected. In retrospective analysis of data from recent events Church and Sexton (2002); Lindell et al. (2006); of Transportation and of Homeland Security (2006); Dash and Gladwin (2007); Huang (2011), prediction and planning for human social factors have been identified as the critical missing link in developing effective strategies to insure safety of the population as a whole. As a result, critical resources are diverted to individual crisis hot spots that might have been avoided with a more effective plan, and in many cases lives are ultimately lost.
These shortcomings motivate our investigations, which represent the initial steps in development of a comprehensive, predictive framework that incorporates human factors in policy and planning for disaster mitigation and response. Success in this area mandates an iterative approach that combines numerical modeling with controlled experiments and retrospective analysis of data collected from actual disasters. Our study uncovered multiple drivers of individual decision making behavior from competing information sources. The social network as a whole provided a source of information on shelter occupancy, inducing a sense of urgency in the population, while the topology of the network surrounding a given individual (i.e., the number of that individual’s neighbors) swayed the time spent engaging the social network. Despite these influences, individual participants spent the majority of their time consuming the broadcast information, and the disaster likelihood was the primary factor influencing decision making strategies in the population as a whole.
The observed tensions between the two sources of information are consistent with empirical observations of human behavior in real disasters. Outside of the laboratory setting, the likelihood of a disaster event is clearly a dominant factor in any decision to evacuate, and individuals spend a great deal of time gathering information from television and other media broadcast sources, even if updates are slow. However, social media and peer-to-peer communication networks are playing an increasingly important role in transmission of early warnings by on-site observers who may communicate observations informally via Twitter and Facebook Dabner (2012) (e.g., news of a 2011 earthquake in the Washington D.C. area propagated faster on social networks than the seismic waves themselves Oswald ; Ball ). Furthermore, in some cases, such as developing countries, widespread access to broadcast networks may not be readily available, necessitating that policy makers rely on social means to communicate information updates. Future experiments will change how participants access information in order to investigate these situations, and elucidate the corresponding effects on behavior.
Additionally, in many (if not most) cases social factors underlie the decisions of individuals who evacuate early or fail to evacuate even when the disaster is upon them Dash and Gladwin (2007); Huang (2011); Drabek (1986). For example, families with small children tend to leave early, while caring for the elderly or reluctance to leave pets behind are often cited as reasons for not evacuating. These factors could be incorporated in future experiments using an explicit payoff structure that rewards collective decisions of neighbors in the social network. Another observed source of variation in evacuations during disasters can be traced to heterogeneities in age, health, isolation, and socioeconomic status within the population. These factors influence speed and access to transportation, as well as potential losses associated with assets at risk. Such sources of variation may be incorporated in our framework by introducing explicit heterogeneity in the loss matrix and in the scenarios accessible to a participant during the InTransit phase.
Finally, our work highlights the role that individuality plays in the decisions of participants and their effect on collective behavior. The distribution of risk tendencies in this experiment might be related to the demographics of the cohort studied here (UCSB undergraduates), and future studies utilizing different participant groups could be used to probe such a relationship. For example, it is reasonable to expect that older and wealthier individuals (e.g., homeowners) might be more risk averse in this domain than undergraduate students. Furthermore, participants who are explicitly trained in risk management and/or operate within different organizational structures (e.g., military officers) might employ different decision making strategies, and a group of such participants might by extension display a quantitatively different collective behavior profile.
Our combined use of a novel experimental paradigm and powerful theoretical modeling techniques to identify and quantitatively characterize individual differences in human decision making strategies in social groups could form a critical bridge to key work in the fields of social neuroscience Behrens et al. (2009) and neuroeconomics Glimcher (2004); Rangel et al. (2008), which seek to describe neurophysiological correlates of social and economic considerations driving human decision making. Indeed, human neuroimaging studies highlight the role of specific brain regions in economic choices and variations in decision strategies Venkatraman et al. (2009); Kolling et al. (2012). Individual differences in these circuits could underlie behavioral decision phenotypes in healthy and diseased clinical populations Chang et al. (2012); Hartley and Phelps (2012). Uncovering neurophysiological predictors of decision dynamics in social groups would have far-reaching implications for disaster preparation and response, marketing, and homeland security.
Development of strategies to mitigate or manage collective evacuation behavior
The ultimate goal of our investigations is development and testing of robust strategies for training and control of evacuations that account for human behavior and network topologies. These objectives may be incorporated within our framework across both broadcast and social channels. Broadcast information may include specific timing for public release of information, including likelihood updates and incentives as well as warnings and mandates for evacuation. In the peer-to-peer communication network, strategies for robust control and potential fragilities of collective behavior may be investigated through insertion of trained “leaders,” who make optimal decisions at different locations in the network, as well as through tracing the propagation of deliberately injected misinformation and poor decisions. Results obtained for these “designed” strategies may be compared to emergent leadership that might arise when the ranking and decisions of other individuals in the network is communicated through the social network, an inherent source of feedback which has been traced to the initiation of cascades in social decision making in a wide range of applications Watts (2002).
Acknowledgments
The authors gratefully acknowledge Michael Kearns and Stephen Judd for providing their behavioral network science experimental framework. The authors would like to thank Mason Porter, Michael Platt, Ali Jadbabaie, Scott Grafton, Leeda Cosmides, John Tooby, Gary Lewis, and Rachel Silvestrini for helpful conversations. Jason Crews and Nada Petrovic made valuable contributions to the early stages of this research. We thank Ann Hermundstad, Jessica Wirts, and Emily Swindle for assistance in experimental setup and procedures. This work was supported by the David and Lucile Packard Foundation, the Office of Naval Research MURI grants N000140810747 and 0001408WR20242, and the Institute for Collaborative Biotechnologies through contract no. W911NF-09-D-0001 from the U.S. Army Research Office.
References
- Oliver et al. (1985) P. Oliver, G. Marwell, and R. Teixeira, American Journal of Sociology 91, 522 (1985).
- Gonz lez-Bail n et al. (2011) S. Gonz lez-Bail n, J. Borge-Holthoefer, A. Rivero, and Y. Moreno, Scientific Reports 1 (2011), 10.1038/srep00197.
- Howard et al. (2011) P. N. Howard, S. D. Agarwal, and M. M. Hussain, The Communication Review 14, 216 (2011).
- Chen (2011) T. M. Chen, Network, IEEE 25, 2 (2011).
- Khondker (2011) H. H. Khondker, Globalizations 8, 675 (2011).
- Lotan et al. (2011) G. Lotan, E. Graeff, M. Ananny, D. Gaffney, I. Pearce, and D. Boyd, International Journal of Communications 5, 1375 (2011).
- Farrell (2012) H. Farrell, Annual Review of Political Science 15, 35 (2012).
- Barnsby (2012) R. E. Barnsby, Social Media and the Arab Spring: How Facebook, Twitter, and Camera Phones Changed the Egyptian Army’s Response to Revolution, Master’s thesis (2012).
- Zhao et al. (2010) J. Zhao, J. Wu, and K. Xu, Phys. Rev. E 82, 016105 (2010).
- Gómez et al. (2013) S. Gómez, A. Díaz-Guilera, J. Gómez-Gardeñes, C. J. Pérez-Vicente, Y. Moreno, and A. Arenas, Phys. Rev. Lett. 110, 028701 (2013).
- Myers et al. (2012) S. A. Myers, C. Zhu, and J. Leskovec, arXiv http://arxiv.org/abs/1206.1331 (2012).
- Guille et al. (2013) A. Guille, H. Hacid, and C. Favre, arXiv http://arxiv.org/abs/1302.5235v2 (2013).
- Shafiq and Liu (2013) M. Z. Shafiq and A. X. Liu, arXiv http://arxiv.org/abs/1302.2376 (2013).
- Baños et al. (2013) R. A. Baños, J. Borge-Holthoefer, and Y. Moreno, arXiv http://arxiv.org/abs/1303.4629 (2013).
- Leskovec et al. (2009) J. Leskovec, L. Backstrom, and J. Kleinberg, Proc 15th ACM SIGKDD Int Conf on Knowledge Discovery and Data Mining , 497 505 (2009).
- Leskovec et al. (2007) J. Leskovec, M. McGlohon, C. Faloutsos, N. Glance, and M. Hurst, Proc. SIAM Int. Conf. on Data Mining , 551 556 (2007).
- Onnela and Reed-Tsochas (2010) J.-P. Onnela and F. Reed-Tsochas, PNAS 107 (2010).
- Bakshy et al. (2011) E. Bakshy, J. Hofman, W. Mason, and D. Watts, Proc. 4th Int. Conf. on Web Search and Data Mining , 65 74 (2011).
- Lerman and Ghosh (2010) K. Lerman and R. Ghosh, in Proceedings of the Fourth International AAAI Conference on Weblogs and Social Media (The Association for the Advancement of Artificial Intelligence, 2010) pp. 90–97.
- Simmons et al. (2011) M. P. Simmons, L. A. Adamic, and E. Adar, Proc. 5th Int. AAAI Conf. on Weblogs and Social Media , 353 360 (2011).
- Watts (2002) D. J. Watts, Proc Natl Acad Sci U S A 99, 5766 (2002).
- Doerr et al. (2012) B. Doerr, M. Fouz, and T. Friedrich, Commun. ACM 55, 70 (2012).
- Zhang et al. (2013) Y. Zhang, S. Zhou, Z. Zhang, J. Guan, and S. Zhou, Phys. Rev. E 87, 032133 (2013).
- Kitsak et al. (2010) M. Kitsak, L. K. Gallos, S. Havlin, F. Liljeros, L. Muchnik, H. E. Stanley, and H. A. Makse, Nature Physics 6, 888 (2010).
- Borge-Holthoefer and Moreno (2012) J. Borge-Holthoefer and Y. Moreno, Phys. Rev. E 85, 026116 (2012).
- Borge-Holthoefer et al. (2012) J. Borge-Holthoefer, A. Rivero, and Y. Moreno, Phys. Rev. E 85, 066123 (2012).
- Centola (2011) D. Centola, Science 334, 1269 (2011).
- Dodds and Watts (2005) P. S. Dodds and D. J. Watts, J Theor Biol 232, 587 604 (2005).
- Bettencourt et al. (2006) L. M. A. Bettencourt, A. Cintron-Arias, D. I. Kaiser, and C. Castillo-Chavez, Physica A 364, 513 (2006).
- Diaz-Aviles et al. (2012) E. Diaz-Aviles, A. Stewart, E. Velasco, K. Denecke, and W. Nejdl, arXiv http://arxiv.org/abs/1203.1378 (2012).
- Li et al. (2013) C. Li, H. Wang, and P. Van Mieghem, arXiv http://arxiv.org/abs/1303.0783 (2013).
- Burt (1987) R. S. Burt, American Journal of Sociology 92, 1287 (1987).
- Melnik et al. (2013) S. Melnik, J. A. Ward, J. P. Gleeson, and M. A. Porter, Chaos 23, 013124 (2013).
- Centola et al. (2007) D. Centola, V. M. Eguíluz, and M. W. Macy, Physica A 374, 449 (2007).
- Centola and Macy (2007) D. Centola and M. Macy, American Journal of Sociology 113, 702 (2007).
- Centola (2010) D. Centola, Science 329, 1194 (2010).
- Bassett et al. (2012) D. Bassett, D. Alderson, and J. Carlson, Physical Review E 86 (2012).
- Barahona et al. (2012) M. Barahona, C. Garc a, P. Gloor, and P. Parraguez, in Proceedings of the 2012 Conference on Collective Intelligence (2012).
- Sano et al. (2013) Y. Sano, K. Yamada, H. Watanabe, H. Takayasu, and M. Takayasu, Phys. Rev. E 87, 012805 (2013).
- Kearns et al. (2006) M. Kearns, S. Suri, and N. Montfort, Science 313, 824 (2006).
- Kearns et al. (2009) M. Kearns, S. Judd, J. Tan, and J. Wortman, Proc Natl Acad Sci U S A 106, 1347 (2009).
- Judd et al. (2010) S. Judd, M. Kearns, and Y. Vorobeychik, Proc Natl Acad Sci U S A 108, 6685 (2010).
- Kearns (2012) M. Kearns, Communications of the ACM 55, 56 (2012).
- Mason and Watts (2012) W. Mason and D. J. Watts, Proceedings of the National Academy of Sciences of the United States of America 109, 764 (2012).
- Nedic et al. (2012) A. Nedic, D. Tomlin, P. Holmes, D. Prentice, and J. D. Cohen, Proceedings of the IEEE 100, 713 (2012).
- Drabek (1986) T. E. Drabek, Human systems responses to disaster: An inventory of sociological findings (Springer, 1986) p. 74.
- Lindell et al. (2006) M. K. Lindell, C. Prater, and R. W. Perry, Emergency Management (Wiley, 2006).
- Dash and Gladwin (2007) N. Dash and H. Gladwin, Natural Hazards Review 8, 69 (2007).
- Sweeney (2008) K. Sweeney, Psychological Bulletin 134, 61 (2008).
- (50) T. Conneally, “Virginia earthquake overloads cell networks from North Carolina to New York, Twitter takes over,” http://betanews.com/2011/08/23/virginia-earthquake-knocks-out-regions-cell-networks/, published: 23 August 2011. Last accessed: 2 January 2012.
- Helbing et al. (2000) D. Helbing, I. Farkas, and T. Vicsek, Nature 407, 487 (2000).
- Helbing (2001) D. Helbing, Reviews of Modern Physics 73, 1067 (2001).
- Banerjee (1992) A. Banerjee, Quarterly Journal of Economics 107, 797 (1992).
- Bosse et al. (2012) T. Bosse, M. Hoogendoorn, M. C. A. Klein, J. Treur, C. N. van derWal, and A. vanWissen, Auton Agent Multi-Agent Syst , 1 (2012).
- Edelson et al. (2011) M. Edelson, T. Sharot, R. J. Dolan, and Y. Dudai, Science 333, 108 (2011).
- Church and Sexton (2002) R. L. Church and R. Sexton, Vehicle Intelligence & Transportation Analysis Laboratory , 1 (2002).
- of Transportation and of Homeland Security (2006) U. D. of Transportation and U. D. of Homeland Security, (2006).
- Huang (2011) L. Huang, FIU Electronic Theses and. Dissertations , 1 (2011).
- Sood et al. (2008) V. Sood, T. Antal, and S. Redner, Physical Review E 77, 041121 (2008).
- Gigerenzer (2002) G. Gigerenzer, Calculated Risks: How To Know When Numbers Deceive You (Simon & Schuster, 2002).
- Chib et al. (2012) V. Chib, B. De Martino, S. Shimojo, and J. O’Doherty, Neuron 74, 582 (2012).
- Edwards et al. (2012) J. Edwards, F. Snyder, P. Allen, K. Makinson, and D. Hamby, Risk Anal. (2012), 10.1111/j.1539-6924.2012.01839.x.
- D. R. Bach (2012) R. J. D. D. R. Bach, Nature Reviews Neuroscience 13, 572 (2012).
- John et al. (2008) O. P. John, L. P. Naumann, and C. J. Soto, in Handbook of personality: Theory and research, edited by O. P. John, R. W. Robins, and L. A. Pervin (Guilford Press, 2008) pp. 114–158.
- John et al. (1991) O. P. John, E. M. Donahue, and R. L. Kentle, “The big five inventory–versions 4a and 54,” Berkeley, CA: University of California,Berkeley, Institute of Personality and Social Research (1991).
- Benet-Martinez and John (1998) V. Benet-Martinez and O. P. John, Journal of Personality and Social Psychology 75, 729 (1998).
- Weber et al. (2002) E. U. Weber, A.-R. Blais, and N. Betz, Journal of Behavioral Decision Making 15, 263 (2002).
- Blais and Weber (2006) A.-R. Blais and E. U. Weber, Judgment and Decision Making 1, 33 (2006).
- Srivastava et al. (2003) S. Srivastava, O. P. John, S. D. Gosling, and J. Potter, Journal of Personality and Social Psychology 84, 1041 (2003).
- Bayati et al. (2010) M. Bayati, J. H. Kim, and A. Saberi, Algorithmica 58, 860 (2010).
- Hagberg et al. (2008) A. A. Hagberg, D. A. Schult, and P. J. Swart, in Proceedings of the 7th Python in Science Conference (SciPy2008) (Pasadena, CA USA, 2008) pp. 11–15.
- Easley and Kleinberg (2010) D. Easley and J. Kleinberg, Networks, Crowds, and Markets: Reasoning About a Highly Connected World (Cambridge University Press, 2010).
- Crews (2012) J. Crews, Determining Optimal Evacuation Decision Policies for Disasters, Master’s thesis, Naval Postgraduate School, Monterey, CA (2012).
- Soane and Chmiel (2005) E. Soane and N. Chmiel, Personality and Individual Differences 38, 1781 (2005).
- Otto and Day (2007) S. P. Otto and T. Day, A Biologist’s Guide to Mathematical Modeling in Ecology and Evolution (Princeton University Press, 2007).
- Shuler and Kargi (2001) M. L. Shuler and F. Kargi, Bioprocess Engineering: Basic Concepts, 2nd ed. (Prentice Hall, 2001).
- Granovetter (1978) M. Granovetter, The American Journal of Sociology 83, 1420 (1978).
- Macy (1991) M. W. Macy, American Sociological Review 56, 730 (1991).
- Bevington and Robinson (2002) P. Bevington and D. K. Robinson, Data Reduction and Error Analysis for the Physical Sciences, 3rd ed. (McGraw-Hill Science/Engineering/Math, 2002).
- Press et al. (1992) W. H. Press, B. P. Flannery, S. A. Teukolsky, and W. T. Vetterling, Numerical Recipes in C: The Art of Scientific Computing, Second Edition, 2nd ed. (Cambridge University Press, 1992).
- Hastie et al. (2009) T. Hastie, R. Tibshirani, and J. Friedman, The elements of statistical learning data mining, inference, and prediction (Springer, New York, 2009).
- McCaffrey (2004) S. McCaffrey, Society and Natural Resources 17, 509 (2004).
- Regnier (2008a) E. Regnier, Management Science 54, 16 28 (2008a).
- Service (2012) N. W. Service, “Sandy graphics archive @ONLINE,” (2012).
- Regnier (2008b) E. Regnier, Management Science 54, 16 (2008b).
- Dabner (2012) N. Dabner, The Internet and Higher Education 15, 69 (2012).
- (87) E. Oswald, “New Yorkers saw DC quake tweets before the ground shook,” http://betanews.com/2011/08/23/new-yorkers-saw-dc-quake-tweets-before-the-ground-shook/, published: 23 August 2011. Last accessed: 2 January 2012.
- (88) D. Ball, “Hurricane, earthquake show utility of social media,” http://www.forbes.com/sites/gyro/2011/08/31/hurricane-earthquake-show-utility-of-social-media/, published: 31 August 2011. Last accessed: 2 January 2012.
- Behrens et al. (2009) T. E. Behrens, L. T. Hunt, and M. F. Rushworth, Science 324, 1160 (2009).
- Glimcher (2004) P. W. Glimcher, Decisions, Uncertainty, and the Brain: The Science of Neuroeconomics (Bradford Books, 2004).
- Rangel et al. (2008) A. Rangel, C. Camerer, and P. R. Montague, Nat Rev Neurosci 9, 545 (2008).
- Venkatraman et al. (2009) V. Venkatraman, J. W. Payne, J. R. Bettman, M. F. Luce, and S. A. Huettel, Neuron 62, 593 (2009).
- Kolling et al. (2012) N. Kolling, T. E. Behrens, R. B. Mars, and M. F. Rushworth, Science 336, 95 (2012).
- Chang et al. (2012) S. W. Chang, D. L. Barack, and M. L. Platt, Biol Psychiatry 72, 101 (2012).
- Hartley and Phelps (2012) C. A. Hartley and E. A. Phelps, Biol Psychiatry 72, 113 (2012).