The Lick AGN Monitoring Project 2011: Fe II Reverberation from the Outer Broad-Line Region
Abstract
The prominent broad Fe II emission blends in the spectra of active galactic nuclei have been shown to vary in response to continuum variations, but past attempts to measure the reverberation lag time of the optical Fe II lines have met with only limited success. Here we report the detection of Fe II reverberation in two Seyfert 1 galaxies, NGC 4593 and Mrk 1511, based on data from a program carried out at Lick Observatory in Spring 2011. Light curves for emission lines including H and Fe II were measured by applying a fitting routine to decompose the spectra into several continuum and emission-line components, and we use cross-correlation techniques to determine the reverberation lags of the emission lines relative to -band light curves. In both cases the measured lag () of Fe II is longer than that of H, although the inferred lags are somewhat sensitive to the choice of Fe II template used in the fit. For spectral decompositions done using the Fe II template of Véron-Cetty et al. (2004), we find (Fe II)/(H) in NGC 4593 and in Mrk 1511. The detection of highly correlated variations between Fe II and continuum emission demonstrates that the Fe II emission in these galaxies originates in photoionized gas, located predominantly in the outer portion of the broad-line region.
Subject headings:
galaxies: active — galaxies: individual (NGC 4593, Mrk 1511) — galaxies: nuclei1. Introduction
Blends of Fe II emission lines are often among the most prominent broad emission features in the ultraviolet (UV) and optical spectra of broad-lined active galactic nuclei (AGNs), and the integrated flux of Fe II emission in quasars can be greater than that of any other single emission line, including Ly (Wills et al., 1985). Despite more than three decades of observational and theoretical effort, the physical conditions that give rise to Fe II emission have remained very difficult to determine. This is due in part to the complex energy-level structure of the Fe+ ion and the very large number of individual Fe II emission lines that appear in broad blends. Recent spectral synthesis models for the Fe+ ion include hundreds of energy levels and tens of thousands of individual transitions (Verner et al., 1999; Sigut & Pradhan, 2003). A variety of processes in the broad-line region (BLR) can contribute to Fe II line production, including collisional excitation as well as continuum and line fluorescence (Phillips, 1978b; Netzer & Wills, 1983; Collin-Souffrin et al., 1980). It is not yet fully determined whether the Fe II production in AGNs occurs in gas heated solely by photoionization, or whether collisional ionization might play a significant or even dominant role (Collin & Joly, 2000; Baldwin et al., 2004). A particularly promising recent development has been the realization that anisotropy in the emission from high column density clouds can have a strong impact on the observed Fe II spectrum, and models for the emission from the shielded side of photoionized clouds have shown significant improvements in fitting observed Fe II spectra (Ferland et al., 2009).
The Fe II emission lines are closely linked to several fundamental issues in AGN physics and phenomenology. From principal-component analysis of quasar spectra, the relative strength of Fe II emission is one of the major characteristics of “Eigenvector 1” (Boroson & Green, 1992), the component which accounts for much of the variance among the quasar population. Empirically, Eigenvector 1 represents the anticorrelations between Fe II and [O III] equivalent widths, and between Fe II strength and H width. The fundamental physical driver of the Eigenvector 1 sequence is the Eddington ratio (Sulentic et al., 2000; Boroson, 2002), but the physical mechanism responsible for the increase in Fe II strength with Eddington ratio is not fully understood. It may be linked to the presence of a soft X-ray excess at high Eddington ratio, which would produce a larger partially ionized zone of warm, Fe II-emitting gas (e.g., Marziani et al., 2001; Boroson, 2002), while orientation could play a secondary role (Marziani et al., 2001). Shields et al. (2010) argue against the X-ray excess as the primary driver of Fe II strength, proposing instead that differences in gas-phase iron abundance, driven by selective depletion of iron onto grains, are primarily responsible for the wide range of observed Fe II line strengths in AGNs. In another interpretation proposed by Ferland et al. (2009) and Dong et al. (2011), the competing forces of gravity and radiation pressure set a critical column density for clouds to remain gravitationally bound within the BLR, and at higher Eddington ratio, the higher column density of surviving BLR clouds would produce a larger Fe II/H flux ratio. For AGNs having extremely strong Fe II emission, it has also been suggested that the shock-heated gas associated with circumnuclear star formation may be responsible for the Fe II enhancement (Lipari et al., 1993).
Furthermore, Fe II emission is potentially valuable as a tracer of chemical evolution. The strength of the UV Fe II emission relative to Mg II in quasar spectra has been used as a proxy for the iron to -element abundance ratio in the BLR (e.g., Yoshii et al., 1998; Dietrich et al., 2002; Kurk et al., 2007; Jiang et al., 2007), although the sensitivity of Fe II/Mg II line ratios to factors such as gas density and microturbulence means that observed line ratios are not straightforward indicators of the underlying abundance ratios (Verner et al., 2003; Baldwin et al., 2004; Bruhweiler & Verner, 2008). Improved understanding of the physical conditions responsible for Fe II emission could have important ramifications for elucidating the history of metal enrichment in the densest regions of the Universe at high redshift.
A key quantity of interest is the spatial scale of the Fe II-emitting region. However, there are very few measurements available that directly constrain its size. Maoz et al. (1993) carried out reverberation mapping of the UV Fe II lines in NGC 5548 and found a lag of about 10 days, similar to that of Ly, indicating that the UV Fe II lines originate from within the BLR. This has been the only measurement of a reverberation lag for the UV Fe II lines to date. Aside from reverberation mapping, one additional direct constraint exists: a spectroscopic microlensing study of a lensed quasar by Sluse et al. (2007) found evidence that the Fe II emission originates largely in the outer portion of the BLR.
Previous attempts at reverberation mapping of the optical Fe II blends have generally not led to clear detections of reverberation lags. For the well-studied AGN NGC 5548, Vestergaard & Peterson (2005) examined 13 years of monitoring data and found that the Fe II flux responded to continuum changes on timescales of less than several weeks, but the available data did not allow for a definite measurement of the lag. Kuehn et al. (2008) measured light curves for the Fe II blends in Ark 120 and found a long-term variability trend that followed the continuum changes, but the data did not yield a significant cross-correlation lag. They concluded that the Fe II emission region in Ark 120 was likely to be several times larger than the H-emitting zone of the BLR. An alternative possibility was that the Fe II emission might be powered by collisional excitation rather than by photoionization, although they were unable to fit the Fe II emission blends well with collisional excitation models. Bian et al. (2010) measured the Fe II light curve for PG 1700+518 using monitoring data from Kaspi et al. (2000). While they were able to detect evidence of reverberation in the Fe II lines, the cross-correlation analysis did not yield a highly significant peak, and the measured lag of days was very uncertain. Variability of the optical Fe II emission has been examined in other AGNs (e.g., Giannuzzo & Stirpe, 1996; Doroshenko et al., 1999; Kollatschny et al., 2000; Wang et al., 2005; Shapovalova et al., 2012), but most datasets have not been suitable for measurement of reverberation lags. The overall picture that emerges from these studies is that while optical Fe II emission does respond to continuum variations at least over long timescales, it tends to have a lower amplitude of variability than H, and it does not generally show a clear reverberation lag signature.
In the absence of direct constraints on the relative sizes of the Fe II and H emission regions, indirect clues have come from line-profile measurements. Phillips (1978a) and Boroson & Green (1992) found that the velocity widths of the Fe II lines are generally similar to that of H, suggesting that Fe II and H originate from the same region within the BLR. Subsequent work has uncovered subtle systematic differences between H and optical Fe II widths, which hint at an origin for Fe II in the outer portion of the BLR or perhaps within an “intermediate-line region” corresponding to the transition between the BLR and the dusty torus (Marziani et al., 2003; Popović et al., 2004; Hu et al., 2008b; Kovačević et al., 2010). For a sample of 4000 Sloan Digital Sky Survey (SDSS) quasar spectra, Hu et al. (2008b) found that the full-width at half maximum intensity (FWHM) of the optical Fe II lines is typically about FWHM(H), albeit with substantial scatter, implying a size for the Fe II-emitting region that is typically about twice as large as the H-emitting zone of the BLR.
Here, we present new Fe II reverberation-mapping results for two nearby Seyfert galaxies, NGC 4593 and Mrk 1511, from the Lick AGN Monitoring Project 2011. Section 2 gives a brief overview of our observing campaign. Section 3 describes the fitting method used to isolate the continuum and emission-line components in the spectroscopic data and the measurement of light curves. In Section 4 we describe the cross-correlation lag measurements and the dependence of the lags on the choice of Fe II template, and Section 5 presents a discussion of the results. In an Appendix, we present a brief discussion of results based on additional newly-available Fe II templates. While the reverberation lag measurements are modestly sensitive to the choice of Fe II template, both of these objects clearly show evidence of Fe II reverberation in response to continuum variations.
2. Observations and Reductions
Initial results from the Lick AGN Monitoring Project 2011 were previously presented by Barth et al. (2011b) and Pancoast et al. (2012), and full details of the spectroscopic and photometric observing campaigns, analysis procedures, and light-curve data for all targets will be presented in a forthcoming series of papers. Here, we briefly review the key aspects of the observing program.

2.1. Photometry
From early March through mid-June 2011, we obtained queue-scheduled -band images of NGC 4593 and Mrk 1511 using the 0.76 m Katzman Automatic Imaging Telescope (KAIT) at Lick Observatory (Filippenko et al., 2001), the 0.9 m telescope at the Brigham Young West Mountain Observatory (WMO), the Faulkes Telescope South at Siding Spring Observatory, and the Palomar 1.5 m telescope (Cenko et al., 2006). Our goal was to obtain nightly imaging for each target, but weather and scheduling issues led to some gaps in coverage, particularly during the initial portion of the campaign. The temporal sampling cadence of our observations is described in Table 1. Exposure times were typically 180–300 s. All images were bias-subtracted and flattened, and cosmic-ray hits were removed using the LA-COSMIC routine (van Dokkum, 2001).
Image-subtraction photometry was carried out using a version of the ISIS code (Alard & Lupton, 1998) modified by the High- Supernova Search Team (Tonry et al., 2003) and with additional modifications by W. Li, and also using the HOTPANTS package by A. Becker111http://www.astro.washington.edu/users/becker/c_software.html, which is based on the methods described by Alard (2000). For each telescope, a high-quality template image was chosen, and the template was then aligned with each night’s image and convolved with a spatially varying kernel to match the point-spread function of that image. After subtracting the scaled template image, the variable AGN flux is left as a point source in the subtracted image, allowing for aperture photometry using the IRAF222IRAF is distributed by the National Optical Astronomy Observatories, which are operated by the Association of Universities for Research in Astronomy, Inc., under cooperative agreement with the National Science Foundation (NSF). DAOPHOT package. The photometric aperture radius used for each telescope was set to match the average point-source FWHM for images from that telescope.
| Dataset | (days) | (days) | |
|---|---|---|---|
| NGC 4593 Photometry | 75 | 0.95 | 1.12 |
| NGC 4593 Photometry (Averaged) | 57 | 1.01 | 1.48 |
| NGC 4593 Spectroscopy | 43 | 1.02 | 1.81 |
| Mrk 1511 Photometry | 71 | 1.00 | 1.51 |
| Mrk 1511 Photometry (Averaged) | 59 | 1.05 | 1.82 |
| Mrk 1511 Spectroscopy | 40 | 1.01 | 1.94 |
Note. — is the number of observations in each light curve, and and give the sampling cadences, defined as the median and mean separation between adjacent data points in each light curve. Photometric light curves were condensed by taking a weighted average of any observations separated by less than 6 hours.
Light curves were initially constructed separately with the data from each telescope, and then combined together to assemble a single light curve for each AGN. Normalization was done by modeling the variability using Gaussian processes to obtain a finely-sampled model version of the light curve for each AGN, following the same procedure described by Pancoast et al. (2011). Additive and multiplicative scaling factors were applied to match the modeled light curve to each telescope light curve, using the WMO light curve as the reference data for the model. The normalization code simultaneously constrained all scaling factors to obtain the best fit between all the telescope light curves using a Markov Chain Monte Carlo algorithm. Then, scaling factors determined from the modeling were applied to the image-subtraction light curves, to normalize the data from all telescopes to a common flux scale. The final light curve was prepared by taking a weighted average of observations taken within 6 hours of one another. The -band light curves are shown in Figure 1, in arbitrary units of differential flux.
2.2. Spectroscopy

Our Spring 2011 observing campaign consisted of 69 nights at the Lick 3-m telescope between 2011 March 27 and June 13 UT. Observations were done using the Kast dual spectrograph (Miller & Stone, 1993). A D55 dichroic was used to separate the blue and red beams with a crossover wavelength of about 5500 Å. In this paper, we discuss only measurements from the blue arm of the spectrograph, where we used a 600 lines mm-1 grism over –5520 Å at a scale of 1.0 Å pixel-1. All observations of these two AGNs were done with a 4″-wide slit oriented at a position angle of 45°. Standard calibration frames including arc lamps and dome flats were obtained each afternoon, and flux standards were observed during twilight. Exposure times were normally s and s for NGC 4593 and Mrk 1511, respectively. The weather at Mt. Hamilton was somewhat worse than average during Spring 2011; we were able to observe NGC 4593 on 43 of the 69 nights, and Mrk 1511 on 40 nights.
Spectroscopic reductions and calibrations followed standard methods implemented in IRAF and IDL. A large extraction width of 103 was used in order to accommodate the full extent of the AGN spatial profiles observed on nights with poor seeing. Error spectra were extracted and propagated through the full sequence of calibrations. In the reduced spectra, the median signal-to-noise ratio (S/N) per pixel in the range 4600–4700 Å is 122 for NGC 4593 and 71 for Mrk 1511.
3. Spectroscopic Data Analysis
3.1. Spectral Fitting Method
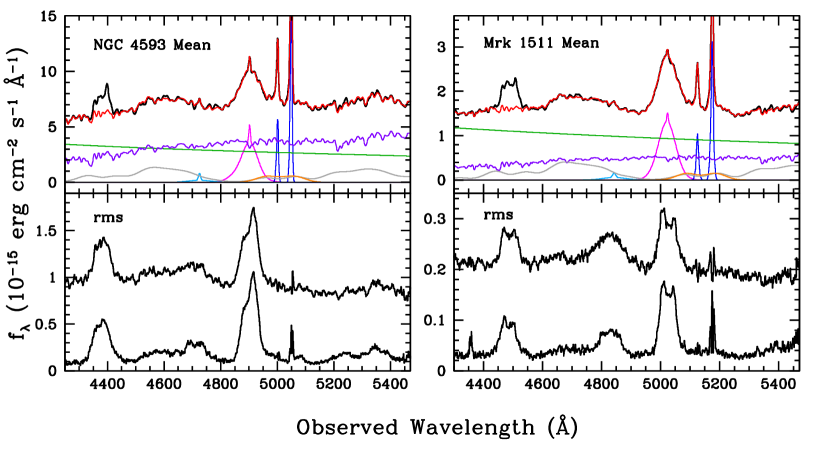
The reduced spectra were first normalized to a uniform flux scale by employing the procedure of van Groningen & Wanders (1992). This method applies a flux scaling factor, a linear wavelength shift, and a Gaussian convolution to each spectrum in order to minimize the residuals between the data and a reference spectrum constructed from several of the best-quality nights. The scaling is determined using a wavelength range containing the [O III] line, which is assumed to have constant flux. The upper panels of Figure 2 show the mean of all scaled spectra for each object.
To assess the accuracy of the scaling procedure, we measured the light curve of the [O III] line in the scaled spectra and calculated the residual “excess” scatter in the [O III] light curve. We follow the usual definition for the normalized excess variance (Nandra et al., 1997):
| (1) |
where is the total number of observations, is the mean flux, and and are the individual flux values and their uncertainties. Then gives a measure of the fractional scatter in the light curve due to random errors in flux scaling, over and above the scatter that would be expected based on the propagated photon-counting uncertainties. For NGC 4593 and Mrk 1511, we obtain an excess scatter of and 2.0%, respectively. These low values indicate that the scaling procedure worked well. As we describe below, these measures of residual scatter will be added to the error budget of the emission-line light curves to give a more realistic estimate of the total uncertainties.
Traditionally, broad emission-line fluxes in reverberation-mapping data have been measured by choosing continuum regions on either side of an emission line, fitting a line to the continuum, and integrating the flux above that line (e.g., Kaspi et al., 2000). However, in AGN spectra there may be no pure continuum regions at all surrounding H, because Fe II, He II, and other emission features are present. Choosing continuum regions that contain some emission-line flux could potentially bias a reverberation lag measurement, particularly for velocity-resolved reverberation signals in the faint high-velocity wings of H. An alternative approach is based on decomposition of spectra into continuum and emission-line components, so that the flux contributions of individual emission features can be isolated. Our multi-component fitting method was previously applied to Mrk 50 (Barth et al., 2011b) and is similar to the method used by Park et al. (2012). We carry out fits over the wavelength range extending from just blueward of the H line ( Å) up to 5470 Å near the dichroic cutoff. Over this wavelength range, each nightly spectrum was fit with a model consisting of several components: a power-law featureless continuum (FC), a starlight template broadened in velocity by convolution with a Gaussian, emission lines including H, [O III] , He II , and three He I lines (4471, 4922, and 5016 Å), and an Fe II template broadened in velocity by convolution with a Gaussian.
For the starlight template, we use an 11 Gyr-old simple stellar population model at solar metallicity from Bruzual & Charlot (2003). We experimented with adding younger stellar population components, but the 11 Gyr model provided a sufficiently good fit that more complex stellar population models are not warranted, and the flux of a young population component is usually not very well constrained over this limited wavelength range.
We used two different templates to model the Fe II lines, from Boroson & Green (1992; hereinafter BG92), and Véron-Cetty et al. (2004; hereinafter V04). The overall quality of the fits is very similar with the two Fe II templates, but there are some subtle differences that affect the reverberation lag measurements. We find that the V04 template produces better results than the BG92 template (see Section 4.4), but we describe measurements and reverberation lags derived from both sets of spectral fits in order to illustrate the dependence of the results on the choice of Fe II template.
The broad component of H, as well as the [O III] lines, are represented by fourth-order Gauss-Hermite functions, while Gaussians were used to represent weaker features including narrow H, the broad and narrow components of He II, and the He I lines. We found that the complex shape of the H+[O III] blend was difficult to model, and instead of adding more model components we simply set the wavelength range subtended by this feature to have zero weight in the fit (4280–4395 Å rest wavelength). Additionally, a uniform foreground extinction was applied to the model spectrum using the Cardelli et al. (1989) reddening law. This extinction correction represents the combined effects of Galactic foreground extinction, extinction within the AGN host galaxy, and wavelength-dependent slit losses resulting from the nonparallactic slit orientation (Filippenko, 1982). Since these slit losses differ from night to night, we allowed the value of to vary freely in each fit.
The full model includes 29 free parameters, and was fitted to the observed spectrum by minimization using a Levenberg-Marquardt technique (Markwardt, 2009). For each galaxy, the fit was first carried out on the high-S/N mean spectrum, and then the parameters from the best fit to the mean spectrum were used as starting parameter estimates for the fit to each nightly spectrum.
For both objects, the fit optimization always drove the flux of He I to zero, using either Fe II template. However, inclusion of the other He I lines at 4922 and 5016 Å does significantly improve the fit quality compared to model fits that omit these lines, at least when using the V04 template. Previous work has shown that these two He I lines can be important contributors to the “red-shelf” region redward of H (Véron et al., 2002). The red shelf also contains some Fe II emission (Korista, 1992) and the I Zw 1 templates contain some Fe II flux in this region. However, the relative amount differs between the BG92 and V04 templates, such that the V04 template has relatively weaker Fe II emission in the H red shelf, and this leads to noticeably different fitting results for the two templates. Using the V04 template, we found that the Fe II template alone did not produce an adequate fit to the red shelf unless the He I lines were added as separate components. When fits are carried out using the BG92 Fe II template instead, the fluxes of the He I components in the H red shelf region go to zero or nearly zero, and essentially all of the flux in the H red shelf is taken up by the Fe II template.
Another difficulty in fitting this region is that the He I line is degenerate with the red wing of H; in order to achieve a consistent deblending of this spectral region into H and He I flux, we constrained the 4922 Å and 5016 Å lines to have identical fluxes (following Vestergaard & Peterson, 2005) and identical velocity widths. In the fits, these two components essentially track the same shape as two broad bumps in the broadened Fe II templates. Due to the degeneracy between the several features contributing to the H red shelf, we are unable to determine a physically unique decomposition of this region into separate contributions from H, Fe II, He I, and [O III]. The fits are able to match the observed spectra well in this region using either Fe II template, but the slight differences in the red shelf decompositions may be partly responsible for the dependence of the reverberation lags on the choice of template.
The strength and broadening of the Fe II component in the fit are primarily determined by the prominent blend around –4700 Å containing several transitions from Fe II multiplets 37 and 38. The velocity-broadening width of Fe II was allowed to vary independently to optimize the fit to each nightly spectrum, but the variation from night to night was relatively small. From the best fit to each night’s data using the V04 template, the median velocity broadening (i.e., the dispersion of the Gaussian broadening kernel) applied to the Fe II template is km s-1 for NGC 4593 and km s-1 for Mrk 1511. The V04 template itself was constructed using Lorentzian profiles for each line, with a width of FWHM = 1100 km s-1 to match the line profiles in I Zw 1 (Véron-Cetty et al., 2004). We find a similarly small night-to-night scatter in the width of the Fe II broadening kernel when using the BG92 template ( km s-1), although the overall amount of broadening is substantially smaller due to the different template structure.
The BG92 template is characterized by an intrinsic FWHM900 km s-1 (e.g., Hu et al., 2008b), but as an empirically-derived template it contains features with a range of widths, and shapes that do not correspond precisely to simple Gaussian or Lorentzian profiles. As a result, it is not straightforward to compare the inferred Fe II widths as measured using the two different templates, but for each template the fitting procedure consistently converges on a value for the Fe II broadening that varies only by a few percent from night to night. We comment further on the Fe II profile widths in Section 5.
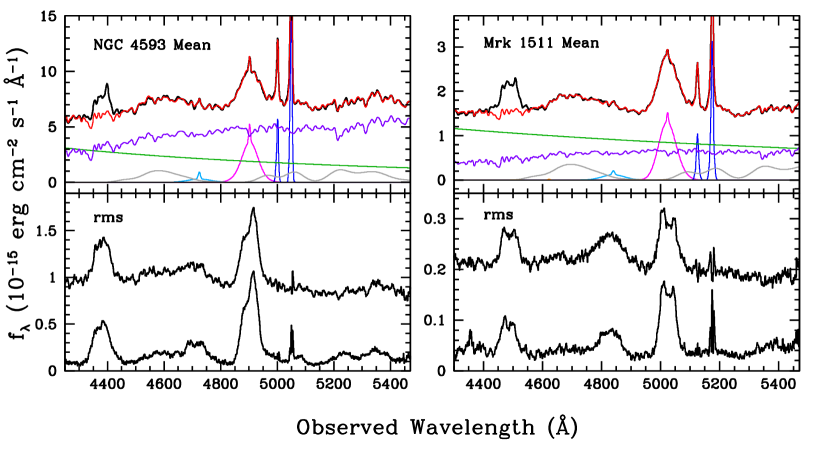
Figures 2 and 3 show the mean spectrum for each AGN with its best-fitting model, and the individual fit components, for the fits done using the V04 and BG92 Fe II templates. The root-mean-square (rms) spectrum is constructed by taking the standard deviation of the scaled spectra (e.g., Kaspi et al., 2000). In each of these figures we show the rms spectrum, as well as a modified version constructed by subtracting the AGN FC and stellar-continuum components from each nightly spectrum before calculating the rms. Removing the continuum components gives an improved rms spectrum by eliminating small residual stellar absorption-line features (Park et al., 2012), and the continuum-subtracted rms spectrum more accurately depicts the rms variability profiles of the emission lines. Fits done using the BG92 template assign relatively more flux to Fe II than fits with the V04 template. For the BG92 fits, the increased Fe II flux (at the expense of the FC component) results in a higher rms flux in the continuum-subtracted rms spectra.
3.2. Light-Curve Measurements
Light curves were measured for individual emission lines from continuum-subtracted spectra. For H and the H+[O III] blend, we produced a residual spectrum by subtracting all other model components, and then measured the emission-line light curves by summation of the residual flux. The H and H integration regions were 4320–4450 Å and 4800–5000 Å for NGC 4593, and 4420–4560 Å and 4920–5120 Å for Mrk 1511 (in the observed frame). The resulting light curves include the constant contributions of narrow H and H as well as [O III] blended with H.
Light curves for He II were measured by summation of the best-fitting broad and narrow He II model components. This produced a less noisy light curve than the alternate approach of calculating a He II residual spectrum for each night by subtracting all of the other model components. However, for NGC 4593 the He II emission was too weak to produce a useful light curve. The Fe II light curves were computed by summation of the best-fitting Fe II model over 4400–4900 Å, but any wavelength range would yield the same overall light-curve shape since the model fit assumes a uniform flux scaling factor for the Fe II template. The FC light curves were measured by integration over the same wavelength range used for Fe II.
As described above, the residual scatter measured from the [O III] light curves represents a major contribution to the error budget in the light-curve measurements. Therefore, we combine the residual scatter (1.2% for NGC 4593 and 2.0% for Mrk 1511) in quadrature with the measurement uncertainties in the individual light-curve points to obtain a more realistic estimate of the true overall uncertainties. The emission-line light curves displayed in Figure 1 are shown with these expanded error bars. Addition of the residual flux-scaling scatter to the error budget widens the measurement uncertainties in the cross-correlation lags described below, but only slightly. In Figure 1 we show only the spectroscopic light curves measured using the V04 template fits because the light curves measured from the BG92 fits are extremely similar in overall appearance.
Observations of other AGNs have shown that the amplitude of Fe II variability is typically somewhat smaller than that of H. For example, in NGC 5548 Vestergaard & Peterson (2005) found that the Fe II variation amplitude was %–75% of that of H. To characterize the variability amplitude in NGC 4593 and Mrk 1511, we use as defined in Equation 1, which gives a measure of the normalized rms variability, corrected for measurement uncertainties. Based on the V04 fits, the results for NGC 4593 are (H) and (Fe II), while for Mrk 1511 we measure (H) and (Fe II). With the BG92 template fits, the values for H are essentially unchanged, while (Fe II) increases by relative to the values determined from the V04 fits. Thus, both objects show a somewhat higher amplitude of variability in H than Fe II, similar to the behavior seen in NGC 5548 (Vestergaard & Peterson, 2005).
For AGNs having a very low starlight fraction, it is often possible to measure the AGN continuum flux from the spectra directly, without carrying out a decomposition to separate the AGN flux from the host galaxy contribution (e.g., Kaspi et al., 2000). However, this approach is much less successful for AGNs having a substantial host galaxy component in the spectra, since the starlight dilutes the variability of the AGN continuum and introduces additional random noise due to nightly variations in seeing and target centering within the slit (e.g., Bentz et al., 2008). Given the substantial contributions of both stellar continuum and Fe II in these two objects, the spectral decomposition method is necessary in order to measure the AGN continuum flux without contamination or dilution by these other components.
4. Measurement of Reverberation Lags
4.1. Methods
In order to measure the cross-correlation function (CCF) for unevenly sampled time series, we employ the interpolation cross-correlation function (ICCF) methodology and Monte Carlo error-analysis techniques described by Gaskell & Peterson (1987), White & Peterson (1994), and Peterson et al. (2004). Emission-line lags for H, H, He II, and Fe II were measured relative to both the -band and FC light curves. CCFs were computed over a temporal range of to days in increments of 0.25 days. For each CCF we compute two measures of the lag time: , which is the lag at the peak of the CCF, and , the centroid of the CCF for all points above 80% of the peak value (Peterson et al., 2004). Table 2 lists the lag values. The quantity listed in Table 2 gives the peak amplitude of the CCF and is a measure of the significance of the correlation between the two light curves. We obtain higher values for NGC 4593 than for Mrk 1511, primarily owing to the higher S/N of the NGC 4593 light curves. Lag values are given in the observed frame and can be converted to the AGN rest frame by dividing by , where the redshifts are for NGC 4593 and for Mrk 1511.
There are advantages and drawbacks to using either the -band data or spectroscopic FC light curves in the cross-correlation analysis. The -band light curves have more frequent sampling than the spectroscopic data, and better temporal sampling will always improve the determination of the CCF. Additionally, the spectroscopic data suffer from systematic effects including variable slit losses due to miscentering and differential atmospheric refraction, while the photometric data are not susceptible to these problems. However, the -band data include contributions of emission-line flux in addition to the AGN continuum, while the spectroscopic decompositions can be used to produce a “pure” FC light curve without contamination by strong emission lines. A disadvantage of using the spectroscopic data in cross-correlation measurements is the effect of correlated flux-calibration errors between the emission-line and continuum light curves, which can introduce a spurious signal at zero lag. We find that using the -band light curves produces consistently higher-quality results, but the reverberation lags are consistent when measured against either the band or FC light curves. For completeness, Table 2 presents all of the lag measurements based on the spectral decompositions using both the V04 and BG92 Fe II templates, and for cross-correlations computed with both the -band and FC light curves.
We tested the effect of detrending the data by subtracting a linear fit to the light curves before computing the CCFs. As described by Welsh (1999), removing long-term secular variations from light curves can often improve the accuracy and significance of cross-correlation results. For Mrk 1511, detrending had almost no effect on the CCFs, because the light curves are not characterized by any long-term brightening or fading. NGC 4593 does show a net increase in luminosity over the duration of our monitoring program, but CCFs computed using detrended data were actually of poorer quality than the original CCFs, having values of that were lower by . Therefore, we chose not to use detrended light curves for our final measurements.
4.2. Reverberation lag results
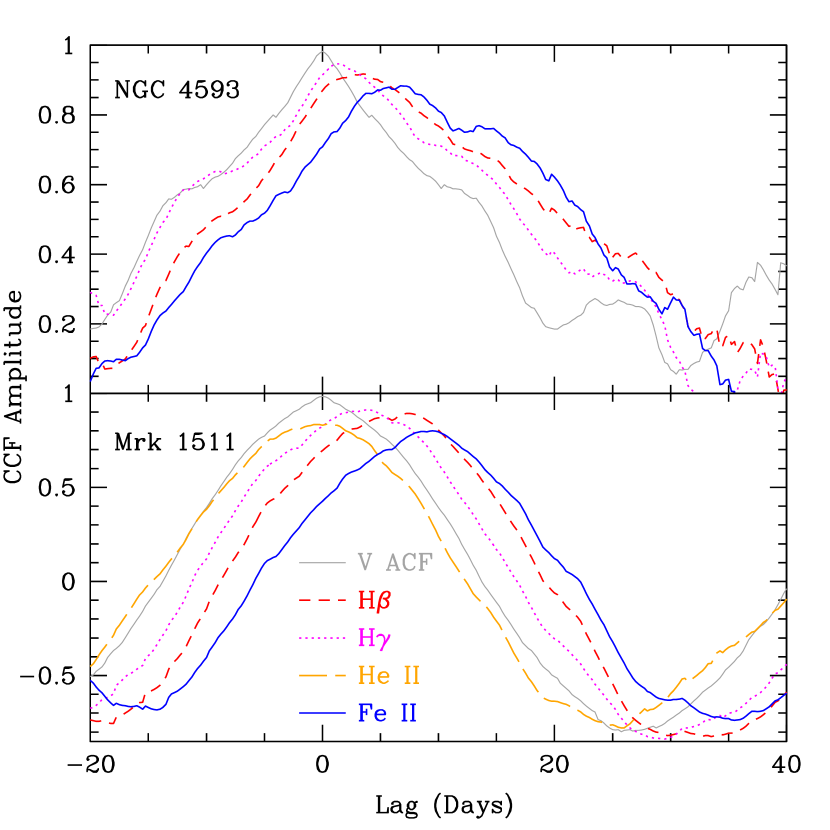
We first describe the results based on light curves measured from the V04 template fits. Comparison with BG92 template fits is presented in Section 4.4. Figure 4 illustrates the CCFs measured relative to the -band data for emission-line light curves measured from the V04 template fits, as well as the autocorrelation function (ACF) of the -band light curve. For both AGNs the Fe II CCF has a shape roughly similar to that of the H CCF, but systematically shifted toward longer lags.
| Measurement | (days) | (days) | (days) | (days) | ||
|---|---|---|---|---|---|---|
| V04 Template Fits | BG92 Template Fits | |||||
| NGC 4593: | ||||||
| H vs. | 0.95 | 0.94 | ||||
| H vs. FC | 0.94 | 0.80 | ||||
| H vs. | 0.92 | 0.94 | ||||
| H vs. FC | 0.92 | 0.82 | ||||
| Fe II vs. | 0.88 | 0.85 | ||||
| Fe II vs. FC | 0.85 | 0.82 | ||||
| Mrk 1511: | ||||||
| He II vs. | 0.84 | 0.83 | ||||
| He II vs. FC | 0.81 | 0.79 | ||||
| H vs. | 0.91 | 0.91 | ||||
| H vs. FC | 0.83 | 0.80 | ||||
| H vs. | 0.89 | 0.88 | ||||
| H vs. FC | 0.82 | 0.81 | ||||
| Fe II vs. | 0.80 | 0.81 | ||||
| Fe II vs. FC | 0.75 | 0.73 | ||||
Note. — All lags are given in the observed frame. Lag values measured from cross-correlations between two spectroscopic light curves (i.e., between emission lines and FC, or between two emission lines) are unreliable as a result of correlated errors, which introduce a spurious signal at zero lag. This bias particularly affects the values. Cross-correlations measured relative to the -band light curve are not susceptible to this bias. As described in the text, we conclude that the cross-correlations done relative to the -band light curves, done using the V04 template fits, are the most reliable.
Normally, the ICCF method computes two versions of the CCF: first by interpolating the continuum light curve (shifted by each trial value of the lag) to the temporal steps of the emission-line light curve, and then by interpolating the emission-line light curve to the time sampling of the continuum light curve. With high-quality data, the two resulting CCFs are normally very nearly identical, and the final CCF is taken to be the mean of the two (Gaskell & Peterson, 1987). However, when the two light curves have significantly different temporal sampling frequency, or when the light curves have poor S/N, the two interpolated CCFs can sometimes differ significantly in shape, and occasionally one of the two CCFs may contain features that are clearly spurious while the other has a more regular appearance. In such a situation it may be preferable to use just one of the two interpolated CCFs rather than taking their mean. For NGC 4593, the two interpolated CCFs are nearly identical, and we base our measurements on the mean CCFs as illustrated in Figure 4. However, for Mrk 1511, we found that the second version of the CCF (i.e., from interpolating the Fe II light curve to the time steps of the band) had a large and unphysical “notch” appearing just at the CCF peak. The other interpolation produced a smooth and regular CCF. Overall the two interpolated CCFs had nearly identical shapes and widths, and they show the same overall lag response aside from the notch appearing at the peak of the first CCF. The presence of this notch in the mean CCF rendered the measurement of and suspect. Since the first interpolated CCF results in a smoothly shaped peak, for Mrk 1511 we use only the first interpolated version of the CCF to calculate and , rather than taking the mean of the two interpolations. This CCF is shown in Figure 4.333For Mrk 1511, if we use the mean of the two interpolated forms of the CCF instead of the first interpolated version, we obtain days. This is consistent with the value listed in Table 2 but with a larger uncertainty due to the peculiar shape of the peak region of the mean CCF. The value of (H) is nearly unchanged if we use the mean CCF instead of the first interpolated version.
The H lags measured relative to the -band light curves are in the range of –4 days for NGC 4593 and –7 days for Mrk 1511. Due to asymmetry in the CCFs, the values of and differ slightly, but not by a significant amount considering the uncertainties in the lag measurements. The observed trend of H having a longer lag than H is expected based on previous measurements (e.g., Bentz et al., 2010a). Similarly, the fact that the He II lag is unresolved in Mrk 1511 is consistent with expectations based on previous measurements. In AGNs having H lags of days, the He II lag time is usually undetectable in datasets with nightly sampling (e.g., Bentz et al., 2010a; Barth et al., 2011b). The Fe II emission has a longer lag than H for both AGNs. In both cases the cross-correlation between the Fe II and -band light curves produces a significant CCF peak, with for NGC 4593 and 0.80 for Mrk 1511.
We also measured the emission-line lags relative to the AGN FC component light curves. The resulting and values are generally consistent, within the uncertainties, with the lag values measured against the -band data. However, the CCFs measured using the FC light curves have lower peak amplitude than the corresponding CCFs measured against the band, which we attribute to the poorer temporal sampling and greater calibration uncertainties of the spectroscopic data. Thus, we consider measurements relative to the band to be the best determinations of the emission-line lags, while the lags measured relative to the FC serve as a useful consistency check. As another check, we measured the FC light curves over a different wavelength range (5050–5150 Å rest wavelength) and measured the cross-correlations of the H light curves relative to this revised FC light curve. The measured lags only changed by a negligible amount (much smaller than the 1 uncertainties) in comparison with the lags measured to the FC light curves as listed in Table 2.
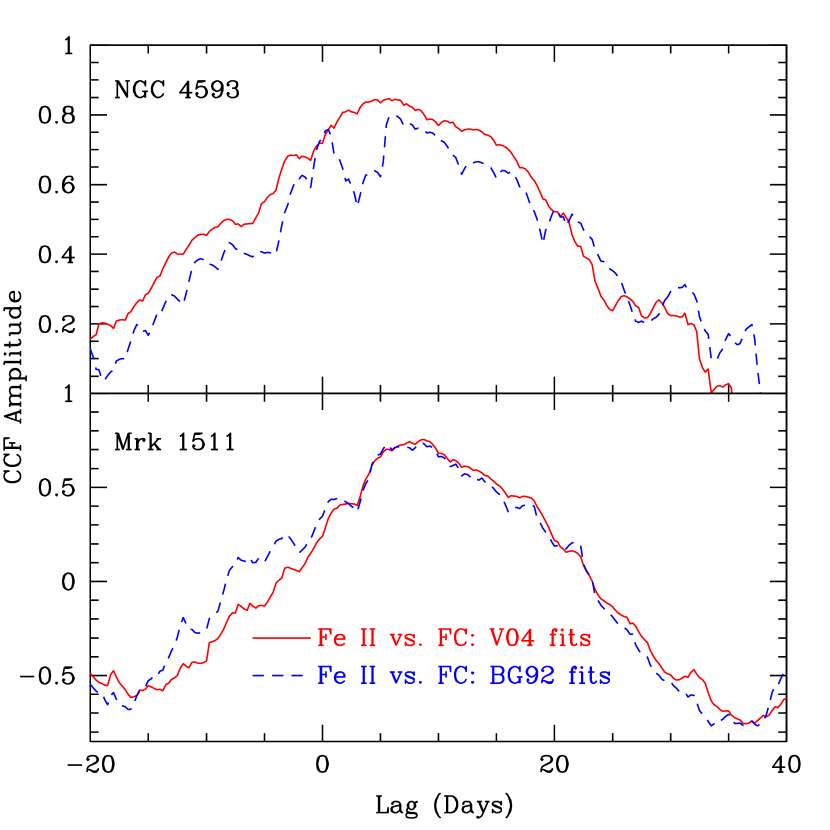
Figure 5 shows the Fe II vs. FC CCFs for both sets of template fits. For Mrk 1511, the choice of Fe II template has very little impact on the CCF shape or the lag in this measurement. However, the difference between the two templates is significant for NGC 4593, where the light curves measured from the BG92 template produce a very jagged and irregular CCF and yield very unreliable lag measurements with large uncertainties on and . The V04 template, on the other hand, gives a better-behaved result and smaller lag uncertainties. The cause of this difference is not obvious, but it does appear that the V04 template gives a clearly superior result at least for NGC 4593.
An additional possible concern is degeneracy between the stellar and AGN continuum components in the fit. For both objects, the light curves of the starlight component do not show any significant time-dependent features other than random noise. We measured cross-correlations between the stellar continuum component and the -band light curves in order to test whether the stellar continuum light curves might contain some residual AGN flux. The resulting CCFs had very low peak amplitudes of and 0.43 for NGC 4593 and Mrk 1511, respectively, and had such irregular structure that no clear lag signal could be measured in either case. This provides further evidence that the spectral decompositions are properly separating the contributions of the continuum components.
4.3. Estimating biases in reverberation lags
A small bias in reverberation lag measurements can occur when broad-band photometry is used for the continuum flux measurement, due to the contribution of emission-line flux to the photometric light curves. The passband of the filter includes flux from both H and Fe II, both of which lag the continuum variations. When cross-correlating spectroscopic emission-line light curves against the -band light curves, this emission-line contamination in the -band data will tend to bias the cross-correlation lag toward values that are lower than the true lag (Barth et al., 2011a). To determine the level of this contamination for Mrk 1511 as an example, we extrapolated our mean-spectrum fit over a broader wavelength range (up to 6500 Å) and carried out synthetic -band photometry on the individual model components. In the mean spectrum, the ratios of emission-line to AGN featureless continuum (FC) flux as measured through a -band filter are (H)/(FC) , and (Fe II)/(FC) .
We simulated the effect of the emission-line flux in the -band light curves by creating mock reverberation datasets having properties similar to those of our observed data. Following the method of Timmer & König (1995), we began by generating simulated AGN continuum light curves on a finely sampled temporal grid with bin size equal to 0.01 day, based on a power-density spectrum of the form (similar to slopes measured from Kepler AGN light curves by Mushotzky et al., 2011). Each light curve was generated over a total duration of 1000 days. A shorter segment of length 100 days was then selected randomly and normalized to have an rms variability equal to 15% of the median flux. The H and Fe II lines were assumed to respond linearly to continuum variations, with a delta function as the transfer function for simplicity, and with lag times of 6 days for H and 9 days for Fe II. Variability amplitudes for the emission lines were normalized so that H had the same 15% rms variability as the continuum, while Fe II was set to have a lower rms variability amplitude of 12%. Then, a “contaminated” -band light curve was created by adding scaled versions of the H and Fe II light curves to the FC light curve, in the relative proportions listed above for Mrk 1511. All of the light curves (FC, band, H, and Fe II) were then degraded to approximate the sampling and S/N of real data. From the finely sampled light curves, one flux point was chosen per night, randomly sampled from a window of hours relative to a uniform 24-hour cadence, and over a total spectroscopic monitoring duration of 80 days. Weather losses were approximated by randomly removing 10% of the points from the FC and -band light curves and 40% of the points from the emission-line light curves. Random Gaussian noise was added to attain S/N = 100 for the FC and -band data, and S/N = 50 for the emission-line light curves. The Fe II light curve was cross-correlated against both the pure FC light curve and the contaminated -band light curve, to determine the typical level of the bias, and this procedure was repeated times to build up a distribution of lag measurements for different initial realizations of the light-curve shape.
We compiled the values of for the subset of simulations that produced “successful” measurements of lag, meaning that the CCF had and yielded a nonnegative value of ; by these criteria 83% of the simulations were successful. For this subset, the median lag of Fe II relative to the pure AGN continuum is days, which is closely consistent with the input lag of 9 days. (The uncertainty of days represents the 68% confidence interval on for the set of successful simulations.) When the simulated Fe II light curves are cross-correlated against the simulated -band data including emission-line contributions, we find a median lag of days. As expected, this is shorter than the lag measured with respect to the pure AGN continuum, but the difference of 0.7 days in the median measurements is smaller than the uncertainty in the measured Fe II lag for either of our targets. Thus, the impact of this bias on the emission-line lag measurements is fairly small, most likely below the level of the uncertainties in the Fe II lags. The effect of emission-line contamination in the -band light curves would be similar for all of the cross-correlation measurements for a given AGN, so the inferred relative sizes of the Fe II and H emission regions would be only modestly affected.
4.4. Differences due to Fe II Template Structure
Among the reverberation measurements listed in Table 2, the strongest differences between results based on the V04 and BG92 template fits are in the lag of Fe II relative to the band. The BG92 fits give values that are 2–3 days lower than the values measured from the V04 fits. This difference appears to stem from the different proportions of FC and Fe II fluxes for the two sets of spectral fits. As can be seen in Figures 2 and 3, the broadened V04 template approaches zero flux density for the Fe II emission in the blue wing of H, as well as at the blue end of our fitting region. The broadened BG92 template, on the other hand, does not reach zero flux density anywhere in our fitting region, producing a higher “pseudo-continuum” level from blended Fe II lines and forcing the FC component to a lower overall flux than in the V04 fits. We suspect that the BG92 template fits are including a small amount of AGN continuum flux into the Fe II fit component. This small contribution of AGN continuum flux in the Fe II light curves would add a spurious signal at zero lag to the cross-correlations between Fe II and the -band data, slightly biasing the lags toward low values.
These differences stem from the methods used to construct the Fe II templates. The BG92 template is based on an observed spectrum of I Zw 1. Emission lines from several transitions other than Fe II were removed, and the continuum was removed by fitting a polynomial to regions between strong emission lines, leaving an approximate Fe II emission spectrum. The V04 template is also based on an observed spectrum of I Zw 1, but was constructed by removing a much larger list of non-Fe II emission features, and also removing narrow permitted and forbidden Fe II lines which were found to be much stronger in I Zw 1 than in most typical Seyfert 1 spectra. Each Fe II line in the remaining spectrum was then modeled with a Lorentzian profile of FWHM km s-1, producing a noise-free template. The more rigorous removal of non-Fe II emission features and narrow Fe II lines by V04 is a major reason to prefer the V04 template over the BG92 template for these fits. Furthermore, the empirical and somewhat subjective procedure used to remove the AGN continuum by BG92 may be responsible for the fitting degeneracy between the Fe II and FC components described above. If the AGN continuum were undersubtracted when constructing the BG92 template, there would be almost no noticeable impact on the quality of individual spectral fits that used the template, but the mixing of FC and Fe II emission would likely bias the reverberation lags measured for the Fe II component.
For NGC 4593, the CCF measured between the Fe II and FC light curves is certainly better when the V04 template is used, compared with the BG92 template. The reason for this difference is not clear, and it only appears to occur for NGC 4593 and not Mrk 1511, but it does add one additional reason to prefer the V04 template fits. For all of these reasons, we consider the measurements done using the V04 template fits to be our best-quality results. Most importantly, our main results are independent of the template choice: in either case we find that Fe II emission does show a strong reverberation response, with a lag time longer than that of H. As described in the Appendix, we find similar results when using the newly released multi-component Fe II templates of Kovačević et al. (2010). With these new templates, we obtain slightly different values of for the emission lines, but the Fe II lags are still consistently longer than those of H, with (Fe II)/(H). This further confirms that the larger size of the Fe II-emitting region (compared with H) is genuine and not an artifact of template choice.
It is also worth noting that the different template fits yield differing amounts of Fe II and He I emission underlying the broad H profile. The uncertain amount of blending of H with other emission features (each having a different lag relative to the continuum) could represent a limiting factor for the accuracy of high-fidelity reverberation measurements, particularly for velocity-resolved lag measurements which attempt to determine the distribution of lag across the velocity width of the line. Any ambiguity in decomposing the H spectral region into different emission-line components should be considered as a source of systematic uncertainty in determining the H lag distribution across the line profile.
5. Discussion and Conclusions
This is the first time that such clear reverberation signals have been seen for the optical Fe II blends in Seyfert galaxies. Our high-cadence monitoring data reveal that the Fe II emission in these galaxies does reverberate on short timescales in response to continuum variations, with a well-defined cross-correlation lag time. This gives direct evidence for an origin of the Fe II emission in photoionized gas in the BLR. The ambiguity in previous Fe II reverberation results for NGC 5548 (Vestergaard & Peterson, 2005) and Ark 120 (Kuehn et al., 2008) might be attributable to the lower cadence of the monitoring data used in these studies, although in both cases the monitoring duration spanned several years. It is also possible that the Fe II variability behavior in our two objects is not representative of the entire population of Seyferts. Measurement of Fe II variability over a broad range of AGN properties should be a high priority for future high-cadence reverberation-mapping programs. By exploring a broad range of luminosities, it might be possible to test whether the optical Fe II emission follows a radius-luminosity relationship similar to that of the H line, with a luminosity dependence of approximately (Bentz et al., 2009). It would be particularly interesting to test whether the ratio of Fe II to H radii varies systematically along the Eigenvector 1 sequence as a function of . If the Fe II-emitting gas is infalling toward the central engine, as proposed by Hu et al. (2008b), then there might also be observable correlations between the reverberation lag and the redshift of the Fe II lines, although evidence for radial inflow remains controversial (Sulentic et al., 2012).
The measured values of give an approximate mean radius for the zone from which each line is emitted within the BLR. Comparing the lags of Fe II and H for the preferred V04 template fits, we find (Fe II)(H) and in NGC 4593 and Mrk 1511, respectively. This gives a direct indication that the Fe II emission arises predominantly in the outer portion of the BLR on larger scales than the H emission region. This conclusion is consistent with several other recent lines of evidence for an outer BLR location for the Fe II emission (Sluse et al., 2007; Hu et al., 2008a, b; Matsuoka et al., 2008; Popović et al., 2009; Gaskell, 2009; Kovačević et al., 2010; Shields et al., 2010; Shapovalova et al., 2012; Hu et al., 2012; Mor & Netzer, 2012). We use the term “outer BLR” to denote emission from a region having a larger mean size than the H emission zone. Aside from Fe II, the only broad emission lines seen to have lags longer than that of H are C III] (Peterson & Wandel, 1999) and H (e.g., Kaspi et al., 2000; Bentz et al., 2010a). Thus, the emission regions for these lines correspond to the outermost observable portion of the BLR. The BG92 template fits give different ratios of Fe II to H lag, but we find that (Fe II) (H) for either template.
The longer lag of Fe II relative to H does not mean that the H and Fe II emission regions are physically distinct; in fact, there must be a very substantial radial overlap between them. Recent progress in transfer-function modeling for reverberation-mapping data has provided direct illustrations of the radial extent of the BLR as seen in Balmer lines. For Arp 151, the transfer functions show that the H emission extends over a broad radial zone with an outer extent that is more than twice as large as , and the H-emitting region is several times larger in extent than the mean H radius (Bentz et al., 2010b). If the ratios of Fe II to H size for NGC 4593 and Mrk 1511 are typical, then the Fe II-emitting zone would encompass the outer portion of the H-emitting zone of the BLR and beyond, probably corresponding roughly to the region emitting H. This echoes the recent finding by Hu et al. (2008a) that quasar H profiles generically contain an intermediate-width component which may be emitted from the same region that produces Fe II, while the very broad component of H would be emitted from smaller radii. Further support for a link between the Fe II region and the outer portion of the Balmer-line emitting zone of the BLR comes from a new principal-component analysis of quasar spectra by Hu et al. (2012). They demonstrate that one of the primary eigenspectra of their quasar sample is essentially the sum of two components: the Fe II emission spectrum and an intermediate-width core component of the Balmer lines, which are readily interpreted as arising from a similar spatial region.
Hu et al. (2008b) found that Fe II line widths in SDSS quasars are typically about 3/4 of the H widths. In order to test whether NGC 4593 and Mrk 1511 are consistent with this trend, we examine the results of the spectral fits done using the BG92 Fe II template, since this closely follows the fitting method used by Hu et al. (2008b). We assume that the total velocity width of FWHM is given by the quadrature sum of the FWHM of the broadening kernel from the fit and the FWHM of the line profiles in the template itself which we take to be 900 km s-1 for consistency with Hu et al. (2008b). We also correct the observed widths for an instrumental broadening of FWHM km s-1 (Barth et al., 2011a). Then, we obtain Fe II widths of FWHM km s-1 for NGC 4593 and km s-1 for Mrk 1511, where the uncertainties are based on the night-to-night scatter in the width of the Fe II Gaussian broadening kernel determined by the fitting procedure. The broad-H component models for the two AGNs have FWHM = km s-1 for NGC 4593 and km s-1 for Mrk 1511. In both cases, then, FWHM(Fe II)/FWHM(H) is almost precisely 0.75, closely consistent with the average result for the Hu et al. (2008b) sample.
However, we also find that the inferred Fe II widths seem to be substantially dependent on choice of template. Using our results from fitting with the V04 template, we obtain broader Fe II widths of FWHM = km s-1 and km s-1 for NGC 4593 and Mrk 1511, in both cases broader than the H FWHM values. This appears to be the result of a combination of factors including different relative strengths for individual Fe II lines between the two templates, and the fact that the V04 template is constructed using Lorentzian models fitted to each line. One consequence of these Lorentzian profiles is that the FWHM values of the template itself and of the Gaussian broadening kernel do not simply add in quadrature to give the FWHM of the total line profile; the FWHM of the Gaussian-broadened template profile is broader than the quadrature sum of the template FWHM and broadening kernel FWHM.
Based on the fits done using the BG92 template, we can conclude that these two AGNs have FWHM(Fe II)/FWHM(H) ratios consistent with the mean value found by Hu et al. (2008b) for a large SDSS sample, so there is no evidence that they are outliers from the normal AGN population. However, the absolute determination of Fe II width seems to be subject to substantial systematic uncertainty due to the details of how the fit is performed and choice of template. Further investigation of the cause of this discrepancy in Fe II widths for different templates is beyond the scope of this paper, but this problem is likely to affect all inferences about Fe II profile widths measured by template fitting, particularly when the individual Fe II features are completely blended into a pseudocontinuum as is the case in these two objects.
In addition to the systematic issues related to choice of Fe II template, there are some additional and important caveats to note about the measured Fe II lags. The CCF methodology only gives a single, simplistic measure of the lag time for an emission line, whereas in reality a given spectral line will be emitted over a broad range of radii. It might be possible to obtain more detailed information on the radial distribution of Fe II emissivity by applying the geometric modeling methods described by Pancoast et al. (2011) or by applying techniques to extract the shape of the transfer function from the data (Bentz et al., 2010b; Grier et al., 2013). However, the Fe II light curves are relatively noisy and higher-quality data might be required, perhaps over a longer monitoring duration, in order to go beyond the simple cross-correlation determination of the Fe II lag presented here. Furthermore, our spectral fits assume a uniform flux scaling for the entire Fe II template, which results in an average lag measurement for the entire complex of Fe II blends, but this method is unable to explore the possibility of different response times for different Fe II lines. Recent work has improved on traditional template-fitting methods by allowing for different behavior among different groups of Fe II lines (Kovačević et al., 2010), and Shapovalova et al. (2012) demonstrated that in Ark 564, Fe II lines from different multiplets showed differing levels of correlation with continuum variations. Application of such methods to reverberation-mapping data could potentially detect or constrain differences in reverberation timescale for different Fe II multiplets as well.
The primary conclusions of this study are that measurement of the reverberation lag of the optical Fe II blends is indeed possible in favorable cases, and that in these two AGNs the Fe II emission responds directly to continuum variations with a lag time that corresponds to the outer portion of the BLR, somewhat larger than the H-emitting radius. With well-sampled data it is possible to detect this reverberation signature with a level of significance comparable to that of high-quality H reverberation measurements. Detection of Fe II reverberation does require some special circumstances, in particular a high amplitude of continuum variability, as well as relatively strong Fe II emission overall. In all other objects from our 2011 sample, either the Fe II emission was too weak (as in Mrk 50; Barth et al., 2011b), or the overall flux variability was too low for measurements like these to be successful. Finally, these results illustrate the value of carrying out spectral decompositions of reverberation-mapping data, in order to measure accurate light curves for Fe II, He II, and other weak or low-amplitude spectral features. Application of these methods for measurement of emission-line light curves for our entire 2011 sample will be described in future papers in this series.
References
- Alard (2000) Alard, C. 2000, A&AS, 144, 363
- Alard & Lupton (1998) Alard, C., & Lupton, R. H. 1998, ApJ, 503, 325
- Baldwin et al. (2004) Baldwin, J. A., Ferland, G. J., Korista, K. T., Hamann, F., & LaCluyzé, A. 2004, ApJ, 615, 610
- Barth et al. (2011a) Barth, A. J., Nguyen, M. L., Malkan, M. A., et al. 2011a, ApJ, 732, 121
- Barth et al. (2011b) Barth, A. J., Pancoast, A., Thorman, S. J., et al. 2011b, ApJ, 743, L4
- Bentz et al. (2008) Bentz, M. C., Walsh, J. L., Barth, A. J., et al. 2008, ApJ, 689, L21
- Bentz et al. (2009) Bentz, M. C., Peterson, B. M., Netzer, H., Pogge, R. W., & Vestergaard, M. 2009, ApJ, 697, 160
- Bentz et al. (2010a) Bentz, M. C., Walsh, J. L., Barth, A. J., et al. 2010a, ApJ, 716, 993
- Bentz et al. (2010b) Bentz, M. C., et al. 2010b, ApJ, 720, L46
- Bian et al. (2010) Bian, W.-H., Huang, K., Hu, C., et al. 2010, ApJ, 718, 460
- Boroson (2002) Boroson, T. A. 2002, ApJ, 565, 78
- Boroson & Green (1992) Boroson, T. A., & Green, R. F. 1992, ApJS, 80, 109 (BG92)
- Bruhweiler & Verner (2008) Bruhweiler, F., & Verner, E. 2008, ApJ, 675, 83
- Bruzual & Charlot (2003) Bruzual, G., & Charlot, S. 2003, MNRAS, 344, 1000
- Cardelli et al. (1989) Cardelli, J. A., Clayton, G. C., & Mathis, J. S. 1989, ApJ, 345, 245
- Cenko et al. (2006) Cenko, S. B., Fox, D. B., Moon, D.-S., et al. 2006, PASP, 118, 1396
- Collin & Joly (2000) Collin, S., & Joly, M. 2000, New Astronomy Reviews, 44, 531
- Collin-Souffrin et al. (1980) Collin-Souffrin, S., Joly, M., Dumont, S., & Heidmann, N. 1980, A&A, 83, 190
- Dietrich et al. (2002) Dietrich, M., Appenzeller, I., Vestergaard, M., & Wagner, S. J. 2002, ApJ, 564, 581
- Dong et al. (2011) Dong, X.-B., Wang, J.-G., Ho, L. C., et al. 2011, ApJ, 736, 86
- Doroshenko et al. (1999) Doroshenko, V. T., Sergeev, S. G., Pronik, V. I., & Chuvaev, K. K. 1999, Astronomy Letters, 25, 569
- Ferland et al. (2009) Ferland, G. J., Hu, C., Wang, J.-M., et al. 2009, ApJ, 707, L82
- Filippenko (1982) Filippenko, A. V. 1982, PASP, 94, 715
- Filippenko et al. (2001) Filippenko, A. V., Li, W. D., Treffers, R. R., & Modjaz, M. 2001, in Small-Telescope Astronomy on Global Scales, ed. W. P. Chen, C. Lemme, and B. Paczyński (San Francisco: ASP), 121
- Gaskell (2009) Gaskell, C. M. 2009, New Astronomy Reviews, 53, 140
- Gaskell & Peterson (1987) Gaskell, C. M., & Peterson, B. M. 1987, ApJS, 65, 1
- Giannuzzo & Stirpe (1996) Giannuzzo, E. M., & Stirpe, G. M. 1996, A&A, 314, 419
- Grier et al. (2013) Grier, C. J., Peterson, B. M., Horne, K., et al. 2013, ApJ, 764, 47
- Hu et al. (2008a) Hu, C., Wang, J.-M., Ho, L. C., et al. 2008a, ApJ, 683, L115
- Hu et al. (2008b) Hu, C., Wang, J.-M., Ho, L. C., et al. 2008b, ApJ, 687, 78
- Hu et al. (2012) Hu, C., Wang, J.-M., Ho, L. C., et al. 2012, ApJ, 760, 126
- Jiang et al. (2007) Jiang, L., Fan, X., Vestergaard, M., et al. 2007, AJ, 134, 1150
- Kaspi et al. (2000) Kaspi, S., Smith, P. S., Netzer, H., et al. 2000, ApJ, 533, 631
- Kollatschny et al. (2000) Kollatschny, W., Bischoff, K., & Dietrich, M. 2000, A&A, 361, 901
- Korista (1992) Korista, K. T. 1992, ApJS, 79, 285
- Kovačević et al. (2010) Kovačević, J., Popović, L. Č., & Dimitrijević, M. S. 2010, ApJS, 189, 15
- Kuehn et al. (2008) Kuehn, C. A., Baldwin, J. A., Peterson, B. M., & Korista, K. T. 2008, ApJ, 673, 69
- Kurk et al. (2007) Kurk, J. D., Walter, F., Fan, X., et al. 2007, ApJ, 669, 32
- Lipari et al. (1993) Lipari, S., Terlevich, R., & Macchetto, F. 1993, ApJ, 406, 451
- Maoz et al. (1993) Maoz, D., Netzer, H., Peterson, B. M., et al. 1993, ApJ, 404, 576
- Markwardt (2009) Markwardt, C. B. 2009, Astronomical Data Analysis Software and Systems XVIII, 411, 251
- Marziani et al. (2001) Marziani, P., Sulentic, J. W., Zwitter, T., Dultzin-Hacyan, D., & Calvani, M. 2001, ApJ, 558, 553
- Marziani et al. (2003) Marziani, P., Sulentic, J. W., Zamanov, R., et al. 2003, ApJS, 145, 199
- Matsuoka et al. (2008) Matsuoka, Y., Kawara, K., & Oyabu, S. 2008, ApJ, 673, 62
- Miller & Stone (1993) Miller, J. S., & Stone, R. P. S. 1993, Lick Obs. Tech. Rep. 66 (Santa Cruz, CA: Lick Observatory)
- Mor & Netzer (2012) Mor, R., & Netzer, H. 2012, MNRAS, 420, 526
- Mushotzky et al. (2011) Mushotzky, R. F., Edelson, R., Baumgartner, W., & Gandhi, P. 2011, ApJ, 743, L12
- Nandra et al. (1997) Nandra, K., George, I. M., Mushotzky, R. F., Turner, T. J., & Yaqoob, T. 1997, ApJ, 476, 70
- Netzer & Wills (1983) Netzer, H., & Wills, B. J. 1983, ApJ, 275, 445
- Pancoast et al. (2011) Pancoast, A., Brewer, B. J., & Treu, T. 2011, ApJ, 730, 139
- Pancoast et al. (2012) Pancoast, A., Brewer, B. J., Treu, T., et al. 2012, ApJ, 754, 49
- Park et al. (2012) Park, D., Woo, J.-H., Treu, T., et al. 2012, ApJ, 747, 30
- Peterson et al. (2004) Peterson, B. M., Ferrarese, L., Gilbert, K. M., et al. 2004, ApJ, 613, 682
- Peterson & Wandel (1999) Peterson, B. M., & Wandel, A. 1999, ApJ, 521, L95
- Phillips (1978a) Phillips, M. M. 1978a, ApJS, 38, 187
- Phillips (1978b) Phillips, M. M. 1978b, ApJ, 226, 736
- Popović et al. (2004) Popović, L. Č., Mediavilla, E., Bon, E., & Ilić, D. 2004, A&A, 423, 909
- Popović et al. (2009) Popović, L. Č., Smirnova, A. A., Kovačević, J., Moiseev, A. V., & Afanasiev, V. L. 2009, AJ, 137, 3548
- Popovic et al. (2013) Popovic, L. C., Kovacevic, J., & Dimitrijevic, M. S. 2013, to appear in Proceedings of Science (arXiv:1301.6941)
- Shapovalova et al. (2012) Shapovalova, A. I., Popović, L. Č., Burenkov, A. N., et al. 2012, ApJS, 202, 10
- Shields et al. (2010) Shields, G. A., Ludwig, R. R., & Salviander, S. 2010, ApJ, 721, 1835
- Sigut & Pradhan (2003) Sigut, T. A. A., & Pradhan, A. K. 2003, ApJS, 145, 15
- Sluse et al. (2007) Sluse, D., Claeskens, J.-F., Hutsemékers, D., & Surdej, J. 2007, A&A, 468, 885
- Sulentic et al. (2000) Sulentic, J. W., Zwitter, T., Marziani, P., & Dultzin-Hacyan, D. 2000, ApJ, 536, L5
- Sulentic et al. (2012) Sulentic, J. W., Marziani, P., Zamfir, S., & Meadows, Z. A. 2012, ApJ, 752, L7
- Timmer & König (1995) Timmer, J., & König, M. 1995, A&A, 300, 707
- Tonry et al. (2003) Tonry, J. L., Schmidt, B. P., Barris, B., et al. 2003, ApJ, 594, 1
- van Dokkum (2001) van Dokkum, P. G. 2001, PASP, 113, 1420
- van Groningen & Wanders (1992) van Groningen, E., & Wanders, I. 1992, PASP, 104, 700
- Verner et al. (2003) Verner, E., Bruhweiler, F., Verner, D., Johansson, S., & Gull, T. 2003, ApJ, 592, L59
- Verner et al. (1999) Verner, E. M., Verner, D. A., Korista, K. T., et al. 1999, ApJS, 120, 101
- Véron et al. (2002) Véron, P., Gonçalves, A. C., & Véron-Cetty, M.-P. 2002, A&A, 384, 826
- Véron-Cetty et al. (2004) Véron-Cetty, M.-P., Joly, M., & Véron, P. 2004, A&A, 417, 515 (V04)
- Vestergaard & Peterson (2005) Vestergaard, M., & Peterson, B. M. 2005, ApJ, 625, 688
- Wang et al. (2005) Wang, J., Wei, J. Y., & He, X. T. 2005, A&A, 436, 417
- Welsh (1999) Welsh, W. F. 1999, PASP, 111, 1347
- White & Peterson (1994) White, R. J., & Peterson, B. M. 1994, PASP, 106, 879
- Wills et al. (1985) Wills, B. J., Netzer, H., & Wills, D. 1985, ApJ, 288, 94
- Yoshii et al. (1998) Yoshii, Y., Tsujimoto, T., & Kawara, K. 1998, ApJ, 507, L113