Serendipitous discovery of a massive D galaxy at : Implications for the early formation and late evolution of D galaxies
Abstract
We have made a serendipitous discovery of a massive () cD galaxy at z=1.096 in a candidate rich cluster in the HUDF area of GOODS-South. This brightest cluster galaxy (BCG) is the most distant cD galaxy confirmed to date. Ultra-deep HST/WFC3 images reveal an extended envelope starting from and reaching in radius along the semi-major axis. The spectral energy distributions indicate that both its inner component and outer envelope are composed of an old, passively-evolving (specific star formation rate ) stellar population. The cD galaxy lies on the same mass-size relation as the bulk of quiescent galaxies at similar redshifts. The cD galaxy has a higher stellar mass surface density () but a similar velocity dispersion () to those of more-massive, nearby cDs. If the cD galaxy is one of the progenitors of today’s more massive cDs, its size () and stellar mass have had to increase on average by factors of and over the past Gyrs, respectively. Such increases in size and stellar mass without being accompanied by significant increases in velocity dispersion are consistent with evolutionary scenarios driven by both major and minor dissipationless (dry) mergers. If such cD envelopes originate from dry mergers, our discovery of even one example proves that some BCGs entered the dry merger phase at epochs earlier than . Our data match theoretical models which predict that the continuance of dry mergers at can result in structures similar to those of massive cD galaxies seen today. Moreover, our discovery is a surprise given that the extreme depth of the HUDF is essential to reveal such an extended cD envelope at and, yet, the HUDF covers only a minuscule region of sky (). Adding that cDs are rare, our serendipitous discovery hints that such cDs may be more common than expected, perhaps even ubiquitous. Images reaching HUDF depths of more area (especially with cluster BCGs at ) are needed to confirm this conjecture.
Subject headings:
galaxies: clusters: general — galaxies: elliptical and lenticular, cD — galaxies: evolution1. Introduction
cD galaxies are the most luminous and most massive galaxies in the local Universe and are mostly located close to the centers of galaxy clusters. Earlier studies have characterized cD galaxies by their excess light (‘envelopes’) over the de Vaucouleurs (or , de Vaucouleurs 1948) profile or Srsic (or , Srsic 1968) profile at large radii (e.g., Matthews et al., 1964; Schombert, 1988; Graham et al., 1996). More recent studies have identified cD galaxies using improved Petrosian (Petrosian, 1976) parameter profiles (Brough et al., 2005; Patel et al., 2006; Liu et al., 2008). A large fraction of massive nearby brightest cluster galaxies (BCGs) can be classified as cD galaxies (Liu et al., 2008).
The formation mechanism of BCGs/cDs and their evolution are not well-understood. To that end, several formation mechanisms including galactic cannibalism (White, 1976; Ostriker & Hausman, 1977), tidal stripping from cluster galaxies (Gallagher & Ostriker, 1972; Richstone, 1976; Merritt, 1985) and star formation on BCGs by cooling flows (Fabian, 1994) have been proposed. Recent semi-analytic models and simulations of galaxy formation suggested that BCGs form in a two-phase process: an initial collapse with rapid cooling and star formation at high redshift is followed by later () growth through multiple dissipationless (dry) mergers of pre-existing progenitors (e.g., De Lucia & Blaizot 2007; Ruszkowski & Springel 2009; Naab et al. 2009; Laporte et al. 2012). Very recently, Laporte et al. (2013) showed that BCGs can form through dissipationless mergers of quiescent massive galaxies in their simulations in a universe, which likely indicates that BCGs entered the dry merger phase at epochs earlier than . Interestingly, they found cD signatures among their simulated BCGs by (Laporte et al. 2013). Recent observational studies also provide evidence that BCGs build up a large part of their stellar masses via dry mergers at (e.g., Liu et al. 2008,2009; Tovmassian & Andernach 2012; Lidman et al. 2012). However, other studies argued that BCGs evolve minimally since (Whiley et al. 2008; Stott et al. 2011) and mergers are unlikely to be important for the growth of BCGs at (e.g., Ascaso et al. 2011). Our early work (Liu et al. 2008) showed that BCGs with dry mergers evolve to possess light profiles similar to those of local cD galaxies by depositing stellar plumes into the BCG outskirts.
Although the origin of cD galaxies, and the contribution of their envelopes to the intra-cluster light, are still not completely clear (e.g., Gonzalez et al., 2005; Zibetti et al., 2005), the extended stellar haloes of cD galaxies to surface brightness in the rest-frame Sloan -band are likely to come from galaxies themselves (Tal & van Dokkum, 2011): the intra-cluster light has much lower surface brightness and only dominates at large radius ( 80100 ; for detailed discussions, see Zibetti et al., 2005; Bernardi et al., 2007; Lauer et al., 2007; Tal & van Dokkum, 2011). Even so, it is difficult to identify faint cD signatures in the high-redshift () galaxies due to the cosmological surface brightness dimming. Therefore, it is still unknown whether cD galaxies can form at high redshift. Best et al. (1998) claimed a detection of cD-like signatures in two high-redshift 3CR radio galaxies (3C 22 at z=0.936 and 3C 41 at z=0.795) based on shallow (one orbit) HST/WFPC2 imaging data. However, their results were not confirmed by deeper imaging observations.
In this paper, we report the serendipitous discovery of a massive cD galaxy (GOODS-S J033237.19-274608.1, named after GOODS-S and its J2000 coordinate: RA=53.1549542, DEC=-27.7689028) at z=1.096 (see §5) in a candidate rich cluster in the HUDF area of GOODS-South. We use its ultra-deep HST/WFC3 mosaic image to to confirm the existence of an extended cD envelope characterized by distinct Petrosian parameter profiles. We also investigate the stellar population and environment of this distant cD galaxy, and explore its possible evolution to today by comparing its structural parameters to those of more-massive, nearby cD galaxies. Throughout the paper we adopt a cosmology with a matter density parameter , a cosmological constant and a Hubble constant of . All magnitudes are in the AB system unless otherwise stated.
2. Image Data
The cD galaxy, GOODS-S J033237.19-274608.1, is located in the Hubble Ultra Deep Field (HUDF, Beckwith et al., 2006) region of the south field of the Great Observatories Origin Deep Survey (GOODS-S, Giavalisco et al., 2004). The HUDF is covered by the HST/WFC3 F105W(), F125W(), and F160W() bands imaging from G. Illingworth’s HUDF09 program (GO 11563, Bouwens et al., 2010) as well as the Cosmic Assembly Near-IR Deep Extragalactic Legacy Survey (CANDELS, Grogin et al., 2011; Koekemoer et al., 2011). The HUDF has also been observed by the HST/ACS F435W(), F606W(), F775W(), and F850LP() bands imaging from Beckwith et al. (2006) and GOODS (Giavalisco et al., 2004). We made use of all HST observations published prior to June 2012 in the HUDF to maximize our ability to detect the low surface brightness envelope of this cD galaxy at large radius. These HST mosaics reach the 5 limiting depths (035-diameter aperture) of 29.7, 30.1, 29.9, 29.4, 29.6, 29.9, and 29.9 AB in , , , , , , and -bands. Low-resolution UV (U-band from both CTIO/MOSAIC and VLT/VIMOS) and IR (VLT/ISAAC Ks and Spitzer/IRAC 3.6, 4.5, 5.8, 8.0 ) images are also available for this galaxy. Uniform multi-wavelength photometry from the UV to 8.0 with the resolution and blending of each band taken into account is provided by Guo et al. (2013).
3. Identification of cD signature
To quantitatively determine how a surface brightness profile deviates from a de Vaucouleurs or Srsic profile, we use an objective method based on the Petrosian profiles (Liu et al., 2008), defined as
| (1) |
where is the surface brightness in magnitudes at radius and is the mean surface brightness within (Petrosian, 1976). We also calculate the gradient of , . Liu et al. (2008) have shown that there is always a distinct signature of a plateau in the Petrosian profiles and a valley in the profiles for cD-like BCGs with an extended stellar halo (see their Fig. 5). Such signatures are not present in normal elliptical galaxies, which are usually well-fit by a profile. We label the radius of the minimum in the profile as . We also define a depth, , which is the difference between the minimum and maximum of outside twice the seeing radius and . is, by definition, the transitional radius (TR) between the inner component and outer halo in a cD-like galaxy. Our method indicates that the surface brightness deviations of overall BCGs from the single Srsic profile does not have any sharp transitions. However, the more significant the deviations of the surface brightness profiles from a single Srsic profile (i.e., the more prominent the stellar halo in the outskirts), the more distinct the signatures (plateau and valley) become statistically (see Liu et al. 2008 for details).
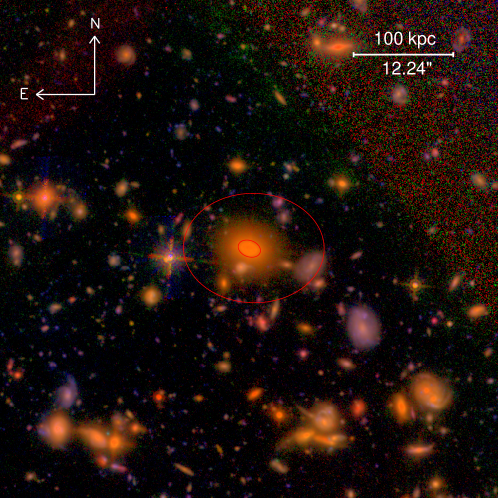
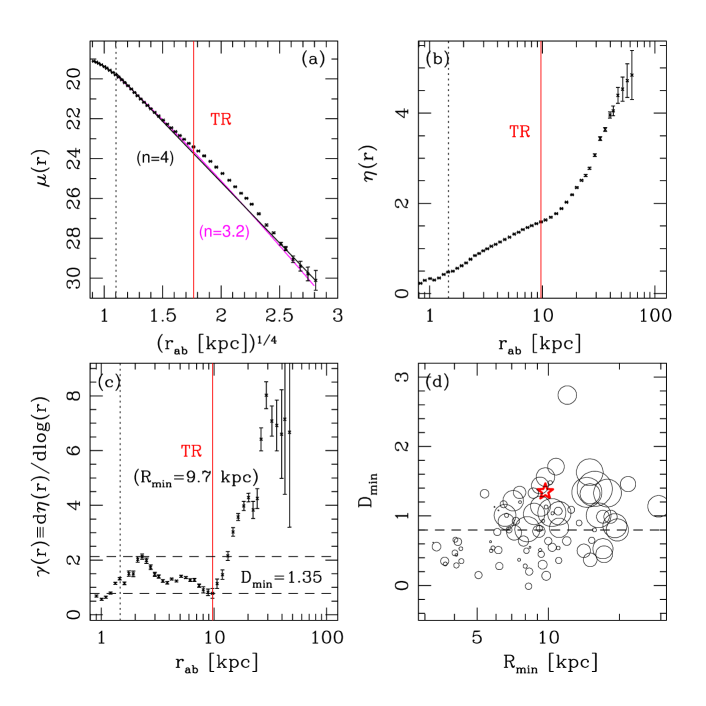
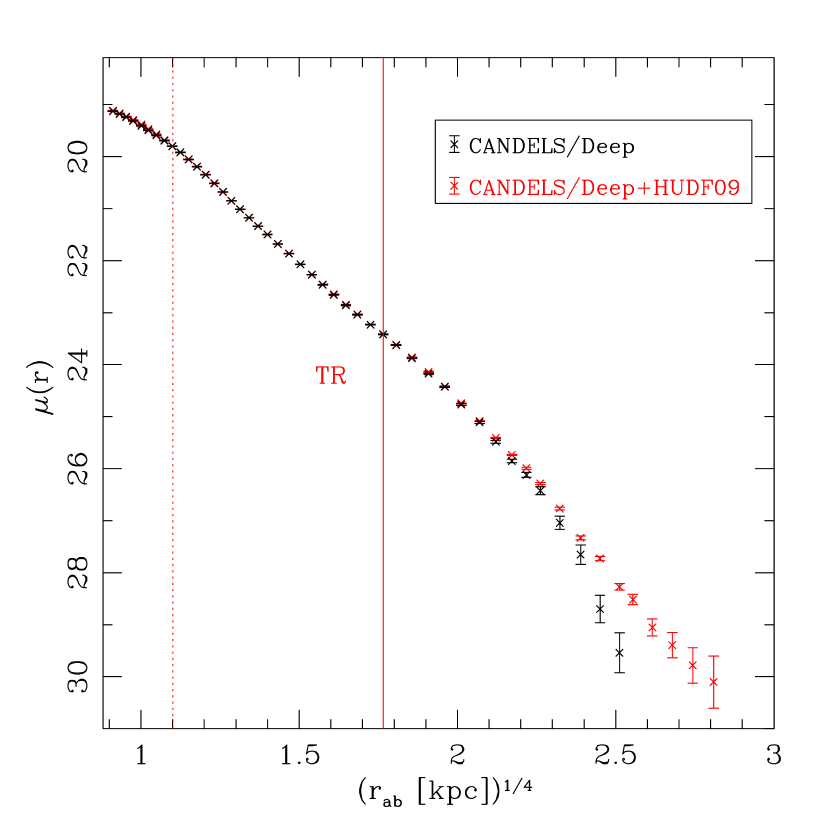
Fig. 1 is the pseudo-color composite image of GOODS-S J033237.19-274608.1 from the ACS -band, WFC3 - and -band images. The transitional isophote and the maximum measured isophote are marked with red ellipses. Panels (a)-(c) of the Fig. 2 show the observed surface brightness profile, the corresponding Petrosian profile and profile in the -band, all of which are measured from the mosaic image of CANDELS/Deep + HUDF09 (5 orbits + 34 orbits). All radial profiles use the equivalent radius of an ellipse, , where and are the lengths of semi-major and semi-minor axes of the ellipse. Contaminating objects detected with counts above 1 sigma noise have been masked during our measurement following Liu et al. (2008). The F125W () band is used because it is closest to the rest-frame Sloan -band at this redshift. It is clear that the surface brightness profile of GOODS-S J033237.19-274608.1 deviates significantly from a single de Vaucouleurs () profile or Srsic (, here) profile, and the profile shows a plateau and the profile shows a valley around the transitional radius. The transitional radius is and the corresponding value is 1.35.
We investigate the position of GOODS-S J033237.19-274608.1 on a plot of versus compared to a representative sample of nearby BCGs in Liu et al. (2008), as shown in the panel (d) of Fig. 2. Liu et al. (2008) statistically showed that the larger and the transitional radius of a BCG are, the more significantly extended its envelope appears to be. BCGs with larger than 0.8 are more likely to be classified as cD galaxies. Note that is the median value for all nearby BCGs. Our galaxy, GOODS-S J033237.19-274608.1 at , has and is therefore termed a cD galaxy. The stellar envelope of this high-redshift cD galaxy starts to dominate from (the corresponding semi-major axis radius is ) and extends to ().
4. The size and stellar mass
It is unreasonable to characterize the sizes of cD galaxies by half-light radii (effective radii) from single Srsic ( for de Vaucouleurs) fits since the surface brightness profiles of cD galaxies usually show strong deviations from single Srsic profiles. We opt to use the real isophotal half-light radius to characterize the size of this cD galaxy following Liu et al. (2008). The derived half-light radius of GOODS-S J033237.19-274608.1 within the maximum measured isophote in the -band is only . In order to estimate the effects of point-spread-function (PSF) on the size measurement, we first used the GALFIT package (Peng et al., 2002) to fit a conventional two-dimensional model, convolved with the real PSF, to the observed image. A double-Srsic model was applied to determine the best-fit model image. We then added the residual image to the best-fit model image (PSF deconvolved) to correct the uncertainty of model fitting. It should be noted that the residual image is not deconvolved for PSF. However, this does not significantly affect the accuracy of our method since the flux ratio of residual-to-observed images is only . We did the isophotal photometry and half-light radius measurement for the ‘residual-corrected’ model image in the same way as for the observed image. The obtained half-light radius is , which shows the PSF effect is not significant.
We followed Guo et al. (2012) to fit spectral energy distributions (SEDs) composed of homogeneous aperture magnitudes from the UV to to estimate the stellar mass. We used an updated version (CB07) of Bruzual & Charlot (2003) stellar population synthesis models with a range of stellar population properties and dust extinctions. We assumed models with a solar metallicity, a Salpeter (Salpeter, 1955) initial mass function (IMF), and a Calzetti et al. (2000) law. The derived stellar mass is . It becomes () after accounting for the small difference between the used aperture magnitude and isophotal magnitude within the maximum measured ellipse in the -band.
5. Optical spectroscopy and stellar population
We show the optical spectroscopy of GOODS-S J033237.19-274608.1 in the top panel of Fig. 3, which is observed by the VLT/FORS2 instrument in the ESO/GOODS spectroscopic program. The grating used has a scale of roughly 3.2 and a nominal resolution of . The whole spectral range is (see Vanzella et al., 2005, for details). The derived spectroscopic redshift of GOODS-S J033237.19-274608.1 is . The spectroscopy of this galaxy shows weak emission lines (e.g., [OII]3727) and a weak absorption line, indicating that it is dominated by an old stellar population.
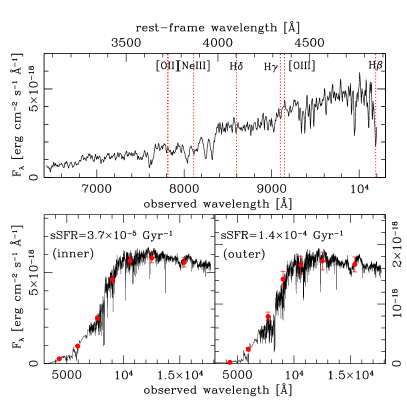
We fitted the SEDs of the inner component () and outer envelope () to investigate each of their stellar populations. The unmasked imaging data in seven high-resolution HST bands (,,,,,,) were used. The cut off at for the outer region is to ensure high signal-to-noise ratios for all bands at large radius. The results are shown in the bottom panels of Fig. 3. The derived specific star formation rates (sSFRs) for the inner component and outer envelope are and , respectively. The sSFRs, i.e. the SFR per unit stellar mass, were calculated by dividing the SFRs by the stellar masses, which were derived from the SED fittings separately. The sSFRs of both components are consistent with being passively-evolving stellar populations.
6. The environment
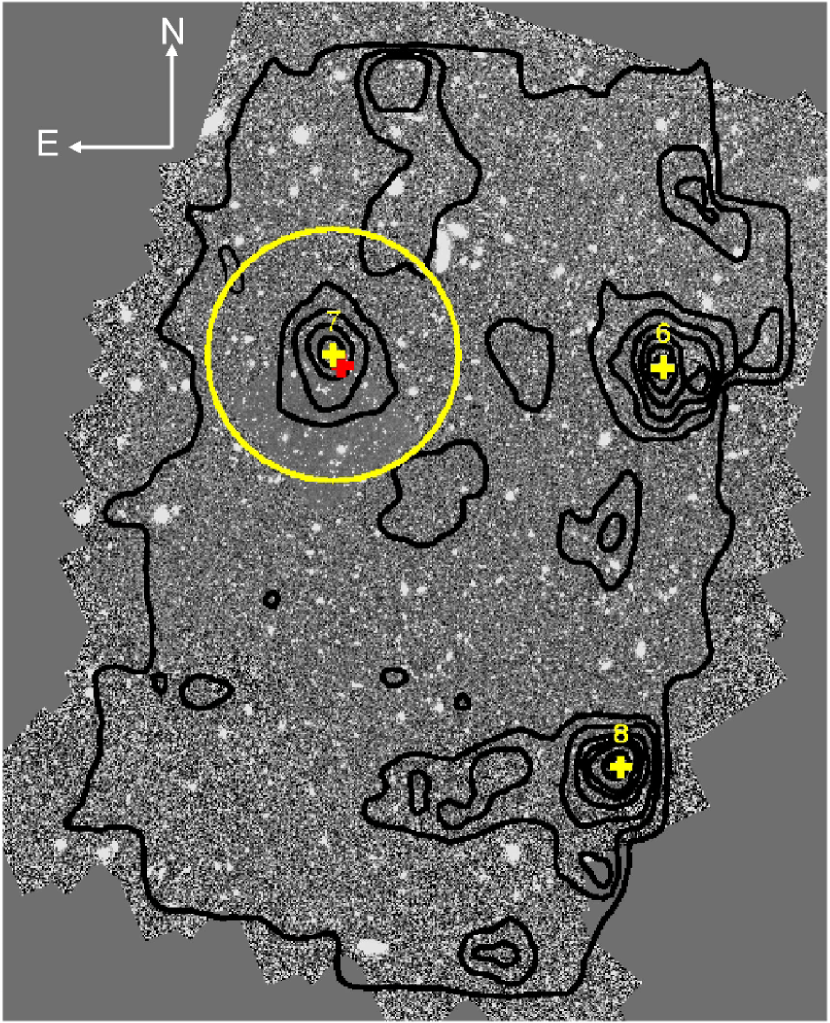
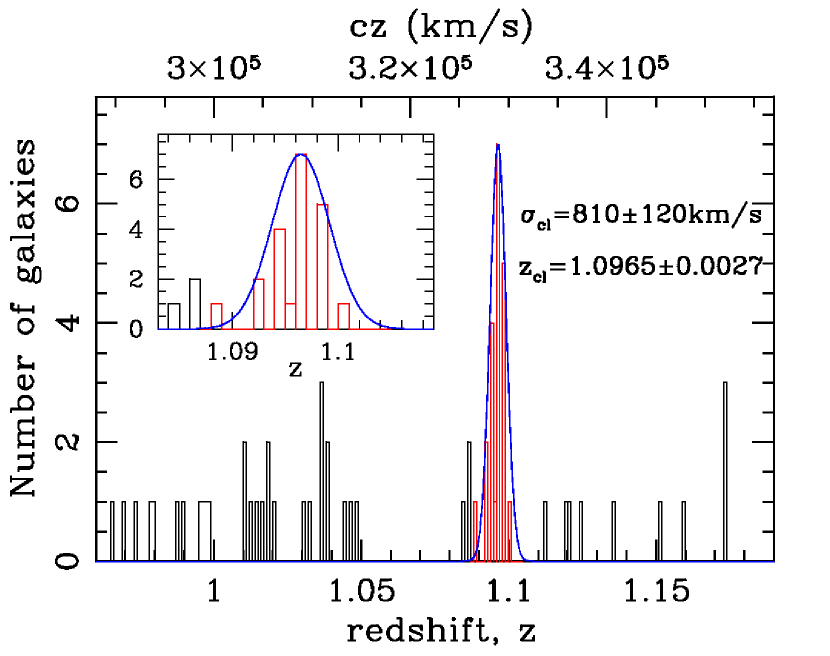
It is well known that cD galaxies in the local Universe are usually BCGs and are mostly found in the centers of rich clusters. We now investigate whether this high-redshift cD galaxy is also located in a cluster environment. Salimbeni et al. (2009) have found three group/cluster structures around the photometric redshift in the entire GOODS-S field. The projected density isosurfaces of these three structures are shown in the top image of Fig. 4 (also see panel c in Salimbeni et al. 2009). It is obvious that the discovered cD galaxy is very close to the projected density peak of the structure with ID=7. Salimbeni et al. (2009) estimated that this structure has a photometric redshift , and 60 member galaxies. Our cD galaxy is the most massive galaxy within the redshift gap of in this structure. We searched for other galaxies with secure spectroscopic redshifts (quality flag = 1 or 2) in the literature (Vanzella et al., 2005, 2006; Balestra et al., 2010; Cooper et al., 2012) within a projected distance of 1 Mpc from the density peak of this structure. The distribution of redshifts (radial velocities) of these galaxies (with a bin size of 0.001, corresponding to typical errors of spectroscopic redshifts) near the estimated structure redshift is shown in the bottom panel of Fig. 4. We iteratively fitted this distribution with a Gaussian function and rejected all outliers which lie beyond 3 sigma of the best-fit Gaussian distribution. The final best fit includes 21 objects all within 3 sigma of the best-fit Gaussian, with an inferred velocity dispersion of 810120km/s. We derived a precise redshift location of for this structure. These values are consistent with the results (797138km/s and ) estimated using the biweight estimators, computed with the Rostat package (Beers et al. 1990). The redshift of the cD galaxy places at the center of the cluster redshift distribution. These properties collectively suggest that GOODS-S J033237.19-274608.1 is both likely to be in a cluster environment and is also located close to the cluster center. Future spectroscopic observations can confirm more cluster galaxies and quantify the richness of this potential rich cluster.
7. Summary and Discussion
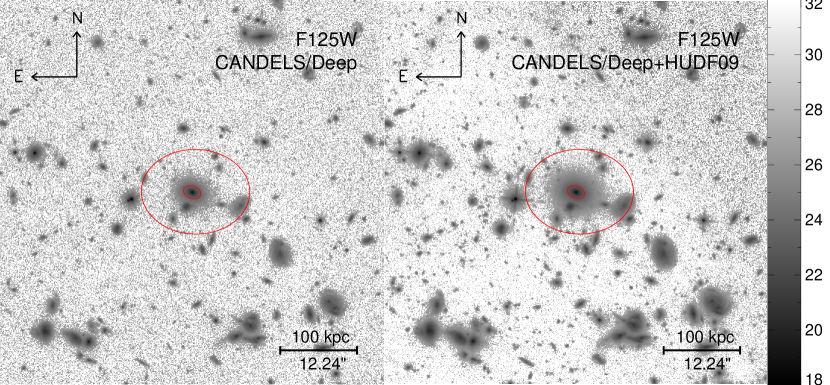
We have made a serendipitous discovery that the most massive () galaxy (GOODS-S J033237.19-274608.1), i.e., the BCG, in a candidate rich cluster at z=1.096 in the HUDF area of GOODS-S is a cD, with an outer envelope extending in radius to along the semi-major axis. This is the most distant, massive cD galaxy confirmed to date. The HUDF image is unique in being the deepest and, thus, as seen in Fig. 5, such a faint, extended, stellar envelope would not have been otherwise visible. Moreover, since the HUDF only covers less than 5 square arcminutes (i.e., 1 part in 30 millionth of the sky) and BCGs are expected to be very rare at , our discovery of even one such BCG being a cD was a total surprise and is certainly fortuitous by any expectation. Beyond the following discussion of the implications for the early and later formation of some cDs, our discovery hints that many other BCGs might be found with such extended cD halos, if more areas or clusters were covered with deep enough images.
A clue to the early formation of cDs comes from the SEDs of both the inner component and outer envelope of this cD galaxy; the SEDs match those of old, passively-evolving stellar populations. Assuming that such cD envelopes originate from dry mergers (see Liu et al. 2008), our discovery of even one such example at proves that some BCGs entered the dry merger phase at epochs earlier than , a result consistent with recent simulations by Laporte et al. (2013).
Next, we explore the possible evolution of our cD galaxy to today by comparing its structural parameters (i.e., mass, size, and velocity dispersion) to those of the more massive cDs in the local Universe. The stellar masses of local cDs were derived using the same CB07 models with the same Salpeter IMF, solar metallicity, and a Calzetti extinction law (Calzetti et al. 2000) as adopted for deriving the mass of our cD galaxy. The SEDs used Petrosian magnitudes in bands from the Sloan Digital Sky Survey and the extrapolated magnitudes in bands from the Two Micron All Sky Survey Extended Source Catalog (2MASS XSC). The final masses were re-scaled by adding the differences between the Sloan -band Petrosian magnitudes and isophotal magnitudes measured within .
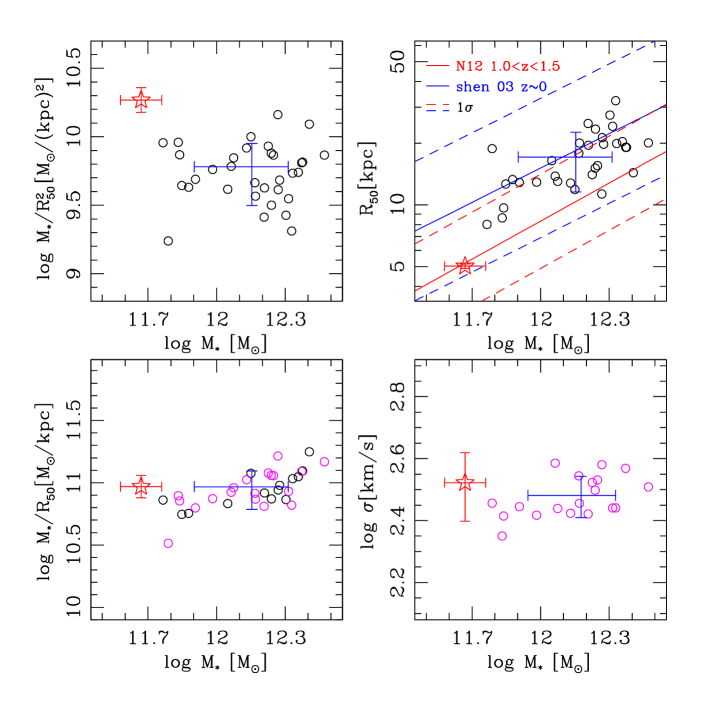
The -band isophotal half-light radius of nearby BCGs within were measured by Liu et al. (2008). To make the comparison at the same rest-frame bandpass, we applied the best-fit global SEDs of GOODS-S J033237.19-274608.1 to convert the observed -band surface brightness profile to the rest-frame Sloan -band. The surface brightness profile has also been corrected for the cosmological dimming of 10 log (1+z). The corresponding stellar mass and half-light radius of GOODS-S J033237.19-274608.1 within in the rest-frame -band are and , respectively. These errors include both random errors and errors from the band shifting and PSF effects. There are 64 nearby BCGs with log out of the 85 BCGs in Liu et al. (2008), 33 of which have and can be classified as cD galaxies with high probability. 19 of those 33 nearby cDs have the measured velocity dispersions available in Liu et al. (2008). We derived a velocity dispersion of for GOODS-S J033237.19-274608.1 from its optical spectroscopy, which is consistent with the value () estimated by van der Wel et al. (2005, corresponding to ID CDFS-18 in their paper). We show the stellar mass surface densities ()111The stellar mass surface density is actually is , but we omit the constants., sizes (), (sometimes used to infer velocity dispersion, see Franx et al., 2008) 222The true stellar velocity dispersion is , where M is the total mass including stars, gas, and dark matter. Franx et al. (2008) provide a value of the coefficient through the fitting of a sample of SDSS galaxies: . , and velocity dispersion () as a function of stellar masses of this high-redshift cD galaxy and more-massive, nearby cDs in Fig. 6, respectively.
The distant cD galaxy clearly has a higher stellar mass surface density (i.e., more compact) but a similar velocity dispersion () to those of more-massive, nearby cDs. It lies, however, on the same mass-size relation as the bulk of quiescent galaxies at similar redshift (), as derived by Newman et al. (2012). The more-massive, nearby cDs, in contrast, lie on the mass-size relation (within the scatter) derived by Shen et al. (2003) who used Petrosian-based quantities. To evolve the distant cD galaxy into one of the more massive nearby cDs, its size and stellar mass have to increase, on average, by factors of and over the past Gyrs.
As mentioned in the introduction, recent studies from both numerical simulations and observations show that BCGs accumulate a large part of their stellar mass via dry mergers at . Ruszkowski & Springel (2009) first investigated the effect of dry mergers on the scaling relations of BCGs in simulations. Laporte et al. (2012) argued, however, that the stellar masses and sizes of the final merger remnants derived from the Ruszkowski & Springel simulations were too massive () and large () compared to real BCGs at . They thus revised the simulations of Ruszkowski & Springel by including the effects of initial compactness on the subsequent evolution of the mass-size relation of the BCGs (Laporte et al. 2012). The revised simulations showed that the size evolution of the most extended BCGs (e.g., cDs) at high redshift scale linearly with stellar mass (). Nipoti et al. (2009) also investigated the dry-merging evolution scenario based on a set of simulations and showed that major and minor dry mergers increase half-light radius with stellar mass as but have little effects on velocity dispersion (). The reasonable agreement between our observations and theoretical predications mentioned above shows that the continuance of dry mergers at can result in structures similar to those of massive cD galaxies seen today and thus support the view that dry mergers play an important role in the late evolution of cD galaxies.
References
- Ascaso et al. (2011) Ascaso, B., Aguerri, J. A. L., Varela, J., Cava, A., Bettoni, D., Moles, M., & D’Onofrio, M. 2011, ApJ, 726, 69
- Balestra et al. (2010) Balestra, I., Mainieri, V., Popesso, P., et al. A&A, 512, A12
- Beckwith et al. (2006) Beckwith, S. V. W., Stiavelli, M., Koekemoer, A. M., et al. 2006, AJ, 132, 1729
- Beers et al. (1990) Beers, T. C., Flynn, K., & Gebhardt, K. 1990, AJ, 100, 32
- Bernardi et al. (2007) Bernardi, M., Hyde, J. B., Sheth, R. K., Miller, C. J., & Nichol, R. C. 2007, AJ, 133, 1741
- Best et al. (1998) Best, P. N., Longair, M. S., & Roettgering, H. J. A. 1998, MNRAS, 295, 549
- Bouwens et al. (2010) Bouwens, R. J., Illingworth, G. D., Oesch, P. A., et al. 2010, ApJ, 709, L133
- Brough et al. (2005) Brough, S., Collins, C. A., Burke, D. J., Lynam, P. D., & Mann, R. G. 2005, MNRAS, 364, 1354
- Bruzual & Charlot (2003) Bruzual, G. & Charlot, S. 2003, MNRAS, 344, 1000
- Calzetti et al. (2000) Calzetti, D., Armus, L., Bohlin, R. C., Kinney, A. L., Koornneef, J., & Storchi-Bergmann, T. 2000, ApJ, 533, 682
- Cooper et al. (2012) Cooper, M. C., Yan, R., Dickinson, M., et al. 2012, MNRAS, 425, 2116
- De Lucia & Blaizot (2007) De Lucia, G. & Blaizot, J. 2007, MNRAS, 375, 2
- de Vaucouleurs (1948) de Vaucouleurs G., 1948, Ann. Astrophys., 11, 247
- Fabian (1994) Fabian, A. C. 1994, ARA&A, 32, 277
- Franx et al. (2008) Franx, M., van Dokkum, P. G., Schreiber, N. M. F., Wuyts, S., Labbé, I., & Toft, S. 2008, ApJ, 688, 770
- Gallagher & Ostriker (1972) Gallagher, III, J. S. & Ostriker, J. P. 1972, AJ, 77, 288
- Giavalisco et al. (2004) Giavalisco, M., Dickinson, M., Ferguson, H. C., et al. 2004, ApJ, 600, L103
- Gonzalez et al. (2005) Gonzalez, A. H., Zabludoff, A. I., & Zaritsky, D. 2005, ApJ, 618, 195
- Graham et al. (1996) Graham, A., Lauer, T. R., Colless, M., & Postman, M. 1996, ApJ, 465, 534
- Grogin et al. (2011) Grogin, N. A., Kocevski, D. D., Faber, S. M., et al. 2011, ApJS, 197, 35
- Guo et al. (2012) Guo, Y., Giavalisco, M., Cassata, P., et al. 2012, ApJ, 749, 149
- Guo (2013) Guo Y., et al. 2013, Submitted to ApJS
- Koekemoer et al. (2011) Koekemoer, A. M., Faber, S. M., Ferguson, H. C., et al. 2011, ApJS, 197, 36
- Laporte et al. (2013) Laporte, C. F. P., White, S. D. M., Naab, T., & Gao, L. 2013, ArXiv e-prints
- Laporte et al. (2012) Laporte, C. F. P., White, S. D. M., Naab, T., Ruszkowski, M., & Springel, V. 2012, MNRAS, 424, 747
- Lauer et al. (2007) Lauer, T. R., Faber, S. M., Richstone, et al. 2007, ApJ, 662, 808
- Lidman et al. (2012) Lidman, C., Suherli, J., Muzzin, A., et al. 2012, MNRAS, 427, 550
- Liu et al. (2009) Liu, F. S., Mao, S., Deng, Z. G., Xia, X. Y., & Wen, Z. L. 2009, MNRAS, 396, 2003
- Liu et al. (2008) Liu, F. S., Xia, X. Y., Mao, S., Wu, H., & Deng, Z. G. 2008, MNRAS, 385, 23
- Matthews et al. (1964) Matthews, T. A., Morgan, W. W., & Schmidt, M. 1964, ApJ, 140, 35
- Naab et al. (2009) Naab, T., Johansson, P. H., & Ostriker, J. P. 2009, ApJ, 699, L178
- Merritt (1985) Merritt, D. 1985, ApJ, 289, 18
- Newman et al. (2012) Newman, A. B., Ellis, R. S., Bundy, K., & Treu, T. 2012, ApJ, 746, 162
- Nipoti et al. (2009) Nipoti, C., Treu, T., Auger, M. W., & Bolton, A. S. 2009, ApJ, 706, L86
- Ostriker & Hausman (1977) Ostriker, J. P. & Hausman, M. A. 1977, ApJ, 217, L125
- Patel et al. (2006) Patel, P., Maddox, S., Pearce, F. R., Aragón-Salamanca, A., & Conway, E. 2006, MNRAS, 370, 851
- Peng et al. (2002) Peng, C. Y., Ho, L. C., Impey, C. D., & Rix, H.-W. 2002, AJ, 124, 266
- Petrosian (1976) Petrosian, V. 1976, ApJ, 209, L1
- Richstone (1976) Richstone, D. O. 1976, ApJ, 204, 642
- Ruszkowski & Springel (2009) Ruszkowski, M. & Springel, V. 2009, ApJ, 696, 1094
- Salimbeni et al. (2009) Salimbeni, S., Castellano, M., Pentericci, L., et al. 2009, A&A, 501, 865
- Salpeter (1955) Salpeter, E. E. 1955, ApJ, 121, 161
- Schombert (1988) Schombert, J. M. 1988, ApJ, 328, 475
- Sérsic (1968) Sérsic J. L., 1968, Atlas de Galaxias Australes (Cordoba, Argentina: Observatorio Astronomico)
- Shen et al. (2003) Shen, S., Mo, H. J., White, S. D. M., Blanton, M. R., Kauffmann, G., Voges, W., Brinkmann, J., & Csabai, I. 2003, MNRAS, 343, 978
- Stott et al. (2011) Stott, J. P., Collins, C. A., Burke, C., Hamilton-Morris, V., & Smith, G. P. 2011, MNRAS, 414, 445
- Tal & van Dokkum (2011) Tal, T. & van Dokkum, P. G. 2011, ApJ, 731, 89
- Tovmassian & Andernach (2012) Tovmassian, H. M. & Andernach, H. 2012, MNRAS, 427, 2047
- van der Wel et al. (2005) van der Wel, A., Franx, M., van Dokkum, P. G., Rix, H.-W., Illingworth, G. D., & Rosati, P. 2005, ApJ, 631, 145
- Vanzella et al. (2005) Vanzella, E., Cristiani, S., Dickinson, M., et al. 2005, A&A, 434, 53
- Vanzella et al. (2006) Vanzella, E., Cristiani, S., Dickinson, M., et al. 2006, A&A, 454, 423
- Whiley et al. (2008) Whiley, I. M., Aragón-Salamanca, A., De Lucia, G., et al. 2008, MNRAS, 387, 1253
- White (1976) White, S. D. M. 1976, MNRAS, 174, 19
- Zibetti et al. (2005) Zibetti, S., White, S. D. M., Schneider, D. P., & Brinkmann, J. 2005, MNRAS, 358, 949