The COS/UVES Survey of the Magellanic Stream:
II. Evidence for a complex enrichment history of the Stream
from the Fairall 9 sightline
Abstract
We present a multi-wavelength 111Based on observations obtained with the NASA/ESA Hubble Space Telescope, which is operated by the Space Telescope Science Institute (STScI) for the Association of Universities for Research in Astronomy, Inc., under NASA contract NAS5D26555, and on observations collected at the European Organisation for Astronomical Research in the Southern Hemisphere, Chile under Program ID 085.C0172(A). study of the Magellanic Stream (MS), a massive gaseous structure in the Local Group that is believed to represent material stripped from the Magellanic Clouds. We use ultraviolet, optical and radio data obtained with HST/COS, VLT/UVES, FUSE, GASS, and ATCA to study metal abundances and physical conditions in the Stream toward the quasar Fairall 9. Line absorption in the MS from a large number of metal ions and from molecular hydrogen is detected in up to seven absorption components, indicating the presence of multi-phase gas. From the analysis of unsaturated S ii absorption, in combination with a detailed photoionization model, we obtain a surprisingly high abundance in the Stream toward Fairall 9 of [S/H ( solar). This value is 5 times higher than what is found along other MS sightlines based on similar COS/UVES data sets. In contrast, the measured nitrogen abundance is found to be substantially lower ([N/H), implying a very low [N/] ratio of dex. The substantial differences in the chemical composition of MS toward Fairall 9 compared to other sightlines point toward a complex enrichment history of the Stream. We favour a scenario, in which the gas toward Fairall 9 was locally enriched with elements by massive stars and then was separated from the Magellanic Clouds before the delayed nitrogen enrichment from intermediate-mass stars could set in. Our results support (but do not require) the idea that there is a metal-enriched filament in the Stream toward Fairall 9 that originates in the LMC.
Subject headings:
ISM: abundances – Galaxy: halo – Galaxy: evolution – Magellanic Clouds – quasars: absorption lines1. Introduction
The distribution of neutral and ionized gas in the circumgalactic environment of galaxies is known to be an important indicator of the past and present evolution of galaxies. Both the infall of metal-poor gas from intergalactic space and from satellite galaxies and the outflow of metal-rich gaseous material through galactic winds represent key phenomena that determine the spatial distribution and the physical state of the circumgalactic gas around massive galaxies.
From observations and theoretical studies, it is known that galaxy interactions between gas-rich galaxies can transport large amounts of neutral and ionized gas into the circumgalactic environment of galaxies. In the local Universe, the most massive of these extended tidal gas features can be observed in the 21 cm line of neutral hydrogen (H i). The most prominent nearby example of a tidal gas stream produced by the interaction of galaxies is the Magellanic Stream (MS), a massive () stream of neutral and ionized gas in the outer halo of the Milky Way at a distance of kpc (e.g., Wannier & Wrixon 1972; Gardiner & Noguchi 1996; Weiner & Williams 1996; Putman et al. 2003; Brüns et al. 2005; Fox et al. 2005, 2010; Koerwer 2009; Besla et al. 2007, 2010, 2012). The Magellanic Stream spans over 200° on the sky (e.g., Nidever et al. 2010) and has a (mean) metallicity that is lower than that of the Milky Way, but comparable with the metallicity found in the SMC and LMC ( solar; Lu et al. 1994; Gibson et al. 2000; Sembach et al. 2001; Fox et al. 2010, 2013). The MS also contains dust grains and diffuse molecular hydrogen (H2; Sembach et al. 2001; Richter et al. 2001a). A number of theoretical studies, including tidal models and ram-pressure stripping models, have been carried out to describe the Stream’s motion in the extended halo of the Milky Way and pinpoint its origin in one of the two Magellanic Clouds (Gardiner & Noguchi 1996; Mastropietro et al. 2005; Connors et al. 2006; Besla et al. 2010; Diaz & Bekki 2011).
The origin and fate of the Magellanic Stream is closely related to the trajectories of LMC and SMC (e.g., Connors et al. 2004, 2006; Besla et al. 2007), and any realistic model of the MS thus needs to consider the dynamical and physical state of the Milky Way/Magellanic Clouds system as a whole (see also Bland-Hawthorn et al. 2007; Heitsch & Putman 2009). While early tidal models have assumed that the Magellanic Stream is a product from the tidal interaction between LMC and SMC as they periodically orbit the Milky Way (e.g., Gardiner & Noguchi 1996), more recent proper motion measurements of the Magellanic Clouds (MCs) (Kallivayalil et al. 2006a, 2006b, 2013) indicate that the MCs may be on their first passage around the Milky Way. Some subsequent tidal models (Besla et al. 2010; Diaz & Bekki 2011) thus favour a first-infall scenario for the Magellanic Stream. Moreover, while many models (e.g., Connors et al. 2006) place the origin of the Stream’s gaseous material in the SMC, other, more recent studies trace back at least part of the Stream’s gaseous material in the LMC (e.g., Nidever et al. 2008). The latter study also highlights the role of energetic blowouts from star-forming regions in the LMC for the formation of the Stream. Clearly, further theoretical studies and observations are required to pinpoint the origin of the MS based on different (independent) methods.
In the first paper in our series analyzing the chemical and physical conditions in the Magellanic Stream (Fox et al. 2013; hereafter Paper I), we have investigated MS absorption in the UV and optical along the lines of sight toward RBS 144, NGC 7714 PHL 2525, and HE 00563622. In this paper we analyze the MS using UV and optical absorption-line spectra of the Seyfert 1 galaxy Fairall 9 (). Located at and the Fairall 9 sightline lies only 14.3° on the sky from the SMC. This sightline is the best-studied in absorption of all MS directions (Songaila 1981; York et al. 1982; Lu, Savage & Sembach 1994; Gibson et al. 2000; Richter et al. 2001a; Sembach et al. 2003), largely because the Fairall 9 is bright in both the optical and the UV and the Stream’s H i column in this direction is large (log (H i; see Gibson et al. 2000). The high column of neutral gas ensures that a wide range of low-ionization UV metal lines are detectable in the Stream, and even molecular hydrogen was observed in the MS toward Fairall 9 data from the Far Ultraviolet Spectroscopic Explorer (FUSE; Richter et al. 2001a; Wakker 2006). Using a spectrum of Fairall 9 obtained with the Goddard High Resolution Spectrograph (GHRS) onboard the Hubble Space Telescope (HST) together with Parkes 21 cm H i data Gibson et al. (2000) derived a metallicity of the Stream toward Fairall 9 of [S/H ( solar), which represented the most accurate metallicity determination of the Stream from UV absorption line data at that time. This metallicity is consistent with either an SMC or LMC origin of the gas. A difficulty for constraining the origin of the MS in one or the other Magellanic Cloud arises from the fact that the gas in the Stream was stripped from its parent galaxy Gyr ago (e.g., Gardiner & Noguchi 1996; Connors et al. 2006; Nidever et al. 2008), but has not experienced any further metal enrichment since then, while the parent galaxy underwent further chemical evolution. The MS does not contain any massive stars (e.g., Mathewson et al. 1979), in contrast to the Magellanic Bridge (Irwin, Kunkel & Demers 1985). This aspect needs to be taken into account when comparing metal abundances in the Stream with present-day LMC and SMC abundances.
To increase the accuracy of the metallicity determination of the Stream toward Fairall 9 and to obtain more detailed information on the chemical composition of the gas and dust in the Stream, more accurate spectral data are desirable. Because the Magellanic Stream is a massive gas cloud with complex internal kinematics (e.g., Nidever et al. 2008), data with high spectral resolution and a high signal-to-noise (S/N) ratio are required to fully resolve the Stream’s velocity-component structure and to detect weak absorption features from the various metal ions that have their transitions in the ultraviolet (UV) and in the optical. As part of our ongoing project to study the properties of the Magellanic Stream in absorption along multiple lines of sight (see also Paper I) we obtained high-resolution optical data of Fairall 9 from the Ultraviolet and Visible Echelle Spectrograph (UVES) installed on the Very Large Telescope (VLT) and medium-resolution UV data from the Cosmic Origins Spectrograph (COS) onboard the HST, both data sets providing absoption spectra with excellent S/N ratios. The combination of these data sets, as desribed in this study, therefore provides a particular promising strategy to study in great detail the chemical and physical conditions in the Magellanic Stream in this direction.
This paper is organized as follows: in Sect. 2 we describe the observations and the data reduction. The column density measurements and the profile modeling are explained in Sect. 3. In Sect. 4 we derive chemical and physical properties of the gas in the MS. We discuss our results in Sect. 5. Finally, a summary of our study is given in Sect. 6.
2. Observations and spectral analysis
2.1. VLT/UVES observations
Fairall 9 was observed with the VLT/UVES spectrograph (Dekker et al. 2010) in 2010 under ESO program ID 085.C-0172(A) (PI: A. Fox). The observations were taken in Service Mode using Dichroic 1 in the 390+580 setting, a 0.6″ slit, and no rebinning. The observations were carried out under good seeing conditions (0.8″). The raw data were reduced with the standard UVES pipeline, using calibration frames taken close in time to the corresponding science frames. The reduction steps involve subtraction of the bias level, inter-order background, sky background, night sky emission lines, and cosmic ray hits. The frames were then flat-fielded, optimally extracted and merged. The wavelength scale was corrected for atmospheric dispersion and heliocentric velocity and then placed into the local standard of rest (LSR) velocity frame. Multiple exposures on the same target were registered onto a common wavelength grid and then added. The final spectra have a very high spectral resolution of corresponding to a FWHM of km s-1. They cover the wavelength range between and Å. The S/N ratio per resolution element is at Å (Ti ii), at Å (Ca ii), and at Å (Na i). The UVES data thus provide much higher sensitivity and substantially higher spectral resolution than previous optical measurements of Fairall 9 (Songaila 1981).
2.2. HST/COS observations
Fairall 9 was observed with the HST/COS spectrograph (Green et al. 2012) in 2012 under HST program ID 12604 (PI: A. Fox). A four-orbit visit provided a total of 5378 s of exposure time with the G130M/1291 wavelength setting, and 6144 s with the G160M/1589 setting. With each grating, all four FP-POS positions were used to dither the position of the spectrum on the detector to reduce the fixed-pattern noise. The raw data were processed and combined with the CALCOS pipeline (v2.17.3). For the coaddition of the individual exposures we used interstellar absorption lines as wavelength reference. The final, co-added spectra then were transformed into the LSR velocity frame. The COS data cover the UV wavelength range between and Å. The spectra have a resolution of (FWHM km s-1) and a pixel size of km s-1. The S/N ratio per resolution element is at Å and at Å.
In order to minimize geocoronal emission, which contaminates the absorption lines of O i , Si ii and H i Ly in the velocity range km s km s-1 during orbital daytime, we re-reduced the data with a night-only extraction. For this, data were extracted from those time intervals when the Sun’s altitude was less than degrees.
2.3. FUSE observations
As part of our study we also re-analyze archival FUSE spectra of Fairall 9. These spectra were obtained in 2000 under FUSE program ID P101 (PI: K.R. Sembach) with a total exposure time of 34 827 s. They show strong molecular hydrogen absorption arising in the MS, as presented by Richter et al. (2001a). The FUSE spectra have a resolution of km s-1 (FWHM), and cover the wavelength range Å. The raw data were reduced using the CALFUSE pipeline v3.2.1. The individual exposures were carefully coadded using interstellar lines as wavelength reference. Unfortunately, the S/N in the FUSE data is very low, which severely hampers the analysis of absorption lines (see also Richter et al. 2001a; Wakker 2006). From a detailed inspection of the individual spectra in the different segments we conclude that only the data from the lithium-fluoride coated segment 1A (LiF 1A) can be properly coadded without introducing large systematic errors in the flux distribution in the spectrum. In the coadded LiF 1A data, that are used by us to re-analyze the H2 absorption in the MS, we measure a S/N of per resolution element at Å. Only for the wavelength range Å does the S/N ratio rise up to a maxium of per resolution element due to the increased background flux from the broad, redshifted Ly emission from Fairall 9.
2.4. GASS 21cm observations
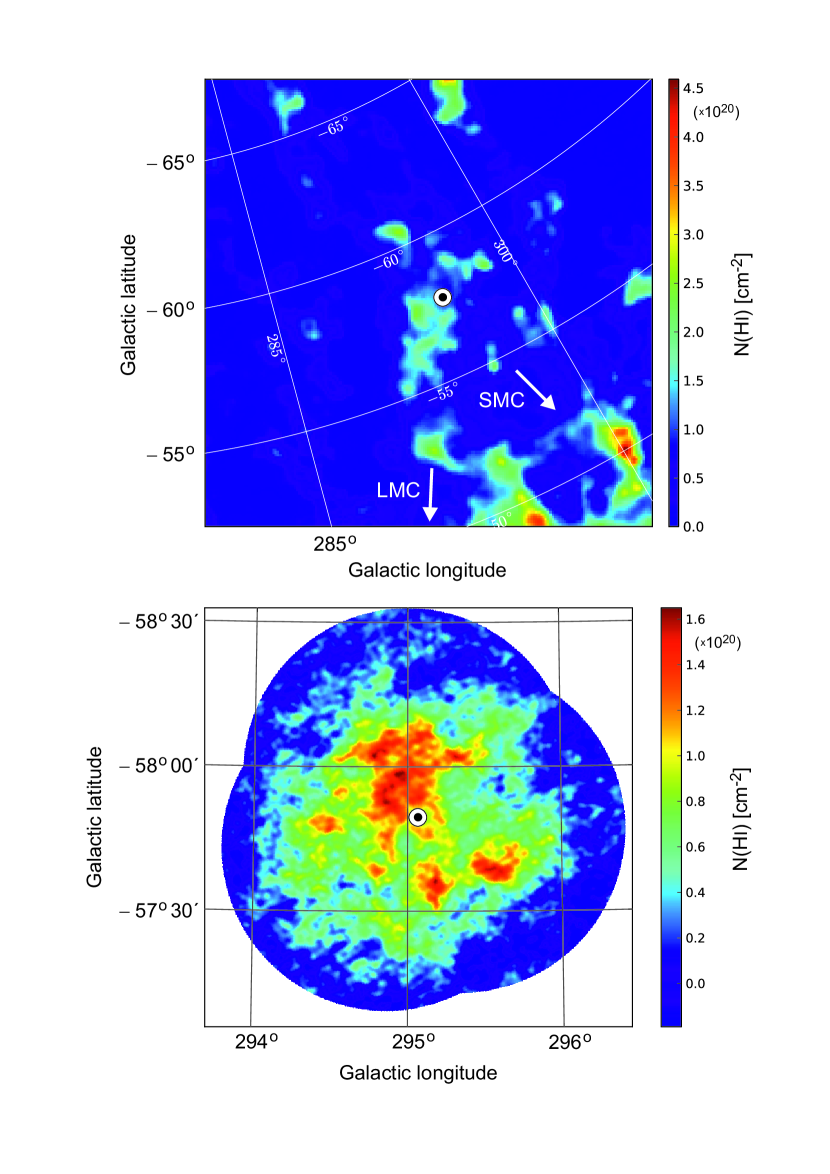
The H i 21cm data for the Fairall sightline were taken from the Galactic-All Sky Survey (GASS, McClure-Griffiths et al. 2009, Kalberla et al. 2010). The survey was observed with the 64-m radio telescope at Parkes. The data cubes have an angular resolution of , leading to an RMS of per spectral channel (). This value translates to an H i column density detection limit of (H i cm-2, assuming a Gaussian-like emission line with a width of FWHM. Fig. 1, upper panel, shows an H i column density map of the local environment of the Magellanic Stream centered on Fairall 9 based on the GASS 21cm data.
2.5. ATCA 21cm data
We supplement our measurements with higher-resolution H i data obtained with the Australia Compact Telescope Array (ATCA). The data in the direction of Fairall 9 were observed in 1998 and 1999 by Mary Putman using the 750A, 750B, and 750D configurations. The ATCA is an east-west interferometer with six antennas. Each antenna has a diameter of 22 m. For the observations a correlator band width of 4 MHz was chosen, resulting in a velocity resolution of about km s-1. Since the Fairall 9 cloud is too large to fit within a single pointing a mosaic consisting of three fields was made. The observing time for each of these three fields was 12 hours leading to a full u-v coverage. The FWHM of the synthesized ATCA beam is .
The ATCA data set was reduced by Christian Brüns with the MIRIAD software. To circumvent the missing short-spacings problem, single-dish data from the Parkes telescope were used. Image deconvolution and combination with the single-dish data were performed with the Miriad-Task MOSMEM. The Parkes data used for the short-spacings correction were obtained in the framework of an H i survey of the Magellanic System (see Brüns et al. 2005 for details).
2.6. Spectral analysis methods
Our strategy for the analysis of the optical and UV absorption-line data of Fairall 9 combines different techniques to optimally account for the different spectral resolutions and S/N in the data. The reduced and coadded spectra from UVES, COS, and FUSE first were continuum-normalized using low-order polynomials that were were fit locally to the spectral regions of interest.
For the high-resolution VLT/UVES data we have used Voigt-profile fitting to decompose the MS absorption pattern in the optical lines of Ca ii, Na i, and Ti ii into individual absorption components (Voigt components) and to derive column densities () and Doppler parameters ( values) for the individual components. For the fitting, we made use of the FITLYMAN package implemented in the ESO-MIDAS analysis software (Fontana & Ballester 1995). Laboratory wavelengths and oscillator strengths have been taken from the compilation of Morton (2003). Note that with our fitting technique we are able to measure values smaller than the intrumental resolution as we simultaneously fit the line doublets of Ca ii and Na i, so that relative strengths of the lines are taken into account for the determination of both and . From this fitting procedure we obtain a component model for the Fairall 9 sightline, in which the LSR velocity centroids of the individual absorption components and the values for the low ions are defined.
In addition to Voigt-profile fitting, we have used the apparent optical depth method (AOD method; Savage & Sembach 1991) to derive total gas column densities for the (unsaturated) optical absorption profiles of Ca ii, Na i, and Ti ii. The AOD analysis was made using the custom-written MIDAS code span that allows us to measure equivalent widths and AOD column densities (and their errors) in absorption spectra from a direct pixel integration.
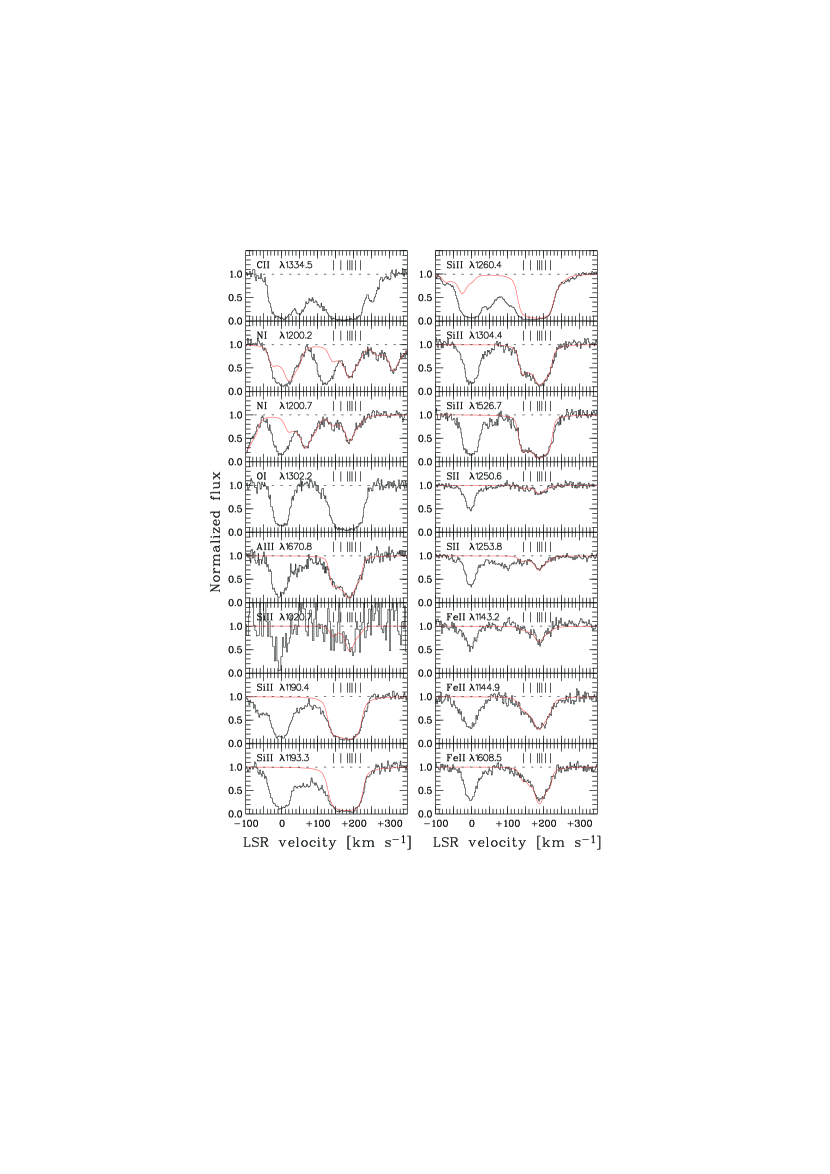
For the medium-resolution HST/COS data we have used profile modeling and the AOD method to derive column densities and column density limits for the various different low, intermediate, and high ions that have detectable transitions in the COS wavelength range. The ion transitions in the COS data considered in this study include C ii , C ii⋆ , C iv , N i , N v , O i , Al ii , Si ii , Si iii , Si iv , P ii , S ii , Fe ii , and Ni ii . For the profile modeling of neutral and singly-ionized species that trace predominantly neutral gas in the MS we have used as input the component model defined by the optical Ca ii absorption (see above). In this model, the LSR velocities and values of the seven absorption components are constrained by the Ca ii fitting results, while the column density for each component is the main free parameter that can be varied for each ion listed above. Our previous studies of Ca ii in the Galactic halo (Richter et al. 2005, 2009; Ben Bekhti et al. 2008, 2011; Wakker et al. 2007, 2008) and in intervening absorbers at low redshift (Richter et al. 2011) have demonstrated that Ca ii is an an excellent tracer for the distribution of neutral and partly ionized gas and its velocity-component structure, even in regions where Ca ii is not the dominant ionization state.
Based on the Ca ii model, and using a modified version of FITLYMAN, we have calculated for each individual UV line a synthetic absorption profile, for which we have convolved an initial Voigt profile with input parameters for with the COS line-spread function (LSF) that is appropriate for the wavelength of the line. For the COS LSF we have used the improved LSF model described by Kriss (2011). Then, the columns were varied to minimize the differences between the synthetic absorption profile and the observed COS data. This method delivers reliable (total) column densities for those ions that have multiple transitions with substantially different oscillator strengths in the COS wavelength range and for individual lines that are not fully saturated. More details about the accuracy of this method are presented in Sect. 3.1 and in the Appendix.
For the intermediate and high ions (Si iii, Si iv, C iv) the component structure and values are expected to be different from that of the low ions (as the gas phase traced by these ions often is spatially distinct from the gas phase traced by the low ions), but no information is available on the true component structure of these ions from the optical data. Therefore, we did not try to model the absorption profiles of the high-ion lines, but estimated total column densities (and limits) for these ions solely from the AOD method. Similarly, we used solely the AOD method to determine the column density of C ii⋆.
For the analysis of H2 in the Magellanic Stream detected in the Fairall 9 FUSE data (Richter et al. 2001a), we have modeled the H2 absorption using synthetic spectra generated with FITLYMAN. As model input we take into accout the component structure and line widths seen in the optical Ca ii/Na i absorption, together with a Gaussian LSF according to the FUSE spectral resolution. H2 wavelengths and oscillator strengths have been adopted from Abgrall & Roueff (1989). Details on the H2 modeling are presented in Sect. 3.3.
3. Column-density measurements
3.1. Metal absorption in the optical
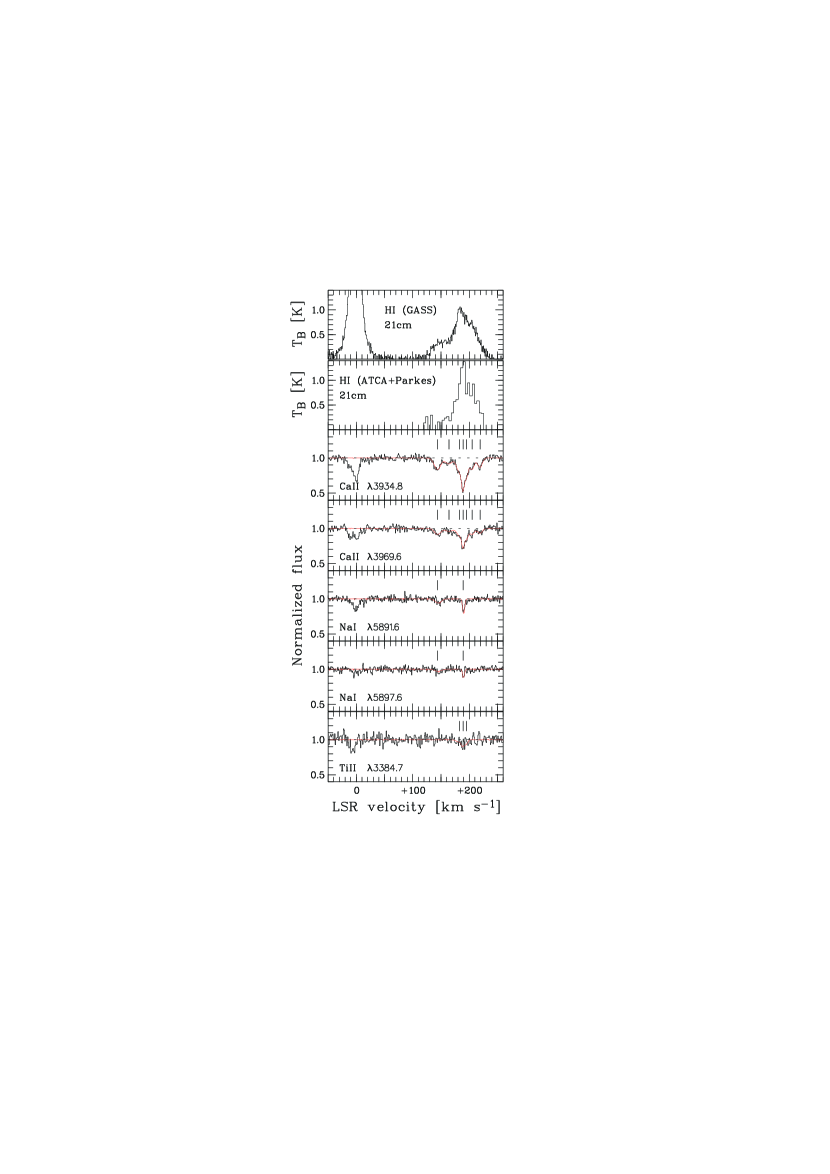
Optical absorption related to gas in the Magellanic Stream in the velocity range km s-1 (this velocity range is defined by the H i 21 cm data of the Stream) is detected in the UVES spectrum of Fairall 9 in the lines of Ca ii (), Na i (), and Ti ii (). Fig. 2 shows the normalized absorption profiles of these ions plotted on the LSR velocity scale together with the H i 21cm emission profiles from GASS and ATCA. Ca ii absorption is detected in seven individual absorption components centered at and km s-1 with logarithmic column densities in the range log (Ca ii (where is in units [cm-2] throughout the paper). The red solid line in Fig. 2 indicates the best Voigt-profile fit to the data. All Ca ii, Na i and Ti ii column-density measurements are summarized in Table 1.
| Component | 1 | 2 | 3 | 4 | 5 | 6 | 7 | |||
|---|---|---|---|---|---|---|---|---|---|---|
| [km s-1] | ||||||||||
| [km s-1] | ||||||||||
| [km s-1] | ||||||||||
| Ion | Instrument | log | log | log | log | log | log | log | log | log |
| H i | GASS | … | … | … | … | … | … | … | … | |
| Na i | VLT/UVES | … | … | … | … | … | ||||
| Ca ii | VLT/UVES | |||||||||
| Ti ii | VLT/UVES | … | … | … | … | |||||
| C i | HST/COS | … | … | … | … | … | … | … | … | |
| C ii | HST/COS | … | … | … | … | … | … | … | … | |
| C ii⋆ | HST/COS | … | … | … | … | … | … | … | … | |
| C iv | HST/COS | … | … | … | … | … | … | … | … | |
| N i | HST/COS | |||||||||
| O i | HST/COS | … | … | … | … | … | … | … | … | |
| Al ii | HST/COS | |||||||||
| Si ii | HST/COS | |||||||||
| Si iii | HST/COS | … | … | … | … | … | … | … | … | |
| Si iv | HST/COS | … | … | … | … | … | … | … | … | |
| P ii | HST/COS | … | … | … | … | … | … | … | … | |
| S ii | HST/COS | |||||||||
| Fe ii | HST/COS | |||||||||
| Ni ii | HST/COS | … | … | … | … | … | … | … | … |
The strongest Ca ii absorption component in the MS (in terms of the absorption depth) is component 4 at km s-1; this very narrow component is also detected in both Na i lines (Fig. 2). From the simultaneous fit of the Ca ii and Na i doublets we obtain a very small Doppler parameter for component 4 of km s-1. The small value for this component is confirmed by fits to the individual lines of Ca ii and Na i, which all imply km s-1. The detection of Na i together with the small value indicates that the gas in component 4 is relatively cold and dense and possibly is confined in a dense core with little turbulence. Components 3,4, and 5 are also detected in Ti ii (Fig. 2). Since Ti ii and H i have almost identical ionization potentials (Table 2), the detection of Ti ii suggests that most of the neutral gas column density is contained in these three components. This conclusion is supported by the H i 21cm emission profiles from GASS and ATCA (Fig. 2; first two panels), which also have their maxima in the velocity range between and km s-1. Weak and relatively broad ( km s-1) Na i absorption is also detected in component 1 at km s-1.
As mentioned in Sect. 2.5, we also have used the AOD method to determine the total column densities for Ca ii, Na i and Ti ii by integrating over the velocity range relevant for MS absorption (i.e., km s km s-1.) The column densities derived by these two different methods agree very well within their error ranges (see Table 1, rows 10 and 11).
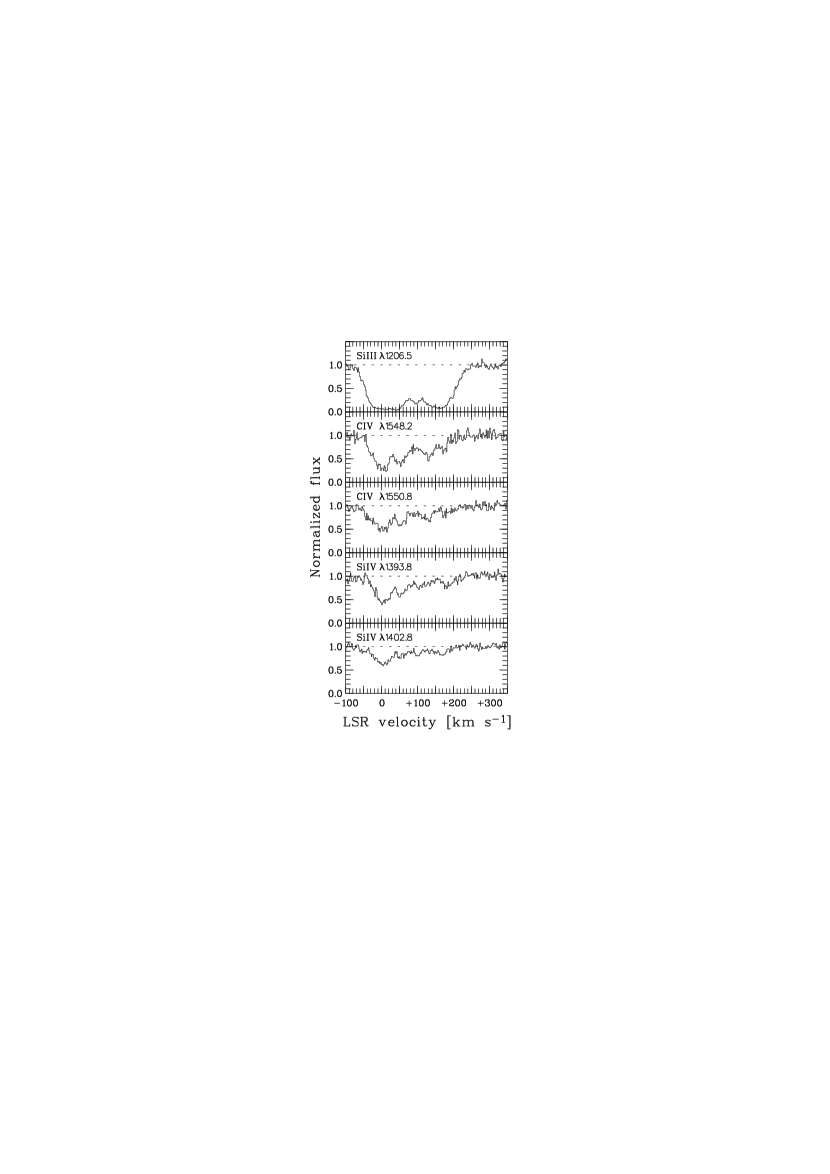
3.2. Metal absorption in the UV
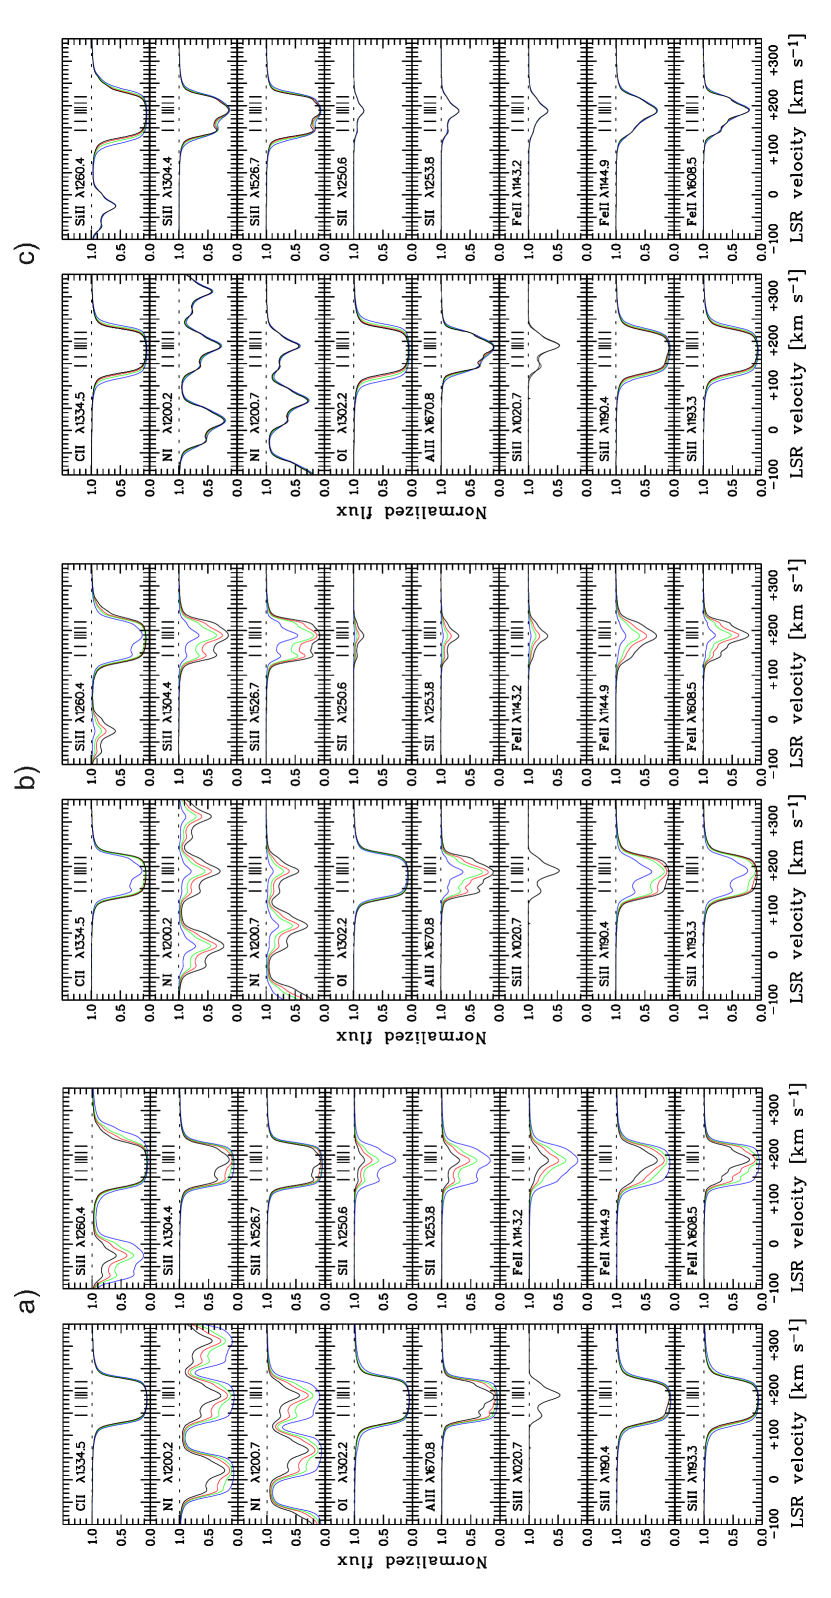
In Fig. 3 we show normalized UV absorption profiles of the low ions C ii, N i, O i, Al ii, Si ii, S ii, and Fe ii. The absorption profiles of the intermediate and high ions Si iii, C iv and Si iv are shown in Fig. 4. Following the procedure described in Sect. 2.5, we have reconstructed the absorption pattern of UV metal lines of the low ions, using the component model defined by the optical lines of Ca ii. As already mentioned, the modeling method provides relevant results only for those ions that have multiple transitions in the available COS wavelength band and for single lines that are not (or at most mildly) saturated. In our case, the modeling method could be used to determine column densities for N i, Al ii, Si ii, S ii, and Fe ii, while for the fully saturated (single) lines of C ii and O i the modeling does not yield relevant column density limits. In Fig. 3, the best-fitting column-density model for each ion is overlaid with the red solid line. The best-fitting model assumes the same values for the individual subcomponents as derived for Ca ii from the Voigt fit of the UVES data. The ion column densities for each velocity component are listed in Table 1 in rows ; the total column density for each ion is given in row 10. As can be seen in Fig. 3, the absorber model successfully reproduces the shape of the absorption lines in the UV.
From Table 1 follows that the relative column-densities in the seven velocity components differ slightly from ion to ion. These differences are expected, because most ions have different ionization potentials and therefore trace slightly different gas phases within the absorber. In addition, differential dust depletion for some elements may also be relevant in this context. Because of the relatively limited spectral resolution of the COS instrument and the resulting overlap between neighbouring velocity components the accuracy for the determination of the column densities for individual subcomponents is relatively low ( dex, typically). Much better constrained are the total column densities (Table 1, row 10) for the ion multiplets N i, S ii, Si ii and Fe ii, which have uncertainties dex. This is because the integrated (total) column density for each of these ions is determined predominantly by the integrated equivalent widths of the weaker lines and the equivalent width ratios of the weaker and stronger transitions. In the Appendix we present additonal model plots to provide a more detailed insight into the allowed parameter range for the individual subcomponents and their impact on the shape of the absorption profiles and total column-density estimates.
Next to the absorption modeling we have used the AOD method to determine total column densities (or column-density limits) in the COS data for each of the ions listed above (Table 1, row 11). For the unsaturated lines of S ii, Si ii, and Fe ii the total column densities derived from the AOD method are in excellent agreement () with the total column densities determined from the profile modeling. Note that the absorption of C ii⋆ in the MS will be discussed separately in Sect. 4.4.
3.3. H i 21cm emission
The GASS 21cm velocity profile shown in the upper panel of Fig. 2 indicates H i emission from gas in the Magellanic Stream in the LSR velocity range between and km s-1. The MS emission shows an asymmetric pattern with a peak near km s-1, surrounded by weaker satellite componets at lower and higher radial velocities. The overall shape of the emission profile mimics that of the inversed absorption profiles of the low-ion lines of N i and S ii indicating that both the pencil-beam absorption data and the GASS emission data, that have a beam-size of , sample the same physical structure. Integrating the GASS data in the above given velocity range for the single pixel that covers the position of Fairall 9 we obain a total H i column density in the Stream of log (H i ((H i cm-2). The pixel value is somewhat smaller than the beam-averaged column density, which is log (H i.
In the second panel of Fig. 2 we show the 21cm emission profile for the Fairall 9 direction from the high-resolution ATCA data in the LSR velocity range between and km s-1. Because of the relatively low S/N in the ATCA data, the spectrum shown in Fig. 2 was binned for displaying purposes to km s-1 wide pixels. The overall shape of the profile from the ATCA data is roughly similar to the one from GASS, but in the ATCA spectrum the MS 21cm emission peaks at a somewhat higher velocity ( km s-1, thus coinciding with the peak absorption in Ca ii and Na i; see Fig. 2) and at a slightly higher brightness temperature. The MS emission profile from ATCA is, however, somewhat narrower than the GASS profile. Integration over the MS velocity range in the (unbinned) ATCA data yields a total H i column density in the Stream of (H i cm-2 or log (H i, thus in excellent agreement with the GASS data.
For comparison, Gibson et al. (2000) find log (H i ((H i cm-2) using Parkes 21cm observations of Fairall 9 with a beam size of . From the 21cm data of the Leiden-Argentine-Bonn Survey (LAB; Kalberla et al. 2005) with resolution we obtain for the same velocity range an H i column density in the Stream of log (H i.
The H i column densities in the MS toward Fairall 9 derived from different instruments with very different angular resolutions agree with each other within their error ranges. Our conclusion is that beam smearing is not expected to be a critical issue for the determination of metal abundances in the MS toward Fairall 9 (using 21cm data in combination with the pencil-beam UVES and COS data). In the following, we adopt the value of log (H i for the total H i column density in the Stream toward Fairall 9 together with an appropriate estimate of the systematic error of dex that accounts for the limited spatial resolution of the 21cm data.
As it is shown in the Appendix, this H i column density in the MS is in agreement with the observed shape of the H i Ly absorption line in the COS data of Fairall 9, which provides an independent (albeit less stringent) measure for the neutral-gas column density in the Stream in this direction (see also Wakker, Lockman, & Brown 2011 for a detailed discussion on this topic).
3.4. Molecular hydrogen absorption
The detection of H2 absorption in the Magellanic Stream in the FUSE data of Fairall 9 has been reported previously by Richter et al. (2001a) and Wakker (2006). H2 absorption is seen near km s-1 in the rotational levels and . Although the overall S/N in the FUSE data is low ( per resolution element; see Sect. 2.5), the H2 absorption is clearly visible in many lines due to the relatively high H2 column density (Richter et al. 2001a).
| a [km s-1] | log b | [K]c | |
|---|---|---|---|
| Sum |
We have reanalyzed the Fairall 9 FUSE data based on an improved data reduction pipeline and the component model discussed in the previous sections. Richter et al. (2001a) have used a curve-of-growth technique to derive the column densities and values of the H2 rotational states , assuming as single MS absorption component. In contrast, we here model the absorption spectrum of the MS H2 absorption in the FUSE Fairall 9 data using synthetic spectra. For our model we assume that the H2 absorption arises in the region with the highest gas density in the Stream, which is component 4 at km s-1 detected in the UVES data in Ca ii, Na i, and Ti ii (Table 1). In fact, from absorption studies of Na i and H2 in interstellar gas it is well known that these two species trace the same gas phase (i.e., cold neutral and cold molecular gas; e.g., Welty et al. 2006).
We adopt km s-1 for the H2 absorption in component 4, as suggested by the Na i and Ca ii absorption in the same component (Table 1). We further assume (and prove later) that the kinetic temperature of the H2 absorbing gas is K in component 4. It is usually assumed that the Doppler parameter is composed of a turbulent and a thermal component, so that . For light elements and molecules (such as H2) must not be neglected. We therefore adopt (H km s-1 for our H2 model spectrum.
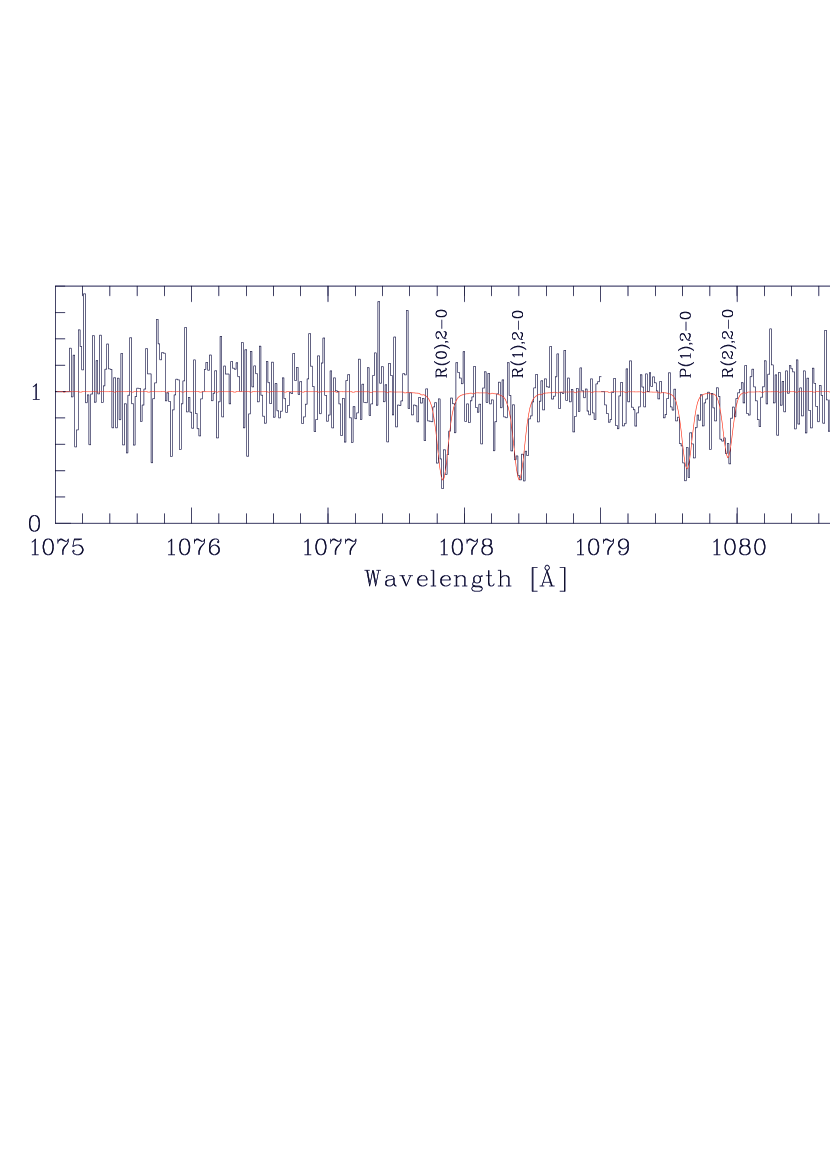
Fig. 5 shows our best fitting H2 model (red solid line) together with the FUSE data for the wavelength range between and Å. Since the value is fixed to (H km s-1 and the velocity to km s-1, the only free parameters in our model are the H2 column densities . Table 2 summarizes the best fitting H2 column densities using this method. The given errors represent the uncertainties for log under the assumption that km s-1. The resulting total H2 column density is log (H and the fraction of hydrogen in molecular form is log log H(H iH. Note that the value for log derived in this way represents a sightline-average; the local molecular fraction in the H2 absorbing region must be higher (because (H i) in this region is smaller).
The H2 column densities we derive from our spectral modeling are substantially ( dex) higher than the values presented in the earlier studies of the Fairall 9 FUSE data (Richter et al. 2001a; Wakker 2006). The reason for this discrepancy is the substantially lower value that we adopt here. This more realistic value for the H2 absorbing gas is a direct consequence of the previously unknown complex absorption pattern in the MS toward Fairall 9, that is visible only in the high-resolution optical data of Ca ii and Na i (see Sect. 3.1). Our study suggests, that, without the support of high-resolution and high S/N optical or UV data that can be used to resolve the true sub-component structure of the absorbers and to deliver reliable values for the subcomponents, the interpretation of interstellar H2 absorption lines in low-resolution and low-S/N data from FUSE can be afflicted with large systematic uncertainties.
4. Physical and chemical conditions in the gas
4.1. Ionization conditions and overall metallicity
The presence of high, intermediate and low ions, as well as molecular hydrogen, in the Magellanic Stream toward Fairall 9 in seven individual velocity components implies a complex multi-phase nature of the gas. To obtain meaningful results for the chemical composition and physical conditions from the measured ion column densities it is necessary to consider in detail the ionization conditions in the absorbing gas structure. For an element M we define its relative gas-phase abundance compared to the solar abundance in the standard way [M/H] = log (M/H) log (M/H)☉. Solar reference abundances have been adopted from Asplund et al. (2009).
The best ion to study the overall metallicity of neutral and weakly ionized interstellar gas is O i. Neutral oxygen and neutral hydrogen have similar ionization potentials and there is a strong charge-exchange reaction that couples both ions in gas with sufficiently high density. For our sightline, however, the O i column density is not well constrained because of the saturation of the O i line and the lack of other, weaker O i transitions in the COS wavelength range. Because it is impossible to measure the O i column density in the MS using our component models and the AOD method to a satisfactory accuracy, we do not further consider the O i line for our analysis.
For the determination of the overall metallicity of the gas in the Magellanic Stream toward Fairall 9 we choose instead S ii, which is another useful ion for measuring interstellar abundances, as singly-ionized sulfur is an excellent tracer for neutral hydrogen without being depleted into dust grains (e.g., Savage & Sembach 1996). We also have a very accurate column-density determination of log (S ii in the Magellanic Stream, based on the absorption modeling of the two S ii lines at and Å and (independently) from the AOD method (see Table 1). Our value is slightly higher than the S ii column density of log (S ii derived by Gibson et al. (2000) from HST/GHRS data.
From the measured (S ii/H i) ratio we obtain an initial estimate of the sulfur abundance in the Stream toward Fairall 9 of [S/H. Since the ionization potential of S ii (23.2 eV; see Table 3) is higher than that of H i (13.6 eV), we have to model the ionization conditions in the gas to obtain a more precise estimate for the sulfur abundance (and the abundances of the other detected metals) in the Stream toward Fairall 9. While previous studies of Galactic halo clouds (Wakker et al. 1999; Gibson et al. 2000) have demonstrated that the (S ii/H i) ratio is a very robust measure for the sulfur-to-hydrogen ratio, hardly being affected by the local ionizing radiation field, the ionization modeling is important to obtain a relibale estimate of the systematic uncertainty that arises from the use of S ii as reference indicator for the overall abundance in the gas. For this task, we use the photoionization code Cloudy (v10.00; Ferland et al. 1998), which calculates the expected column densities for different ions as a function of the ionization parameter for a gas slab with a given neutral gas column density and metallicity, assuming that the slab is illuminated by an external radiation field. As radiation field we adopt a combined Milky Way plus extragalactic ionizing radiation field based on the models by Fox et al. (2005) and Bland-Hawthorn & Maloney (1999,2002), appropriately adjusted to the position of the MS relative to the Milky Way disk.
While our absorption modeling provides rough estimates for the ion column densities in the seven sub-components, we refrain from trying to model the ionization conditions in the individual components. This is because the unknown H i column densities in these components, together with the unknown geometry of the overall gas structure, would lead to large systematic uncertainties for such models. Instead, we have used Cloudy to obtain integrated elemental abundances in the gas of the Magellanic Stream toward Fairall 9 (representing the optical-depth weighted mean of the individual element abundances in all subcomponents). It is, however, important to emphasize that meaningful results for integrated elemental abundances from Cloudy can be obtained only for those ions for which the column densities in the ionization model do not strongly depend on the gas density (and ionization parameter), because the latter quantities are expected to vary substantially among the individual subcomponents.
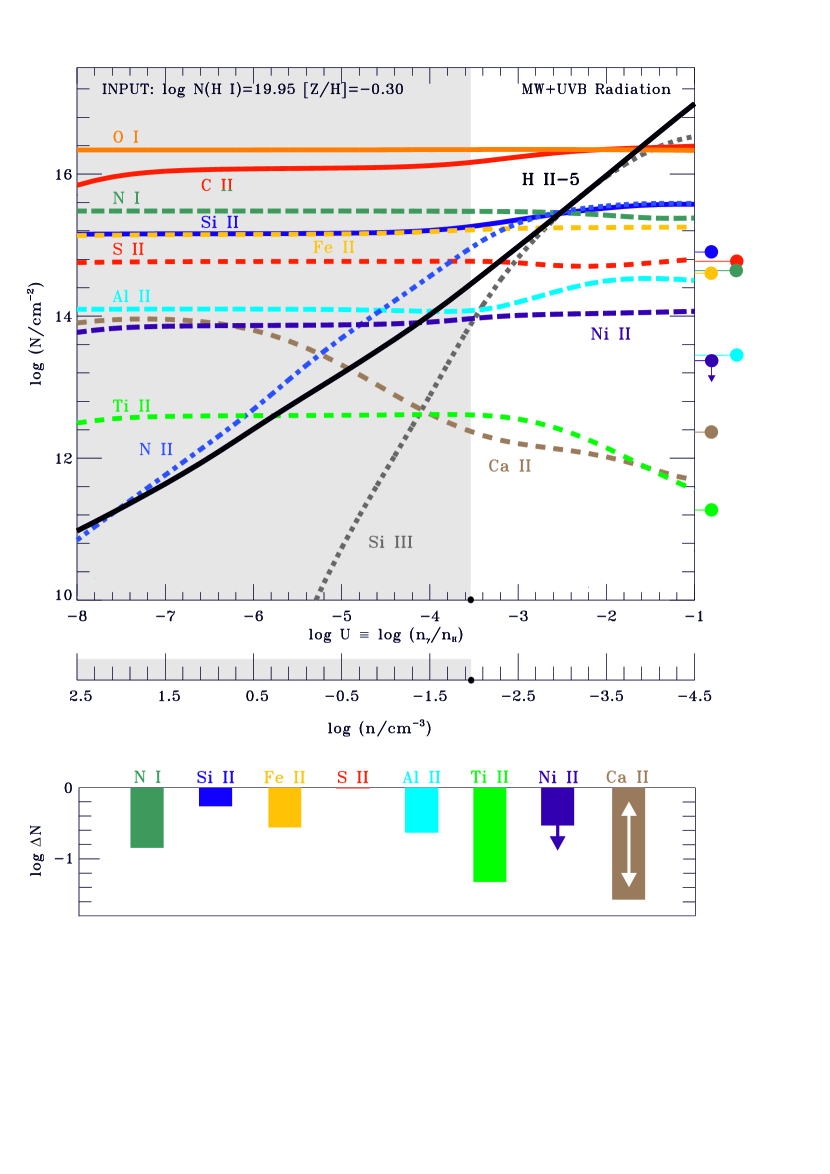
For our Cloudy model we assume a neutral gas column density of log (H i, an overall metallicity of [Z/H, and solar relative abundances of the metals from Asplund et al. (2009), based on our results described above. In Fig. 6, upper panel, we display the expected logarithmic column densities for low and intermediate ions as a function of log and log for this model. The measured total column densities for these ions (Table 1, 10th column) are plotted on the right hand side of the panel. The total Ca ii column density of log (Ca ii sets a limit for the (averaged) ionisation parameter and density in the gas of log and log . The corresponding density range that we consider as relevant for our Cloudy model ( log ) is indicated in Fig. 6 with the gray-shaded area. For this range, the expected column densities of N i, Si ii, Fe ii, S ii, Al ii, Ni ii, and Ti ii are nearly independent of log and log . For S ii, in particular, the column density varies within only dex in the above given density range, supporting the previous conclusions from Wakker et al. (1999) and Gibson et al. (2000). In the lower panel of Fig. 6 we show the differences () between the measured column densities and the mean column densities predicted by Cloudy. For Ni ii and Ca ii, the arrows indicate the upper limit and the allowed range for , respectively.
| Ion (X) | I.P.a | log (M/H) | log (X/H i)c | [M/H]d | log (M)e | |
|---|---|---|---|---|---|---|
| [eV] | ||||||
| C i | 6 | 11.26 | … | … | ||
| C ii | 6 | 24.38 | … | … | ||
| N i | 7 | 14.53 | … | |||
| O i | 8 | 13.62 | … | … | ||
| Na i | 11 | 5.14 | … | … | ||
| Al ii | 13 | 18.83 | ||||
| Si ii | 14 | 16.35 | ||||
| P ii | 15 | 19.77 | … | … | ||
| S ii | 16 | 23.34 | ||||
| Ca ii | 20 | 11.87 | to | |||
| Ti ii | 22 | 13.58 | ||||
| Fe ii | 26 | 16.12 | ||||
| Ni ii | 28 | 18.17 |
From the comparison between the predicted and measured ion column densities, together with the solar reference abundances from Asplund et al. (2009), we obtain the following gas-phase abundances: [N/H, [Si/H, [Fe/H, [S/H, [Al/H, [Ti/H, [Ni/H, and [Ca/H. The listed errors include the uncertainties from the column density measurements for the metal ions and H i (Table 1), the systematic uncertainty due to the beam size of the 21cm measurements (Sect. 3.3), and the systematic uncertainty for the ionization correction from the Cloudy model (see above). The relative contributions of these uncertainties to the total error budget are roughly identical. Note that we here do not consider the systematic errors that come with the solar reference abundances (Asplund et al. 2009; see Table 3, third row), because these errors are irrelevant for the comparison between our results and other abundance measurements, if the identical reference values are used. All gas-phase abundances derived with Cloudy are listed in Table 3, sixth row.
The measured S/H ratio of [S/H corresponds to an overall sulfur abundance in the Magellanic Stream toward Fairall 9 of solar. The value for [S/H] is dex higher than the value derived for the MS toward Fairall 9 by Gibson et al. (2000) based on GHRS data. Several factors contribute to this discrepancy: (a) the somewhat higher ( dex) S ii column density that we derive from the COS data, (b) the slightly lower H i column density ( dex) that we obtain from the GASS data, and (c) the substantially higher ( dex) solar reference abundance of sulfur (Asplund et al. 2009) that we use to derive [S/H] compared to the value from Anders & Grevesse (1989) used by Gibson et al. (2000).
Remarkably, the sulfur abundance we derive here is higher than the present-day stellar sulfur abundances in the SMC ([S/H) and in the LMC ([S/H; Russell & Dopita 1992), but matches the present-day interstellar S abundances found in H ii regions in the Magellanic Clouds (Russell & Dopita 1990). This interesting result will be further discussed in Sect. 5. Because of the large abundance scatter of sulfur in the Magellanic Clouds and because S appears to be underabundant compared to oxygen in the LMC and overabundant compared to oxygen in the SMC (Russel & Dopita 1992), the measured (S/H) ratio alone does not provide a constraining parameter to pinpoint the origin of the gaseous material in the Stream toward Fairall 9 in either SMC or LMC.
From our Cloudy model it follows that all other elements listed above have gas-phase abundances (or abundance limits) that are lower than that of S. Next to the intrinsic nucleosynthetic MS abundance pattern, dust depletion is another important effect that contributes to the deficiency of certain elements (e.g., Ti, Al, Fe, Si) in the gas phase. This aspect will be discussed in Sect. 4.3. Note, again, that we do not attempt to constrain a single value for log or log with our Cloudy model, as our sightline passes a complex multiphase structure that is expected to span a substantial range in gas densities and ionization parameters.
In this paper, we do not further analyze the gas phase that is traced by the intermediate and high ions Si iii, C iv and Si iv, which probably is arising in the ionized boundary layer between the neutral gas body of the Stream and the ambient hot coronal halo gas of the Milky Way (see Fox et al. 2010). For completeness, we show in Fig. 4 the velocity profiles of the available transitions of Si iii, C iv and Si iv in the COS spectrum of Fairall 9. The velocity structure in these ions clearly is different from that of the low ions, suggesting that they trace spatially distinct regions in the MS. The high-ion absorption toward Fairall 9 will be included in a forthcoming paper that will discuss those ions in several lines of sight intersecting the Magellanic Stream (A.J. Fox et al. 2014, in preparation).
4.2. Nitrogen abundance
The measured gas phase abundance of nitrogen in the Magellanic Stream toward Fairall 9 is [N/H, which is dex lower than the abundance of sulfur. In diffuse neutral gas the depletion of nitrogen into dust grains is expected to be very small (Savage & Sembach 1996). Consequently, the low nitrogen abundance in the Stream reflects the nucleosynthetic enrichment history of the gas and thus provides important information about the origin of the gas.
For the SMC, Russell & Dopita (1992) derive a mean present-day stellar nitrogen abundance of [N/H. This value is close to the value derived for the MS toward Fairall 9, although the gas in the Stream has not been enriched with nitrogen since it was stripped off its parent galaxy. The nitrogen abundances found in SMC H ii regions and supernova remnants span a rather wide range of [N/H (Russell & Dopita 1990). Thus, the observed nitrogen abundance in the MS toward Fairall 9 would be in accordance with an SMC origin of the gas only if the (mean) nitrogen abundance in the SMC has not increased substantially after the Stream was separated Gyr ago.
In the LMC, in contrast, the mean present-day stellar nitrogen abundance is found to be much higher ([N/H). The N abundance range in LMC H ii regions and supernova remnants is [N/H to , the minimum [N/H] still being substantially higher than the nitrogen abundance in the Stream toward Fairall 9. Therefore, an LMC origin of the MS is plausible only if the LMC has substantially increased its nitrogen abundance during the last Gyr.
In Sect. 5.1 we will further consider these interesting aspects and discuss the observed N abundance in the MS in the context of the enrichment history of the Magellanic Clouds.
4.3. Dust depletion pattern
Heavy elements such as Al, Si, Fe, Ca, Ti, Fe and Ni are known to be strongly depleted into dust grains in interstellar gas in the Milky Way and other galaxies, while other elements such as S, O, N are only very mildly or not at all affected by dust depletion (e.g., Savage & Sembach 1996; Welty et al. 1997).
To study the depletion pattern of these elements in the Magellanic Stream we define the depletion values from the relative abundance of each depleted element, M, in relation to the abundance of sulfur. We define accordingly log (M)= [M/H[S/H. Using this definition, the depletions values are log (Si, log (Fe, log (Ti, log (Al, and log (Ni (see also Table 3, seventh row). Such depletion values are typical for warm Galactic halo clouds, as derived from UV absorption-line measurements (see Savage & Sembach 1996; their Fig. 6).
Note that the depletion values (or limits) would be different, if the relative chemical abundances of the depleted elements would differ from the relative chemical composition of the sun (Asplund et al. 2009). In view of the abundance patterns found in the LMC and SMC (Russell & Dopita 1990,1992), this is actually a likely scenario, but no further conclusions can be drawn at this point without knowing the exact intrinsic chemical composition of the MS gas toward Fairall 9.
Since the expected Ca ii column density in MS gas is expected to depend strongly on the local gas density and ionization parameter (Fig. 6), the depletion value of Ca cannot be tightly constrained, but may lie anywhere in the range log (Ca. Under typical interstellar conditions, Ca is strongly depleted into dust grains with large depletion values that are similar to those of other elements that have condensation temperatures above K (e.g., Ti; Savage & Sembach 1996). If one assumes that log (Ca log (Ti) for the MS toward Fairall 9, then Fig. 6 would imply that the average density in the neutral gas in the Stream in this direction is log or cm-3. This density, together with the neutral gas column density, would imply a characteristic thickness of the absorbing neutral gas layer of H i pc.
At first glance, one may regard this as a relatively small value. The complex velocity-component structure of the absorber indicates, however, that the absorber is composed of several small cloudlets along the line of sight that (together) are extending over a spatial range that is larger than the value indicated by the mean thickness. In view of the relatively high metal abundance derived for the kinematically complex absorber toward Fairall 9, the presence of a population of metal-enriched gas clumps at small scales in the MS is not an unlikely scenario.
4.4. Physical conditions in the H2 absorbing region
As discussed in Sect. 3.1, the UVES spectrum of Fairall 9 shows the presence of Na i, Ca ii, and possibly Ti ii in component 4. In the same component, the detected H2 absorption is expected to arise (Sect. 3.3), indicating the presence of a cold, dense (and predominantly neutral) gas phase in the MS in this direction. In the following, we want to combine the information from the different instruments to explore the physical and chemical conditions in the H2 absorbing gas phase in the MS toward Fairall 9.
4.4.1 Gas density
While our Cloudy model does not provide any relevant information on the local gas densities in the individual subcomponents, we can use the observed molecular hydrogen fraction in the gas to constrain in the H2 absorbing component 4, assuming that the abundance of H2 relative to H i is governed by a formation-dissociation equilibrium. In a formation-dissociation equilibrium the neutral to molecular hydrogen column density ratio in an interstellar gas cloud is given by
| (1) |
where is the probability that the molecule is dissociated after photo absorption, is the photo-absorption rate per second within the cloud, and is the H2 formation rate on dust grains in units cm3 s-1. For low molecular hydrogen fractions we can write . The parameter in equation (1) describes the column-density fraction of the H i that is physically related to the H2 absorbing gas, i.e., the fraction of the neutral gas atoms that can be transformed into H2 molecules (see Richter et al. 2003 for details). Our absorption modeling of the undepleted low ions S ii and N i indicates that component 4 contains percent of neutral gas column, so that we assume in lack of any more precise information.
For interstellar clouds that are optically thick in H2 (i.e., for log (H) H2 line self-shielding needs to be considered in equation (1), because the self-shielding reduces the photo-absorption rate () in the cloud interior. Draine & Bertoldi (1996) find that the H2 self-shielding can be expressed by the relation , where cm is the self-shielding factor and is the photo absorption rate at the edge of the cloud. The parameter is directly related to the intensity of the ambient UV radiation field at the edge of the H2-bearing clump. Compared to the Milky Way disk, where UV bright stars dominate the mean photo-absorption rate of s-1 (e.g., Spitzer 1978), the value for in the Magellanic Stream is expected to be substantially smaller. This is because the solid angle of the Milky Way disk is relatively small at 50 kpc distance and the contribution of the extragalactic UV background to is expected to be (relatively) small, too. From the model by Fox et al. (2005) follows that the UV flux between 900 and 1100 Å is reduced by a factor of compared to the mean flux within the Milky Way disk, so that we assume s-1. With a total H2 column density of cm-2 in the Stream the self-shielding factor becomes , so that the photo-absorption rate in the cloud core is estimated as s-1. For the H2 grain formation rate in the Magellanic Stream we adopt the value derived for the SMC based on FUSE H2 absorption-line data (Tumlinson et al. 2002), i.e., cm3 s-1. This value is 10 times smaller than in the disk of the Milky Way (Spitzer 1978).
If we solve equation (3) for and include the values given above, we obtain a density of cm-3 or cm-3 for . These densities are very close to the density derived for the H2 absorbing gas in the Leading Arm of the MS toward NGC 3783 ( cm-3; Sembach et al. 2001). Note that H2 absorption has also been detected in the Magellanic Bridge (Lehner 2002).
4.4.2 Gas temperature
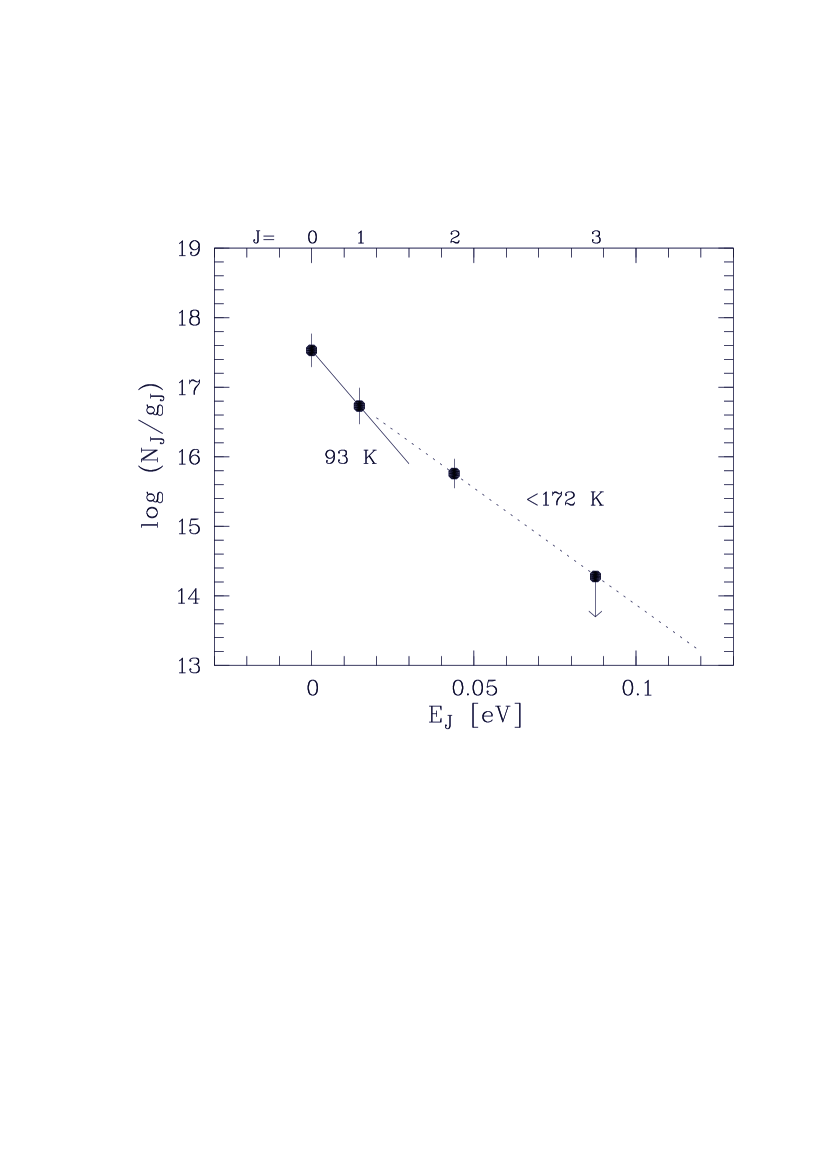
In Fig. 8 we plot the measured logarithmic H2 column density for each rotational state, log , divided by its statistical weight, , against the rotational excitation energy, . Rotational excitation energies and statistical weights have been adopted from the compilation of Morton & Dinerstein (1976). The data points in Fig. 8 can be fit by a Boltzmann distribution (i.e, a straight line in this plot), where the slope characterizes the (equivalent) excitation temperature for the rotational levels considered for the fit. For the two rotational ground states the Boltzmann distribution thus is given by the equation . Using this equation, together with our measured column densities for , we find an excitation temperature of K (Fig. 8 solid line). Because the two rotational ground states most likely are collisionally excited, represents a robust measure for the kinetic temperature in the H2 absorbing gas (e.g., Spitzer 1978); however, because of the saturation of the H2 lines and the resulting relatively large errors for , the uncertainty for is substantial. In a similar manner, we derive for the rotational states an upper limit for the equivalent Boltzmann temperature of K (Fig. 8 dashed line). This higher excitation temperature for reflects excitation processes other than collisions, such as UV pumping and H2 formation pumping (Spitzer 1978). However, the relatively low temperature limit of K reflects the low intensity of the ambient dissociating UV radiation field at the position of the MS.
The above given excitation temperatures deviate from our earlier estimates (Richter et al. 2001a). This is not surprising, however, since the values for have substantially changed, too (see Sect. 3.3). The derived value of K lies in a temperature regime that is typical for diffuse H2 gas in the disk of the Milky Way and in the Magellanic Clouds (e.g., Savage et al. 1977; Tumlinson et al. 2002; de Boer et al. 1998; Richter et al. 1998; Richter 2000).
From the density and temperature estimate in the H2 absorbing gas we now are able to provide a direct estimate of the thermal pressure, , in the cold neutral gas in the MS. With cm-3 and K we obtain a pressure of cm-3 K. This value is in good agreement with previous estimates for the thermal pressure in the cold neutral phase of the MS from H i 21cm measurements (e.g., Wakker et al. 2002).
The thickness of the H2 absorbing structure in the MS is (H i pc. This small dimension of the absorbing gas clump explains the very small velocity dispersion ( km s-1; see Table 1) that is measured for this component.
4.5. Electron density and C+cooling rate from C ii⋆ absorption
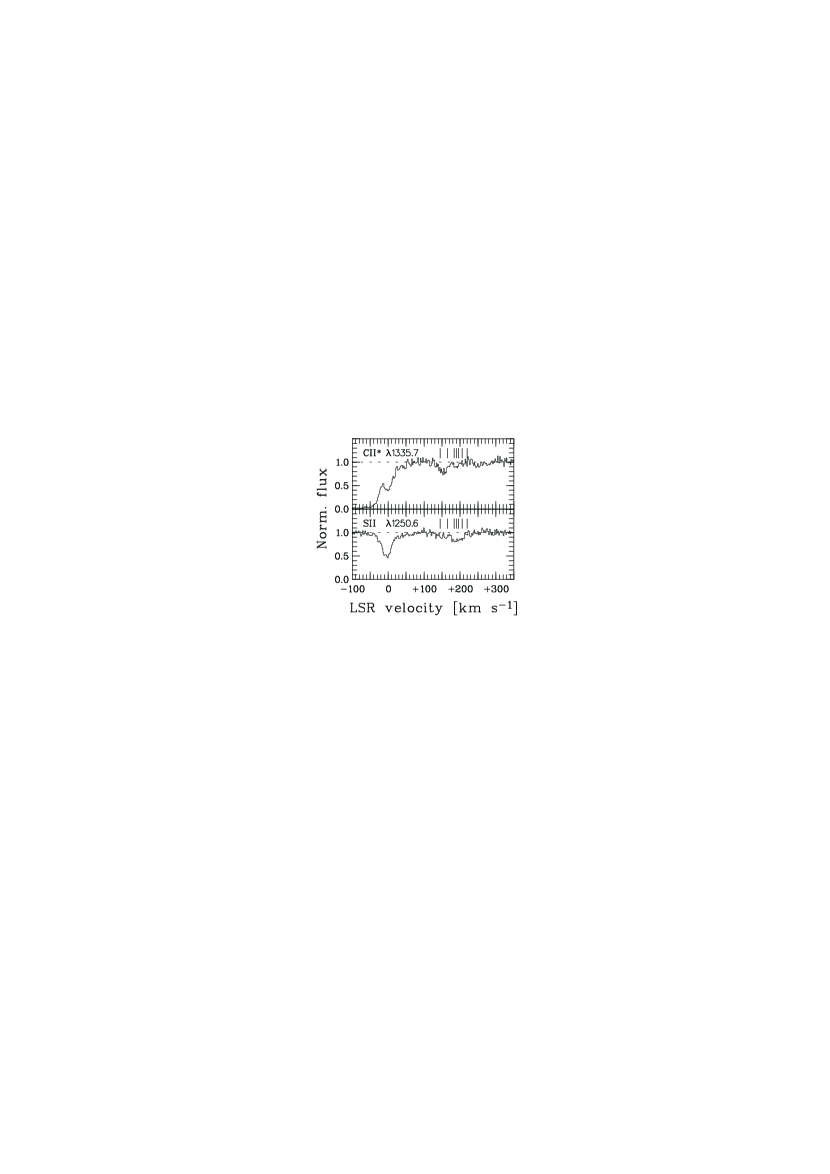
In Fig. 7 (upper panel) we show the LSR velocity profile of the C ii⋆ line, based on the COS data. Weak absorption is visible at MS velocities, but the component structure is different from that of the other low ions (e.g., S ii; Fig. 7, lower panel). Because we could not identify any other (e.g., intergalactic) origin for this absorption feature, we assume that it is caused by C ii⋆ in the Magellanic Stream. The C ii⋆ feature is characterized by a stronger and broader absorption peak near km s-1, falling together with components 1 and 2 defined in Table 1, and another weak and narrow component that is seen near km s-1, most likely associated with component 4, in which H2, Na i, and Ca ii is detected. Therefore, the relative strengths of the C ii⋆ components appear to be inverted from those of the ground-state species. This indicates multi-phase gas, in which the ionization fractions and electron densities vary among the different absorption components.
Under typical interstellar conditions, the relative population of the fine-structure levels of ionized carbon (C+) are governed by the balance between collisions with electrons and the radiative decay of the upper level into the ground state . The C ii⋆ transition arises from the state, which has an energy of eV above the ground state. Measurements of the column-density ratios (C ii⋆)/(C ii) thus can be used to estimate the electron densities in different interstellar environments, including Galactic high-velocity clouds (HVCs) and circumgalactic gas structures (e.g., Zech et al. 2008; Jenkins et al. 2005).
For the C ii⋆ absorption in the MS toward Fairall 9 we measure a total column density of log (C ii for the velocity range km s-1 using the AOD method. For the weak absorption associated with component 4 we derive log (C ii (AOD). The C ii absorption in the MS is fully saturated and thus does not provide a constraining limit on (C ii) (see Table 1). We therefore use S ii as a proxy, because the S ii/C ii ratio is expected to be constant over a large density range (Fig. 6) and both elements are not expected to be depleted into dust grains in the MS. Using a solar (S/C) ratio (Asplund et al. 2009), we estimate from the values listed in Table 1 that the total C ii column density in the MS is log (C ii and the column density in component 4 is log (C ii.
Because the C+ fine-structure population depends strongly on the gas temperature (see, e.g., Spitzer 1978), we do not attempt to estimate a mean value for from (C ii/(C ii). We know that the temperature in this multi-phase absorber spans a large range between K and probably few K, and therefore an estimate for would be meaningless. Instead, we concentrate on component 4, for which we know the gas temperature and density from the analysis of the H2 rotational excitation (Sect. 4.4). Keenan et al. (1986) have calculated electron excitation rates for the C+ fine-structure transitions for a broad range of physical conditions in interstellar gas. Using our temperature and density estimates for the gas in component 4 ( K and cm-3) together with their predicted population rate ratios (/) for K and cm-3 (their Fig. 2), the measured column-density ratio log[(C ii⋆)/(C ii) implies that the electron density in component 4 is small compared to , namely cm-3. This low value for is in excellent agreement with expectations for a stable cold, neutral medium in gas with subsolar metallicities (Wolfire et al. 1995).
Having a robust measure for (C ii⋆), it is also possible to estimate the C+ cooling rate in the Magellanic Stream toward Fairall 9. Because ionized carbon is a major cooling agent of interstellar gas in a wide range of environments (e.g., Dalgarno & McCray 1972), the C+ cooling rate is an important quantity that governs the thermal state of diffuse gas inside and outside of galaxies. For the hydrogen and electron densities in the Magellanic Stream (see above) the C+ cooling rate is governed predominantly by spontaneous de-excitations, while collisional de-excitations can be neglected (e.g., Spitzer 1978). Following Lehner, Wakker & Savage (2004), the C+ cooling rate per neutral hydrogen atom can be estimated as CH i erg s-1. If we adopt log (H i and log (C ii we derive a mean (sightline average) C+ cooling rate per neutral hydrogen atom of log for the MS toward Fairall 9. This value is almost one order of magnitude lower than the cooling rate derived for the one-tenth-solar metallicity HVC Complex C (log ), but is relatively close to the values derived for solar-metallicity clouds in the Milky Way disk and in the lower Galactic halo (log ; see Lehner, Wakker & Savage 2004, their Table 4). This result underlines the importance of metal cooling for the thermal state of metal-rich circumgalactic gas absorbers in the local Universe.
5. Discussion
5.1. Enrichment history of the Magellanic Stream
5.1.1 Alpha and nitrogen abundances
One major result of our study is the surprisingly high metallicity of the MS toward Fairall 9. From the measured sulfur abundance of [S/H follows that the abundance in the Stream in this direction () is as high as solar, which is times higher than the abundance derived for other sightlines passing the MS toward NGC 7469 (), RBS 144 (), and NGC 7714 (; Fox et al. 2010, 2013). Our detailed analysis of the ionization conditions in the gas, the comparison between H i 21cm measurements from different radio telescopes with different beam sizes, and the analysis of the H i Ly absorption toward Fairall 9 (see Appendix) do not provide any evidence, that this high sulfur abundance could be a result from the various systematic errors that come along with our analysis (see also the discussion in Gibson et al. 2000 on this topic). We thus are forced to conclude that the measured high sulfur abundance in the gas reflects the true chemical composition of the Stream in this direction.
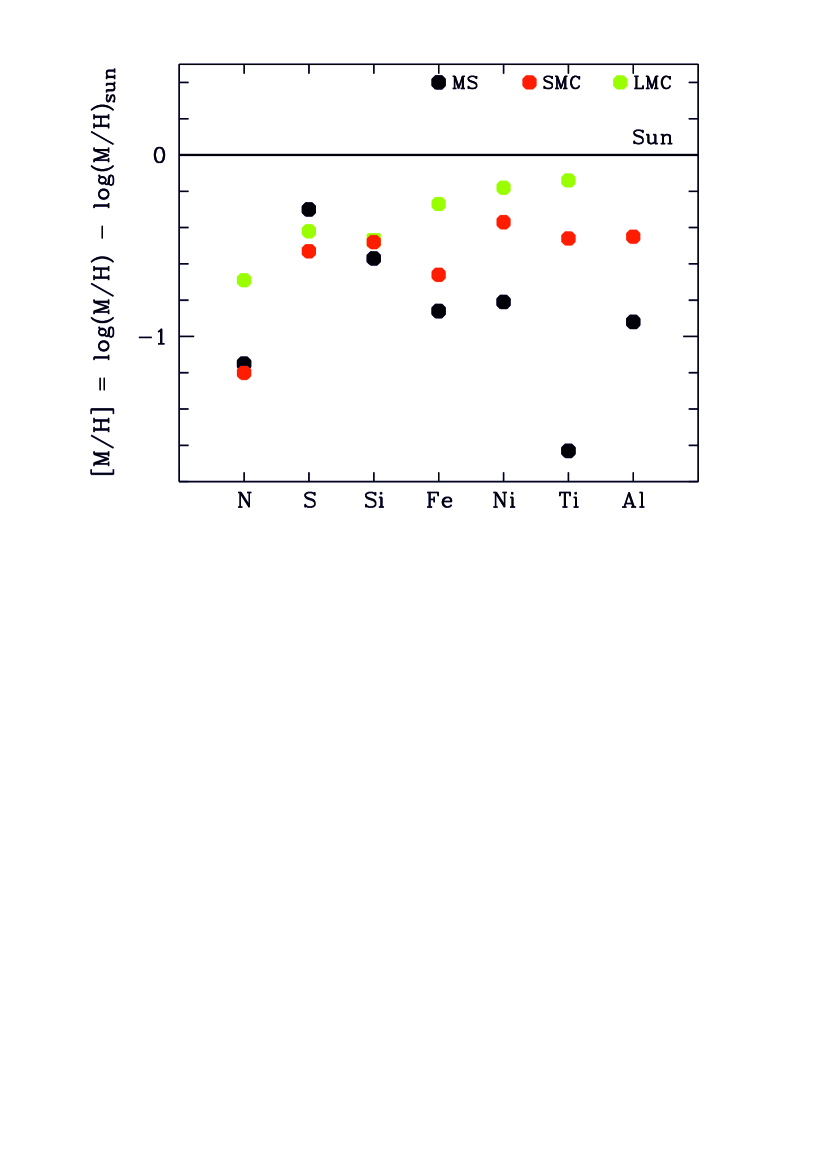
As a guide to the following discussion, we have plotted in Fig. 9 the derived MS abundances (black filled circles) together with the SMC and LMC present-day stellar and nebular abundances (Russel & Dopita 1992; Hughes et al. 1998; red (SMC) and green (LMC) filled circles). With a sulfur abundance of solar, the MS toward Fairall 9 exhibits an abundance that is higher than the average present-day abundance in both SMC and LMC ( and solar, respectively; Russell & Dopita 1992). This finding has profound implications for our understanding of the origin of the Magellanic Stream and its enrichment history.
Early tidal models suggest that the MS was stripped from the Magellanic Clouds Gyr ago (Gardiner & Noguchi 1996). More recent models, that take into account that the Magellanic Clouds possibly are on their first pass through the Milky Way halo (see, e.g., Kallivayalil et al. 2013), have included other relevant mechanisms that would help to unbind the gas, such as blowouts and tidal resonances (Connors et al. 2006; Nidever et al. 2008; Besla et al. 2010). One would expect that the Stream’s chemical composition must reflect that of its parent galaxy at the time, when the gas was separated from the Magellanic Clouds, since the MS does not contain stars that would increase its metallicity since then. Following the well-defined age-metallicity relations of SMC and LMC (Pagel & Tautvaisiene 1998; Harris & Zaritsky 2004; 2009), one would expect that the Stream’s present-day abundance is at most solar if originating in the SMC and solar if originating in the LMC. While the observed MS abundances toward RBS 144, NGC 7469, and NGC 7714 are in line with these abundance limits (and actually favour an SMC origin for this part of the Stream; see Paper I), the sulfur abundance in the MS toward Fairall 9 is at least twice as high as expected from a simple tidal model that assumes a homogeneous pre-enrichment of the SMC/LMC gas (e.g., Dufour 1975) before the Stream was stripped off.
A second important finding of our study, that adds to this puzzle, is the relatively low nitrogen abundance in the MS toward Fairall 9. The [N/S] ratio (N/] ratio) is dex, which is very low for the relatively high abundance of [/H] when compared to nearby extragalactic H ii regions and high-redshift damped Lyman (DLA) systems (see Pettini et al. 2008; Jenkins et al. 2005, and references therein). The -process elements O, S, and Si are believed to be produced by Type II supernovae from massive progenitor stars, while the production of N, as part of the CNO cycle in stars of different masses, is less simple (and not yet fully understood). The so-called “primary” nitrogen production occurs when the seed elements C and O are produced within the star during the helium burning phase, while for “secondary” nitrogen production these seed elements were already present when the star condensed out of the ISM (Pettini et al. 2002; Henry & Prochaska 2007). Primary N is believed to be produced predominantly by stars of intermediate masses on the asymtotic giant branch (e.g., Henry et al. 2000). Because of the longer lifetime of intermediate-mass stars, primary N therefore is expected to be released into the surrounding ISM with a time delay of Myr compared to elements. At low metallicities less than solar (i.e., at LMC/SMC metallicities Gyr ago, when the MS was separated from its parent galaxy) the nitrogen production is predominantly primary (see Pettini et al. 2008).
The low [N/S] and high [S/H] ratios observed in the MS toward Fairall 9 therefore indicate an abundance pattern that is dominated by the enrichment from massive stars and Type II supernovae, while only very little (primary) nitrogen was deposited into the gas.
5.1.2 Origin of the gas
The most plausible scenario that would explain such an enrichment history, is, that the gas that later became the Stream was locally enriched in the Magellanic Clouds Gyr ago with elements by several supernova explosions in a star cluster or OB association, and then separated/stripped from the stellar body of the parent galaxy before the primary nitrogen was dumped into the gas and the metals could mix into the ambient interstellar gas. Eventually, the supernova explosions may have pushed away the enriched material from the stellar disk so that the gas was already less gravitationally bound at the time its was stripped and incorporated into the Magellanic Stream. In this scenario, it is the present-day N abundance in the MS that defines the metallicity floor of the parent galaxy and thus provides clues to the origin of the gas.
Chemical evolution models of the Magellanic Clouds suggest that the mean metallicities of SMC and LMC Gyr ago were dex lower than today (Pagel & Tautvaisiene 1998; Harris & Zaritsky 2004, 2009). Therefore, and because of the substantially higher mean N abundance in the LMC compared to the SMC (see Fig. 9), the low N abundance measured in the Stream toward Fairall 9 favours a SMC origin of the gas. An LMC origin is also possible, however, because the scatter in the present-day N abundances in the LMC is large (see Sect. 4.2) and the age-metallicity relations from Pagel & Tautvaisiene (1998) and Harris & Zaritsky (2004,2009) may not apply to nitrogen because of its special production mechanism. In fact, considerung the position of the Fairall 9 sightline (see Paper I, Fig. 1) and the radial velocity of the MS absorption in this direction, the bifurcation model of Nidever et al. (2008) predicts that the high-velocity gaseous material toward Fairall 9 is part of the LMC filament of the Stream und thus should have a different chemical composition than the SMC filament traced by the other MS sightlines (Paper I). Another aspect that may be of relevance in this context is the fact that the Fairall 9 sightline lies only 14.3° on the sky from the SMC. The relative high metal-abundance in the Stream toward Fairall 9 thus may reflect the increasing importance of continuous ram-pressure stripping of metal-enriched SMC gas as the MCs get closer to the Milky Way.
While the above outlined enrichment scenario appears feasible to explain qualitatively the observed trend seen in the abundance pattern in the MS toward Fairall 9, the question arises, how many massive stars and subsequent supernova explosions would then be required to lift the [S/N] and [S/H] ratios to such a high level. To answer this question, one would first need to have an idea about volume and mass of the gas that is enriched in this manner. The fact that Fox et al. (2010, 2013) have determined a much lower abundance in the Stream of solar toward three other MS sightlines using similar data possibly suggests, that the high metallicity and low [N/S] ratio toward Fairall 9 represents a relatively local phenomenon.
In Sect. 4.3, we have estimated a thickness of the absorbing neutral gas layer in the Stream of pc from the mean gas density ( cm-3) and the total column density, assuming that the dust depletion values of Ti and Ca are similiar in the gas. In the following, we regard this value as a realistic lower limit for the true physical size of the absorbing gas region. If we adopt the SN yields from Kobayashi et al. (2006) and assume a spherical symmetry for the absorbing gas region with a diameter and density as given above, we calculate that only a handful of massive stars would be required to boost the abundance from initially solar to solar in such a small volume of gas. A much higher number of high-mass stars would be required, however, if the volume to be enriched would be substantially larger, as we outline in the following. Because the total mass of a spherical gas cloud can be written as the product of cloud volume and gas density (), and because we use the relation to estimate , we can write for a fixed (measured) hydrogen column density in the gas. Therefore, if the mean gas density in the MS toward Fairall 9 would be cm-3 rather than the assumed cm-3, then the diameter of the cloud would be 300 pc instead of 30 pc, but it would require 100 times more massive stars to enrich this large volume to the level required. In view of the stellar content of the most massive star forming regions in the Magellanic Clouds (e.g., 30 Doradus; Melnick 1985) and the possible presence of a major star burst in the MCs at the time when the Magellanic Stream was formed (Harris & Zaritsky 2009; Weisz et al. 2013), a size of a few dozen up to a few hundred pc together with the proposed enrichment scenario is fully consistent with our understanding of the star-formation history of the Magellanic Clouds.
In summary, the observed abundance pattern in the MS toward Fairall 9 suggests the presence of a high-metallicity gas filament in the Stream in this direction, possibly originating in a region with enhanced star-formation activity in the Magellanic Clouds Gyr ago. Our study indicates that the chemical composition and thus the enrichment history of the MS seems to be more complex than previously thought. The Stream possibly is composed of different gas layers that have different chemical compositions and that originate from different regions with local star-formation histories within the Magellanic Clouds. Our findings therefore support (but do not require) the idea that there is a metal-enriched filament in the Stream toward Fairall 9 that originates in the LMC (but not the SMC), as concluded by Nidever et al. (2008) from a systematic Gaussian decomposition of the H i velocity profiles of the LAB 21cm all-sky survey (Kalberla et al. 2005). To further explore this scenario it will be of great importance to identify other sightlines that pass the supposed LMC filament in the Stream with background QSOs that are bright enough to be observed with HST/COS. Such observations would also be helpful to investigate the abundances in the LMC filament based on oxygen rather than sulfur and to further explore element ratios that could help to constrain the enrichment history of the gas.
Interestingly, the MS absorber toward Fairall 9 is not the only example of a circumgalactic gas structure in the nearby Universe that exhibits a high overall metallicity together with a low N/ abundance ratio. For example, Jenkins et al. (2005) have measured [/H] and [N/ in an intervening Lyman-limit system (LLS) at toward the quasar PHL 1811. This absorption system appears to be associated with two nearby spiral galaxies at impact parameters kpc and kpc. It possibly represents gaseous material that has been ejected or stripped from these galaxies (or other galaxies nearby) and thus possibly has an origin that is very similar to that of the Magellanic Stream. Note that low [N/] ratios are also found in low-metallicity HVCs, such as Complex C (e.g., Richter et al. 2001b). Clearly, a systematic study of N/ ratios in circumgalactic metal absorbers at low with HST/COS would be an important project to investigate whether similar abundance patterns are typical for circumgalactic gaseous structures in the local Universe.
5.2. Physical conditions and small-scale structure in the gas
In addition to the very interesting chemical properties, the combined UVES/COS/FUSE /GASS/ATCA data set provides a deep insight into the physical conditions in the Stream toward Fairall 9. The data show a complex multiphase gas structure that possibly spans a large range in gas densities and ionization conditions.
The presence of H2 absorption toward Fairall 9 and NGC 3783 (Sembach et al. 2001) indicate that the MS and its Leading Arm hosts a widespread (because of the large absorption cross section/detection rate) cold neutral gas phase, possibly structured in a large amount of small, dense clumps or filaments. Assuming a total area of the MS and its Leading Arm of deg2, and a typical size for these clumps of a few pc, there could be millions of these dense structures in the neutral gas body of the Stream, if the two H2 detections toward Fairall 9 and NGC 3783 reflects the true absorption-cross section of this gas phase throughout the Stream’s neutral gas body.
The fact that the MS can maintain significant amounts of H2 at moderate gas densities ( cm-3) probably is a result of the relatively low intensity of the dissociating UV radiation at the Stream’s location due to the absence of local UV sources (see also Fox et al. 2005). Note that the low excitation temperature of H2 for (see also Sembach et al. 2001) provides independent evidence for a relatively weak ambient UV radiation field, and thus supports this scenario. In the MS, the low dissociation rate is expected to overcompensate the low formation rate (because of the lower metallicity and dust content compared to the Milky Way ISM), thus resulting in molecular gas fractions that are relatively high for the given total gas column. With a grain-formation rate of cm3 s-1 and a density of cm-3 (see Sect. 4.4), the H2 formation time is long, Gyr, which matches the tidal age of the Stream. Therefore, it seems most likely that the H2 (or at least some fraction of it) has already formed in the parent galaxy and then survived the subsequent tidal stripping. A similar conclusion was drawn from the H2 observations in the Leading Arm of the MS toward NGC 3783 (Sembach et al. 2001). Elaborating our idea, that the gas was locally enriched by massive stars shortly before the Stream was separated from its parent galaxy, one could imagine the presence of relatively dense, compressed shells and fragments that formed the seed structures for the formation of H2 that then were carried along with the Stream’s gaseous body.
Independent constraints on the physical conditions in the gas come from the observed Na i/Ca ii ratio. We measure a Na i/Ca ii column-density ratio of in component 4, where the H2 is expected to reside. In the Milky Way ISM, such a ratio is typical for a dust-bearing warm neutral medium (WNM), where cm-3 and K, typcially, and Ca ii serves a trace species (e.g., Crawford 1992). In such gas, and without dust depletion of Ca and Na, a nearly constant Na i/Ca ii of ratio would be expected from detailed ionization models of these ions (see Crawford 1992; Welty et al. 1996; Richter et al. 2011). If these numbers would apply also to the conditions in the MS, they would indicate relative dust depletions of Ca and Na of log (Ca log (Na, or log (Ca for log (Na. These values are in very good agreement with the dust-depletion estimates from our Cloudy model discussed in Sect. 4.3.
5.3. Relevance to intervening QSO absorbers
The Magellanic Stream represents a prime example for a high-column density circumgalactic tidal gas stream in the local Universe. If the Stream would be seen as QSO absorber, it would be classified as LLS, sub-DLA (sub-Damped Lyman absorber), or DLA, depending on the position of the sightline passing through the gas. The H i column-density maps presented in Fig. 1 provides an estimate on the covering fractions of these column-density regimes in the MS in the direction of Fairall 9. The results from our multi-sightline campaign to study the properties of the MS therefore are also of relevance for the interpretation of interevening absorption-line systems at low redshift.
5.3.1 Inhomogeneity of absorbers
The first important result from our study that is of relevance for QSO absorption-line studies is, that the physical conditions and the chemical composition appear to vary substantially within the Stream.
If such inhomogeneities were typical for tidal gas filaments around galaxies, then the interpretation of absorption spectra from circumgalactic gas structures around more distant galaxies (in terms of metallicity, molecular content, physical conditions, gas mass, origin, etc.) would be afflicted with large systematic uncertainties. In fact, most studies that aim at exploring the connection between galaxies and their surrouding circumgalactic gas are limited to single sightlines that pass the galaxy environment at a random impact parameter (e.g., Thom et al. 2011; Tumlinson et al. 2011; Ribaudo et al. 2011). Physical and chemical properties derived from single-sightline studies, however, may not be representative at all for the conditions in the general gaseous environment (in the same way as conditions in the MS along the Fairall 9 sightline are not representative for the Stream as a whole). The inhomogeneous chemical composition of the Stream implies that the metals possibly are not well mixed in the gas. Former abundance variations in the parent galaxy due to local star-formation events thus may have been frozen into the Stream’s spatial metal distribution. This would be not too surprising, however, since the main processes that stir up and mix the interstellar gas within galaxies (i.e., supernova explosions, stellar winds) cannot take place in the Stream simply due to the lack of stars.
5.3.2 Molecular absorption
The two detections of H2 absorption in the MS with FUSE toward Fairall 9 and NGC 3783 (Sembach et al. 2001) indicate that tidal gas streams around galaxies may typically host a widespread, cold gas phase that has a substantial absorption cross section. This scenario is supported by the recent detection of H2 absorption in another, more distant circumgalactic tidal gas stream beyond the Local Group (Crighton et al. 2013). These findings also remind us that the presence of H2 in an intervening absorber with a complex velocity structure and a high neutral gas column density does not necessarily mean that one traces a gaseous disk of a galaxy.
The relatively large absorption cross section of H2 in neutral gas structures around galaxies, as found in the Milky Way halo (see Richter 2006 and references therein), can be explained by the circumstance that the physical conditions in these star-less gas clouds favour the formation of diffuse molecular structures even at relatively moderate gas densities. In particular, the relative low intensity of the local UV radiation field, the efficient process of H2 line self-shielding, and the lack of the distructive influence of massive stars probably represent important aspects in this context.
H2 observations in circumgalactic gas clouds not only provide important information on the physical and chemical conditions in these structures, they also are of high relevance for our understanding of the physics of molecular hydrogen in diffuse gas under conditions that are very differnt from that in the local ISM (see also Sembach et al. 2001). The transition from neutral to molecular gas, in particular, represents one of the most important processes that govern the evolutionary state of galaxies at low and high redshift. Detailed measurements of H2 fractions and dust-depletion patterns in (star-less) tidal streams at low redshift can help to constrain the critical formation rate of molecular hydrogen in low-metallicity environments and thus could be of great importance to better understand the distribution and cross section of molecular gas in and around high-redshift galaxies.
6. Summary
In this second paper of our ongoing series to study the Magellanic Stream
in absorption we have analyzed newly
obtained optical and UV absorption-line data from HST/COS and
VLT/UVES together with archival FUSE and H i 21cm emission
data from GASS and ATCA to study the chemical composition and the physical
conditions in the Magellanic Stream in the direction of the quasar
Fairall 9. Our main results are the following:
1. Metal absorption in the Magellanic Stream (MS) is detected
in seven individual absorption components centered at
and km s-1,
indicating a complex internal velocity strucutre of the MS
in this direction. Detected ions, atoms and molecules in
the Stream include
C iv, Si iv, Si iii, C ii,
C ii⋆, Al ii, Si ii,
S ii, Ca ii, Ti ii, Fe ii,
Ti ii, O i, N i, Na i, and H2.
2. From the unsaturated S ii absorption and a Cloudy
photoionization model we obtain an
abundance in the Stream of [S/H ( solar),
which is substantially higher than that found in the Stream
along the lines of sight toward NGC 7469, RBS 144, and NGC 7714
(Fox et al. 2010, 2013).
Unfortunately, the unresolved, saturated O i
line cannot be used to independently constrain the
abundance in the MS toward Fairall 9. Contrary to
sulfur, we measure a very low nitrogen abundance in the gas of
[N/H. The resulting [N/S] ratio is dex,
which is very low compared to other environments with
similarly high abundances.
The low [N/S] and high [S/H] ratios observed in the MS toward
Fairall 9 suggest an abundance pattern that is dominated by
the enrichment from massive stars and Type II supernovae,
while only very little primary nitrogen was deposited into
the gas when the Stream was separated from the
Magellanic Clouds.
3. The detection of very narrow Na i and H2 absorption
(with km s-1) in the component at
km s-1 indicates the presence of a compact (pc-scale), cold gas stucure
in the MS along this sightline. From the analysis of the
newly reduced archival FUSE data of Fairall 9 we measure a total
molecular hydrogen column density of log (H, improving
previous results from Richter et al. (2001a). From the analysis
of the H2 rotational excitation we obtain a kinetic temperature
in the cold neutral gas phase of K.
For the gas density we derive cm-3,
assuming that the H2 gas is in a formation-dissociation
equilibrium. The resulting estimate for the thermal gas pressure
is cm-3 K, thus in good agreement with values derived
from previous studies of the Stream. The detection of H2 absorbing
structures in the MS, whose linear and angular sizes must be very
small ( pc and arcseconds), indicates
that the neutral gas body of the Stream is highly clumped and
structured. We discuss the implications of physical and chemical
inhomogeneities in circumgalactic gas structures on our understanding
of intervening QSO absorption-line systems.
4. The relatively low column densities of Fe ii, Ti ii,
Ni ii, Al ii, and Ca ii indicate that the gas phase
abundances of these elements are affected by dust depletion. We combine our
column-density measurements for these ions with a Cloudy
photoionization model and derive dust
depletion values relative to sulfur of
log (Si,
log (Fe,
log (Ni,
log (Ti,
log (Al, and
log (Ca to .
These depletion values are similar to those
found in warm, diffuse clouds in the lower
Milky Way halo (Savage & Sembach 1996).
5. Our study indicates that the enrichment history of the
Magellanic Stream as well as the physical conditions in the
Stream are more complex than previously known.
The abundances and gas-to-dust ratios measured in the
Stream along the Fairall 9 sightline are substantially
higher than what is found along other MS sightlines.
The high sulfur abundance in the gas possibly indicates a
substantial enrichment from massive stars
in a region of enhanced star-formation Gyr ago
that then was stripped from the
Magellanic Clouds and incorporated into the MS
before the gas could be enriched in nitrogen from
intermediate-mass stars.
Our findings are in line with the idea that the
metal-enriched filament in the Stream toward Fairall 9
originates in the LMC (Nidever et al. 2008), but an
SMC origin is also possible (and slightly favoured by
the low nitrogen abundance in the gas).
REFERENCES
Abgrall, H., & Roueff, E. 1989, A&A, 79, 313
Anders, E., & Grevesse, N. 1989, Geochim. Cosmochim. Acta, 53, 197
Asplund, M., Grevesse, N., Jacques Sauval, A., & Scott, P. 2009, ARA&A, 47, 481
Ben Bekhti, N., Richter, P., Westmeier, T., & Murphy, M.T. 2008,
A&A, 487, 583
Ben Bekhti, N., Winkel, B., Richter, P., et al. 2011, A&A, 542, 110
Besla, G., Kallivayalil, N., Hernquist, L., et al. 2007, ApJ, 668, 949
Besla, G., Kallivayalil, N., Hernquist, L., et al. 2010, ApJ, 721, L97
Besla, G., Kallivayalil, N., Hernquist, L., et al. 2012, MNRAS, 421, 2109
Bland-Hawthorn, J., & Maloney, P. R. 1999, ApJ, 510, L33
Bland-Hawthorn, J., Sutherland, R., Agertz, O., & Moore, B. 2007, ApJ, 670, L109
Bland-Hawthorn, J.,& Maloney, P. R. 2002, in ASP Conf. Ser. 254, Extragalactic
Gas at Low Redshift, ed. J. S. Mulchaey & J. T. Stocke (San Francisco: ASP),
267
Brüns, C., Kerp, J., Stavely-Smith, L., et al. 2005, A&A, 432, 45
Crawford, I.A. 1992, MNRAS, 259, 47
Crighton, N. H. M., Bechtold, J., Carswell, R. F. et al. 2013, MNRAS, in press (astro-ph/1210.0905)
Connors, T. W., Kawata, D., Maddison, S. T., & Gibson, B. K. 2004, PASA, 21, 222
Connors, T. W., Kawata, D., & Gibson, B. K. 2006, MNRAS, 371, 108
Dalgarno, A., & McCray, R. A. 1972, ARA&A, 10, 375
de Boer, K. S., Richter, P., Bomans, D. J., Heithausen, A., & Koornneef, J.
A&A, 338, L5
Dekker, H., D’Odorico, S., Kaufer, A., Delabre, B., & Kotzlowski,
H. 2000, SPIE, 4008, 534
Diaz, J. D., & Bekki, K. 2011, ApJ, 413, 2015
Draine, B., & Bertoldi, F. 1996, ApJ, 468, 269
Dufour, R.J. 1975, ApJ, 195, 315
Ferland, G. J., Korista, K. T., Verner, D. A. et al. 1998, PASP, 110, 761
Fontana, A., & Ballester, P. 1995, ESO Messenger, 80, 37
Fox, A. J., Wakker, B. P., Savage, B. D., et al. 2005, ApJ, 630, 332
Fox, A.J., Wakker, B.P., Smoker, J.V., et al. 2010, ApJ, 718, 1046
Fox, A.J., Richter, P., Wakker, B.P. et al. 2013, ApJ, in press (astro-ph/1304.4240)
Gardiner, L.T. & Noguchi, M. 1996, MNRAS, 278, 191
Gibson, B. K., Giroux, M. L., Penton, S. V., et al. 2000, AJ, 120, 1830
Green, J. C., Froning, C. S., Osterman, S., et al. 2012, ApJ, 744, 60
Harris, J., Zaritsky, D. 2004, AJ, 127, 1531
Harris, J., Zaritsky, D. 2009, AJ, 138, 1243
Heitsch, F. & Putman, M. E. 2009, ApJ, 698, 1485
Henry, R. B. C., Edmunds, M. G, Köppen, J. 2000, ApJ, 541, 660
Henry, R. B. C. & Prochaska, J. X. 2007, PASP, 119, 962
Hughes, J. P., Hayashi, I., & Koyama, K. 1998, ApJ, 505, 732
Irwin, M. J., Kunkel, W. E., Demers, S. 1985, Nature, 318, 160
Jenkins, E. B., Bowen, D. V., Tripp, T. M., & Sembach, K. R. 2005,
ApJ, 623, 767
Kalberla, P. M. W., Burton, W. B., Hartmann, D., et al. 2005,
A&A, 440, 775
Kalberla, P. M. W., McClure-Griffiths, N. M., Pisano, D. J., et al.
2010, A&A, 521, 17
Kallivayalil, N., van der Marel, R. P., Alcock, C., et al. 2006a,
ApJ, 638, 772
Kallivayalil, N., van der Marel, R. P., & Alcock, C. 2006b, ApJ,
652, 1213
Kallivayalil, N., van der Marel, R. P., Besla, G., Anderson, J., & Alcock, C. 2013,
ApJ, 764, 161
Keenan, F. P., Lennon, D. J., Johnson, C. T., & Kingston, A. E. 1986,
MNRAS, 220, 571
Kobayashi, C., Umeda, H., Nomoto, K., Tominaga, N., & Ohkubo, T. 2006,
ApJ, 653, 1145
Koerwer, J.F. 2009, AJ, 138, 1
Kriss, G. A. 2011, COS Instrument Science Report, 1
Lehner, N. 2002, ApJ, 578, 126
Lehner, N., Wakker, B.P., & Savage, B.D. 2004, ApJ, 615, 767
Lehner, N., Howk, J.C., Keenan, F.P., & Smoker, J.V. 2008, ApJ 678, 219
Lu, L., Savage, B. D., & Sembach, K. R. 1994, ApJ, 437, L119
Mastropietro, C., Moore, B.,Mayer, L.,Wadsley, J., & Stadel, J. 2005, MNRAS,
363, 509
Mathewson, D. S., Ford, V. L., Schwarz, M. P., & Murray, J. D. 1979, IAUS, 84, 547
Melnick, J. 1985, A&A, 153, 235
Morton, D. C., & Dinerstein, H. L. 1976, ApJ, 204, 1
Morton, D. C. 2003, ApJS, 149, 205
McClure-Griffiths, N. M., Pisano, D. J., Calabretta, M. R., et al. 2009,
ApJS, 181, 398
Nidever, D. L., Majewski, S. R., & Burton, W. B. 2008, ApJ, 679, 432
Nidever, D. L., Majewski, S. R., Burton, W. B., & Nigra, L. 2010,
ApJ, 723, 1618
Pagel, B. E. J., & Tautvaisiene, G. 1998, MNRAS, 299, 535
Pettini, M., Ellison, S. L., Bergeron, J., & Petitjean, P. 2002,
A&A, 391, 21
Pettini, M., Zych, B. J., Steidel, C. C., & Chaffee, F. H. 2008,
MNRAS, 385, 2011
Putman, M. E., Staveley-Smith, L., Freeman, K. C., Gibson, B. K., & Barnes, D. G. 2003,
ApJ, 586, 170
Ribaudo, J., Lehner, N., Howk, J. C., et al. 2011,
ApJ, 743, 207
Richter, P., Widmann, H., de Boer, K. S. et al. 1998, A&A, 338, L9
Richter, P. 2000, A&A, 359, 1111
Richter, P., Sembach, K. R., Wakker, B. P., & Savage, B. D., 2001a,
ApJ, 562, L181
Richter, P., Savage, B. D., Wakker, B. P., Sembach, K. R., & Kalberla, P. M. W.
2001b, ApJ, 549, 281
Richter P., Wakker B. P., Savage B. D., & Sembach K. R. 2003, ApJ, 586, 230
Richter, P., Westmeier, T., & Brüns 2005, A&A, 442, L49
Richter, P. 2006, Rev. Mod. Astron., 19, 31
Richter, P., Charlton, J. C., Fangano, A. P. M., Ben Bekhti, N.,
& Masiero, J. R. 2009, ApJ, 695, 1631
Richter, P., Krause, F., Fechner, C., Charlton, J. C.,
& Murphy, M. T. 2011, A&A, 528, A12
Russell, S. C., & Dopita, M. A. 1990, ApJ, 74, 93
Russell, S. C., & Dopita, M. A. 1992, ApJ, 384, 508
Savage, B. D., Drake, J. F., Budich, W., & Bohlin, R. C. 1977, ApJ,
216, 291
Savage, B. D., & Sembach, K. R. 1991, ApJ, 379, 245
Savage, B. D. & Sembach, K. R. 1996, ARA&A, 34, 279
Sembach, K. R., Howk, J. C., Savage, B. D., & Shull, J. M. 2001,
AJ, 121, 992
Songaila, A. 1981, ApJ, 243, L19
Spitzer, L. 1978, Physical processes in the interstellar medium,
(New York Wiley-Interscience)
Thom, C., Werk, J. K., Tumlinson, J., et al. 2011, ApJ, 736, 1
Tumlinson, J., Shull, J. M., Rachford, B. L., et al. 2002, ApJ, 566, 857
Tumlinson, J., Werk, J. K., Thom, C., et al. 2011, ApJ, 733, 111
Wakker, B. P., Howk, J. C., Savage, B. D., et al. 1999, Nature, 402, 388
Wakker, B. P., Oosterloo, T. A., & Putman, M. E. 2002, AJ, 123, 1953
Wakker, B.P. 2006, ApJS, 163, 282
Wakker, B. P., York, D. G., Howk, J. C., et al. 2007, ApJ, 670, L113
Wakker, B. P., York, D. G., Wilhelm, R., et al. 2008, ApJ, 672, 298
Wakker, B. P., Lockman, F. J., & Brown, J. M. 2011, ApJ, 728, 159
Wannier, P., & Wrixon, G. T. 1972, ApJ, 173, L119
Weiner, B. J., & Williams, T. B. 1996, AJ, 111, 1156
Weisz, D. R., Doplhin, A. E., Skillmann, E. D., et al. 2013, MNRAS, 431, 364
Welty, D. E., Morton, D. C., & Hobbs, L.M. 1996, ApJS, 106, 533
Welty, D. E., Lauroesch, J. T., Blades, J. C., Hobbs, L.M., & York, D. G. 1997,
ApJ, 489, 672
Welty, D. E., Federman, S. R., Gredel, R., Thorburn, J. A., & Lambert, D. L. 2006,
ApJS, 165, 138
Wolfire, M. G., McKee, C. F., Hollenbach, D., & Tielens, A. G. G. M.
1995, ApJ, 453, 673
York, D. G., Songaila, A., Blades, J. C., et al. 1982, ApJ, 255, 467
Zech, W. F., Lehner, N., Howk, J. C., Dixon, W. V. D., & Brown, T. M. 2008, ApJ,
679, 460
Appendix A H i Ly absorption
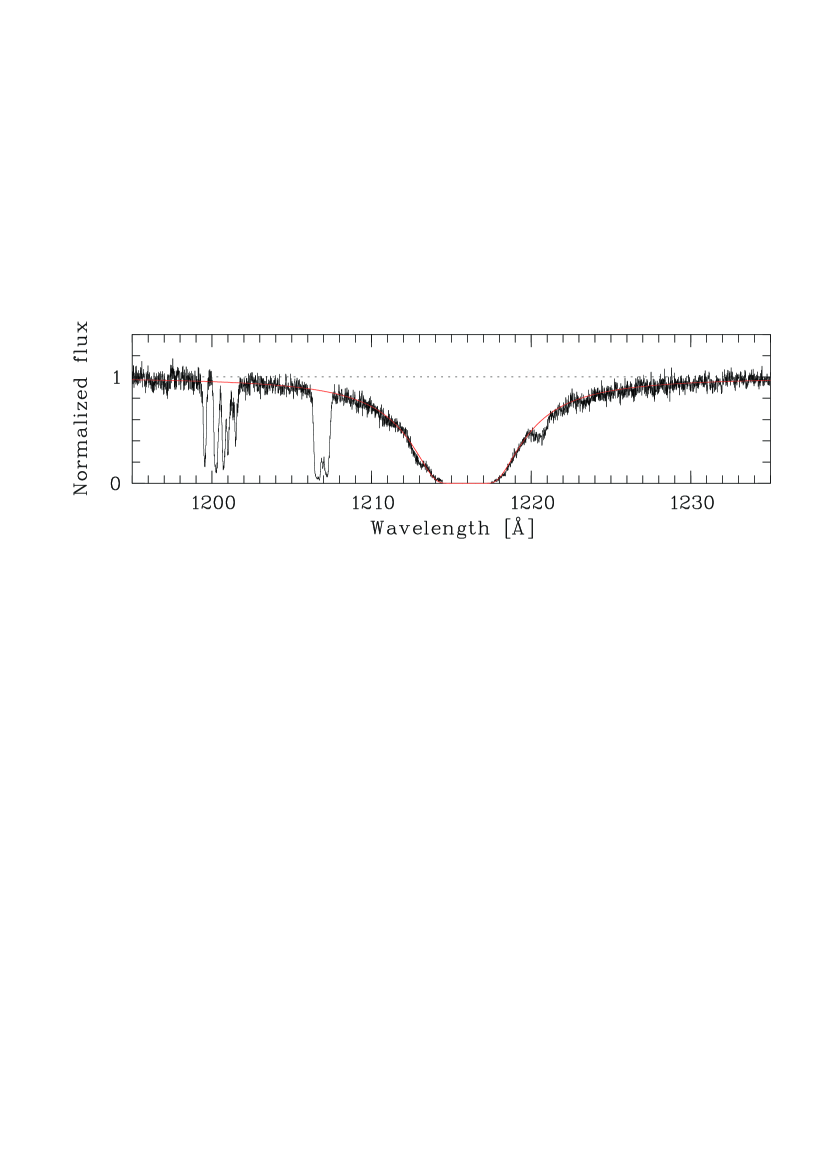
In Fig. 10 we show the normalized COS spectrum in the wavelength range between and Å. Strong H i Ly absorption centered at Å from neutral gas in the Milky Way (MW) and in the Magellanic Stream with well-defined damping wings is visible. The 21cm data from various observations and instruments (Sect. 3.3; Gibson et al. 2000) indicate that the Milky Way disk gas dominates the neutral-gas column density along this sightline.
The strength and shape of the Ly absorption toward Fairall 9 supports this conclusion, but the relative contribution of MW and MS cannot be tightly constrained from a Voigt-profile fit of the Ly absorption. The red solid line in Fig. 10 shows a two-component absorption model with a MW H i column density of log (H i and a MS H i column density of log (H i. The Ly absorption profile is fully consistent with the value of log (H i in MS, as indicated by the GASS 21cm data. However, the Ly profile is also consistent with MS column densities in the range log (H i, if the MW contribution is modified accordingly. In conclusion, the Ly absorption does not provide constraining limits on the H i column density in the Magellanic Stream toward Fairall 9 that could help to minimize the systematic errors for the determination of log (H i), as discussed in Sect. 3.3.
Appendix B Absorption modeling of UV lines
In Sect. 2.5 we have outlined the method that we have used to model the UV lines of the low ions in the COS spectrum of Fairall 9 to infer column densities of these species. We here present additional information on the modeling procedure to provide an insight into the allowed parameter range for and for each ion.
In Fig. 11 we show velocity plots of the low ions from synthetic spectra that have been generated by us based on different input models, in which we have systematically varied the parameters and . The resulting model profiles are compared to the best-fitting model presented in Fig. 3 and Table 1.
In the left panel of Fig. 11 (a), the best-fitting model is indicated with the black solid line, while the lines in red, green, and blue show models, in which all column densities in the individual subcomponents have been increased by , , and dex, respectively. The velocity structure and the values remain unchanged. In the middle panel of Fig. 11 (b), the column densities in the individual subcomponents have been decreased by , , and dex (red, green, blue), again without changes in and . These two figures indicate that the shapes of the strong and saturated lines from C ii, O i and Si ii are basically not affected by the change in column density. In contrast, the absorption depths of the weaker lines of N i, Al ii, Si ii, S ii, and Fe ii are strongly affected by the increase or decrease of the column densities with respect to the reference model (black), demonstrating that these lines represent sensitive diagnostics to constrain and for these ions in the Stream.
In the right panel of Fig. 11 (c) we show a model in which we have increased the Doppler parameters for the individual subcomponents by factors of (red), (green), and (blue) with respect to the reference model (black), while the column densities and the overall velocity structure remain unchanged. Because of the relatively low spectral resolution of COS compared to the absolute values of , the changes in are irrelevant for the shape of the weak, unsaturated lines, while the strong, saturated lines mildly grow in strength in their absorption wings. Therefore, even if we would underestimate the values of for the singly-ionized species Al ii, Si ii, S ii, and Fe ii when adopting the values from Ca ii, as one could argue because these ions may trace a slightly different (more extended) gas phase, our column-density estimate would not be affected at all by this systematic error.
These figures, together with Fig. 2, underline that the total gas column densities of N i, Al ii, Si ii, S ii, and Fe ii in the MS, as listed in Table 1, are well constrained by the COS data and our absorption model.