Discovery of a Cosmological, Relativistic Outburst via its Rapidly Fading Optical Emission
Abstract
We report the discovery by the Palomar Transient Factory (PTF) of the transient source PTF11agg, which is distinguished by three primary characteristics: (1) bright ( mag), rapidly fading ( mag in d) optical transient emission; (2) a faint ( mag), blue ( mag) quiescent optical counterpart; and (3) an associated year-long, scintillating radio transient. We argue that these observed properties are inconsistent with any known class of Galactic transients (flare stars, X-ray binaries, dwarf novae), and instead suggest a cosmological origin. The detection of incoherent radio emission at such distances implies a large emitting region, from which we infer the presence of relativistic ejecta. The observed properties are all consistent with the population of long-duration gamma-ray bursts (GRBs), marking the first time such an outburst has been discovered in the distant universe independent of a high-energy trigger. We searched for possible high-energy counterparts to PTF11agg, but found no evidence for associated prompt emission. We therefore consider three possible scenarios to account for a GRB-like afterglow without a high-energy counterpart: an “untriggered” GRB (lack of satellite coverage), an “orphan” afterglow (viewing-angle effects), and a “dirty fireball” (suppressed high-energy emission). The observed optical and radio light curves appear inconsistent with even the most basic predictions for off-axis afterglow models. The simplest explanation, then, is that PTF11agg is a normal, on-axis long-duration GRB for which the associated high-energy emission was simply missed. However, we have calculated the likelihood of such a serendipitous discovery by PTF and find that it is quite small (%). While not definitive, we nontheless speculate that PTF11agg may represent a new, more common ( times the on-axis GRB rate at 90% confidence) class of relativistic outbursts lacking associated high-energy emission. If so, such sources will be uncovered in large numbers by future wide-field optical and radio transient surveys.
1 Introduction
From accreting stellar-mass black holes in our Galaxy to distant active galactic nuclei (AGNs) and gamma-ray bursts (GRBs), outflow velocities approaching the speed of light are common in nature. Indeed, the number of known sources capable of generating relativistic ejecta has expanded in recent years to include a core-collapse supernova without an accompanying GRB (SN 2009bb; Soderberg et al. 2010), as well as the presumed tidal disruption of a star by a supermassive black hole (Levan et al., 2011; Bloom et al., 2011; Zauderer et al., 2011; Burrows et al., 2011; Cenko et al., 2012). With revolutionary new time-domain facilities slated to come online in the coming decade, even more exotic examples will surely be uncovered.
Time-variable high-energy emission (X-rays and -rays) tends to be the hallmark of such relativistic outflows. Yet there is good reason to expect that some relativistic outbursts may lack a detectable high-energy signature. In the case of GRBs, for example, the most mundane possibility is a lack of sky coverage: the most sensitive high-energy GRB detectors cover only a fraction of the sky at any given time. But other, more interesting possibilities exist, including viewing-angle effects (Rhoads, 1997; Perna & Loeb, 1998; Nakar et al., 2002) and some physical process suppressing the high-energy emission entirely (Dermer et al., 2000; Huang et al., 2002; Rhoads, 2003). The search at longer wavelengths for these “orphan” (i.e., off-axis) afterglows or “dirty fireballs” has remained one of the most sought-after goals in the GRB field for more than a decade.
In this work, we report the discovery by the Palomar Transient Factory of PTF11agg, a rapidly fading optical transient associated with a year-long, scintillating radio counterpart. The detection of a faint, blue, quiescent optical source at the transient location suggests a cosmological origin for the transient (i.e., well beyond the Milky Way and any nearby galaxies). At such distances, the observed radio emission requires the presence of relativistic ejecta.
Throughout this work, we adopt a standard CDM cosmology with H0 = 71 km s-1 Mpc-1, , and (Spergel et al., 2007). All quoted uncertainties are 1 (68%) confidence intervals unless otherwise noted, and UT times are used throughout. Reported optical magnitudes are in the AB system (Oke & Gunn, 1983). We have corrected the reported optical and near-infrared (NIR) photometry for a foreground Galactic extinction of mag (Schlegel et al., 1998), using the extinction law from Cardelli et al. (1989).
2 Discovery and Basic Analysis
2.1 Optical/Near-Infrared
2.1.1 Observations
Regular monitoring observations of field 100033 (centered at , , with a total on-sky area of 7.2 deg2) were obtained with the Palomar 48 inch Oschin telescope (P48) equipped with the refurbished CFHT12k camera (Rahmer et al., 2008) as part of a program to study stellar variability in Praesepe (the Beehive Cluster; Agüeros et al. 2011) by the Palomar Transient Factory (PTF; Law et al. 2009; Rau et al. 2009). Over 500 individual P48 frames, each with an exposure time of 60 s, were obtained over the period from 2009 November through 2012 March. All P48 images were obtained with a Mould -band filter, which is similar to the filter from the Sloan Digital Sky Survey (SDSS; Aihara et al. 2011), but offset by Å redward (Ofek et al., 2012).
In an image beginning at 5:17:11 on 2011 January 30, we detected a bright but short-lived optical flare at the (J2000.0) location , , with a 1 astrometric uncertainty of 70 mas in each coordinate (Figure 1). This source was subsequently dubbed PTF11agg by our automated discovery and classification pipeline (Bloom et al., 2012). Our P48 photometry of PTF11agg, calculated with respect to nearby point sources from SDSS, is presented in Table 1.
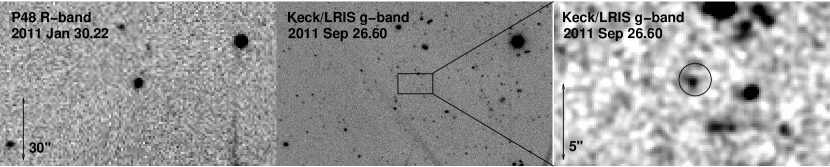
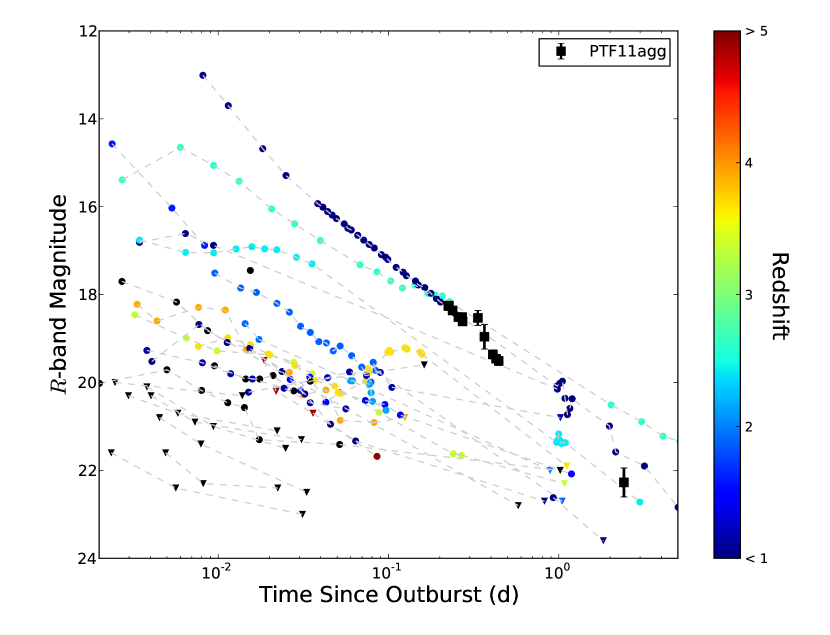
The peak observed magnitude, obtained in our first image of the field on 2011 January 30, was measured to be mag. In the next ten P48 images of the field, all obtained on 2011 January 30, the source is seen to decay by 1.2 mag in the band. A faint detection is also obtained by coadding all P48 images from 2011 February 1 ( mag). The resulting P48 -band light curve is plotted in Figure 2. All subsequent P48 images result in nondetections at this location.
Examining our pre-outburst (i.e., before 2011 January 30) P48 imaging, we find no evidence for emission at this location in any individual frames (extending back in time to 2009 November). The typical limiting magnitude for an individual P48 image is mag. Stacking all frames from 2011 January 29 (i.e., the day preceding discovery), we limit the optical emission at the location of PTF11agg to mag. Similarly, coadding all pre-outburst P48 images results in a nondetection with mag.
Deep optical imaging of the location of PTF11agg was obtained at late times ( month) with the Low Resolution Imaging Spectrometer (LRIS; Oke et al. 1995) mounted on the 10 m Keck I telescope (- and -band filters), and the Inamori-Magellan Areal Camera and Spectrograph (IMACS; Dressler et al. 2011) mounted on the 6.5 m Magellan-Baade telescope at Las Campanas Observatory (-band filter).
In our deepest epoch of post-outburst optical imaging (2011 September 26 with Keck/LRIS, or d), we identify a faint, unresolved (in 06 seeing) source in and at (J2000.0) coordinates , (Figure 1). Given the uncertainty in the astrometric tie between the Keck/LRIS and P48 imaging (50 mas in each coordinate), the observed 90 mas radial offset is not statistically significant (null probability of 0.17). Coadding Keck/LRIS images of the field of PTF11agg from several individual nights with less ideal conditions (2011 March 4, March 12, and April 27), we can recover an object at this location with similar brightness in both and . No emission is detected at this location in the -band IMACS images to mag.
We obtained near-infrared (NIR) imaging of the location of PTF11agg with the 1.3 m Peters Automated InfraRed Imaging TELescope (PAIRITEL; Bloom et al. 2006) on 2011 March 1 ( d). A total exposure time of 2246 s was obtained simultaneously in the , , and filters. Raw data files were processed using standard NIR reduction methods via PAIRITEL Pipeline III (C. Klein et al., in preparation), and resampled using SWarp (Bertin et al., 2002) to create 10 pixel-1 images for final photometry.
We also observed the location of PTF11agg with the Wide-Field Infrared Camera (WIRC; Wilson et al. 2003) mounted on the 5 m Hale telescope at Palomar Observatory. Images were obtained in the filter on 2012 March 28 ( d) for a total exposure time of 1200 s. The individual frames were reduced using a custom pipeline within the IRAF environment (Tody, 1986). Both the PAIRITEL and WIRC images were calibrated with respect to bright field stars from the Two Micron All-Sky Survey (2MASS; Skrutskie et al. 2006).
No emission was detected at the location of PTF11agg in any of the NIR bandpasses. The most constraining limits come from the WIRC observations ( mag).
2.1.2 Constraints on the Decay Index and Optical Outburst Onset
We fit the observed P48 detections on 2011 January 30 and February 1 to a power-law model of the form , where is the flux density (in Jy), is the time of the outburst onset, is the power-law index, and is the flux density at a fiducial time ( s). We find best-fit values of and 23:34 UT ( hr) on 2011 January 29. We note that the inferred outburst onset occurs 16.6 hr after the preceding P48 nondetection on 2011 January 29 (Table 1).
In the event that PTF11agg is a bona fide GRB-like afterglow (§4), an alternate constraint on the explosion date can be derived by comparing the peak brightness of PTF11agg with the observed distribution of GRB optical afterglows. Using the comprehensive sample from Kann et al. (2010), an observed magnitude of at discovery implies an age of d (Figure 2). Put differently, the brightest known GRB optical afterglows reach an observed magnitude of approximately 12 hours after the onset of the high-energy emission. Together with the P48 nondetection on 2011 January 29.31, we can conservatively constrain the outburst onset to fall within the window from 17:00 on 2011 January 29 to 5:17 on 2011 January 30 (55590.71–55591.22 MJD).
While the overall power-law fit quality is acceptable ( for 9 degrees of freedom), we caution that the early optical light curves of GRBs rarely exhibit single power-law decays (Panaitescu & Vestrand, 2008; Rykoff et al., 2009; Oates et al., 2009). In the event that the outburst occurred later than our derived , the true power-law index will be smaller than what we have inferred, and more consistent with most previously observed GRB optical afterglows. If the outburst actually occurred earlier, the decay index would steepen somewhat. But temporal indices are ruled out based on the nondetection on 2011 January 29.
2.1.3 Likelihood of Quiescent Source Association
Here we wish to estimate , the a posteriori likelihood that the coincident quiescent counterpart detected at late times in our Keck/LRIS imaging is unrelated to PTF11agg (i.e., the transient source). We have measured the areal surface density of objects of this brightness in our imaging of field 100033, finding galaxies arcsec-2; we note that this is consistent with the results from Hogg et al. 1997 using entirely different fields. Using 150 mas, or three times the uncertainty in the astrometric tie between the P48 and Keck/LRIS images, as our search radius, and following Bloom et al. (2002), we find that . We therefore consider it highly likely that this source is the quiescent counterpart of PTF11agg; however, we consider alternative possibilities below as well.
2.2 Radio
2.2.1 Observations
We began radio observations of the field of PTF11agg with the National Radio Astronomy Observatory’s (NRAO111The National Radio Astronomy Observatory is a facility of the National Science Foundation (NSF) operated under cooperative agreement by Associated Universities, Inc.) Karl G. Jansky Very Large Array (VLA; Perley et al. 2011) on 2011 March 11 ( d). The array was in the “B” configuration until 2011 May 6, then the “BnA” configuration until 2011 June 1, and the “A” configuration thereafter. Over the course of our monitoring, the angular resolution ranged from 03 to 12. The VLA data were reduced with the Astronomical Image Processing System (AIPS)222See http://www.aips.nrao.edu/index.shtml .. For flux calibration, we used the source 3C 147, while phase calibration was performed using the objects J0823+2223 and J0832+1832. As a check of our flux calibration, we have verified that flux measurements of our phase calibration sources remain stable throughout the course of our observations.
We observed PTF11agg at high frequencies (mm wavelengths) with the Combined Array for Research in Millimeter-wave Astronomy (CARMA) beginning on 2011 March 14 ( d) and continuing for approximately one month. For our CARMA observations, the array was in the “D” configuration, and the beam had an angular diameter of 10″. The total bandwidth (lower sideband and upper sideband) was 8 GHz, and the local oscillator frequency was 93.6 GHz. The optical depth at high (230 GHz) frequency ranged from fair (; phase noise ) on March 14 and April 11, to good (; phase noise ) on April 7. Data were reduced using standard techniques within the MIRIAD environment (Sault et al., 1995).
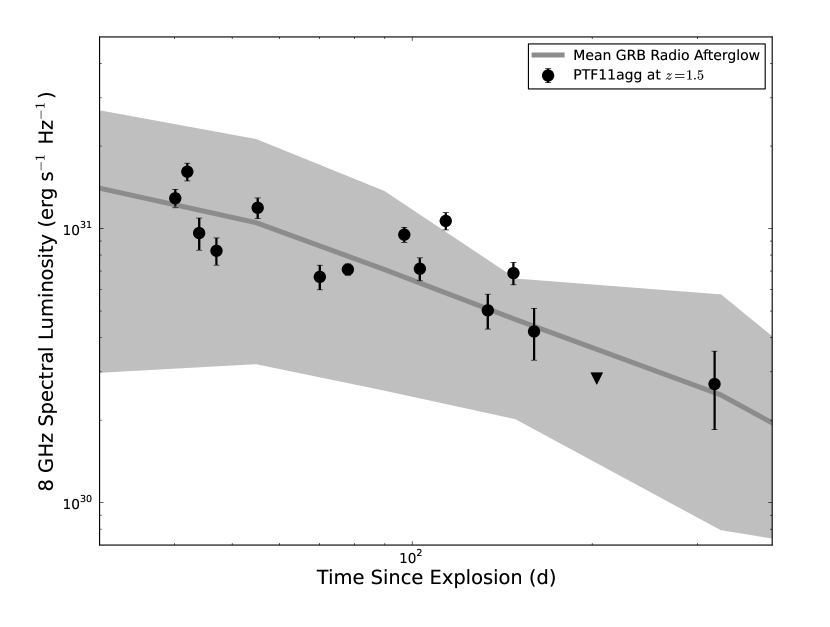
A transient radio counterpart was detected with both facilities. The radio counterpart was unresolved (smallest beam size of mas) and consistent with zero circular polarization ( %) at all epochs. The results of our EVLA and CARMA monitoring are displayed in Table 2, while the 8 GHz light curve is plotted in Figure 3.
2.2.2 Spectral Energy Distribution
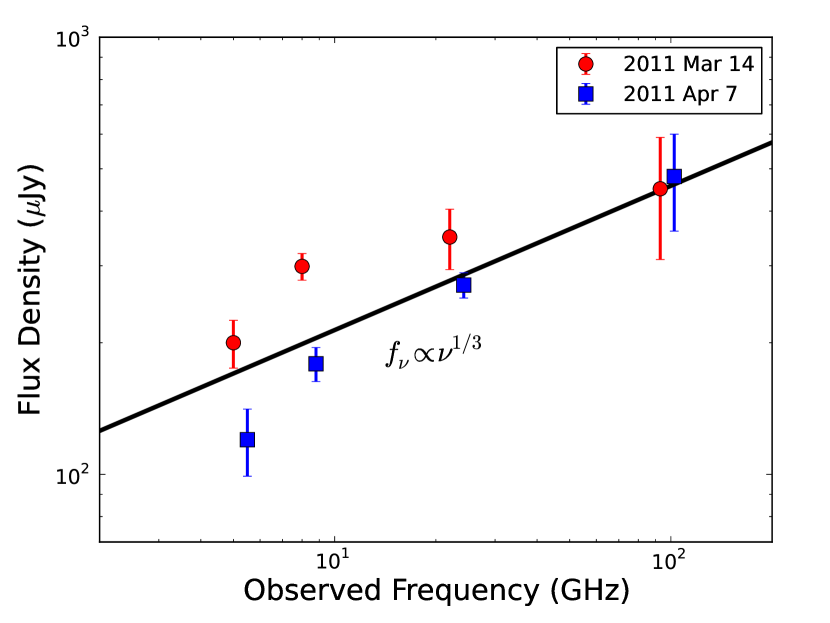
To calculate the radio spectral energy distribution (SED), we must interpolate the various observing frequencies to a common epoch. To provide the longest lever arm, we perform this analysis at the two epochs of our 93 GHz CARMA detections: 2011 March 14.05 ( d) and 2011 April 7.03 ( d). We have linearly interpolated flux-density measurements made immediately before and after these epochs at frequencies of 5 and 8 GHz. Due to the relatively sparse coverage at 22 GHz, we have simply adopted the flux density at the closest epoch in time (note that for 2011 March 18 we averaged the two 22 GHz measurements obtained on this day). The resulting SEDs are plotted in Figure 4.
We fit a power law of the form to the data, where is the flux density (in Jy), is the observing frequency (in GHz), is the power-law spectral index, and is the flux density at a fiducial frequency of 1 GHz. For the first epoch ( d), we find . On the second epoch ( d), we measure . Given the relatively large degree of variability (see below), together with the sparse coverage at high frequencies, we adopt as an approximate spectral slope in the radio for the remainder of this work.
2.2.3 Angular Source Size
The presence of nonthermal radio emission provides two powerful and independent means to constrain the angular size of the emitting region. To begin with, the brightness temperature () of an incoherent radio emitter cannot exceed its equipartition value of K (Readhead, 1994; Kulkarni et al., 1998). The brightness temperature is given by
| (1) |
where is the speed of light, is Boltzmann’s constant, is the observing frequency, is the observed flux density, and is the angular diameter of the emitting region. Adopting K in Equation 1 thus implies a lower limit on the angular diameter of the source:
| (2) |
As can be seen from Equation 2, the strictest lower limits on the size of the emitting region are derived from observations at the lowest frequencies (assuming a power-law spectral index ). Using our 4.5 GHz observation on 2011 March 13, we find as. Most of our early observations at 5 and 8 GHz yield comparable (though slightly less strict) limits.
Separately, we can constrain the angular size of the source from the detection of interstellar scattering and scintillation (ISS; Rickett 1990). To quantify the degree of variation induced by the scattering electrons, we calculate the modulation index,
| (3) |
where is the variance of the flux density (with respect to an assumed model), is the average of the square of the individual measurement uncertainties, and is the average of the flux density.
We calculated the modulation indices at 5 and 8 GHz, neglecting higher frequencies due to the relative lack of observations. We fit the light curves at both frequencies to a power-law model of the form , finding best-fit temporal indices of (i.e., consistent with no temporal evolution) and . This power-law model then forms the reference which we use to calculate the variance at each frequency. In this manner, we find GHz and GHz.
We use the Galactic electron density distribution model of Cordes & Lazio (2002) to derive the relevant ISS parameters, namely , the transition frequency between the strong and weak scattering regimes. For the line of sight to PTF11agg (Galactic coordinates , ), we find GHz. For a point source, the maximum degree of modulation () will occur at this transition frequency. It is therefore not unreasonable to expect our observations at 5, 8, and (possibly) 22 GHz to suffer from some degree of ISS.
For GHz, our observations at 5 and 8 GHz will be in the strong scattering regime (). Furthermore, given the relatively broad bandwidth of our observations (), we consider only refractive scintillation. For a point source, the modulation index in the strong, refractive regime is given by (Walker, 1998)
| (4) |
For the line of sight to PTF11agg, we therefore expect a significant degree of modulation for a point source at our observing frequencies: GHz, GHz.
For an extended source, the observed modulation will be reduced by a factor of , where is the size of the Fresnel scattering disk (Walker, 1998),
| (5) |
where is the effective distance to the scattering screen ( kpc for the line of sight to PTF11agg). If we solve for the angular diameter corresponding to the observed degree of modulation at each frequency, we find GHz as and GHz as. We therefore conclude that the angular size of the emitting region at d is as.
2.3 High-Energy
2.3.1 -ray Limits
At the time of discovery, three primary high-energy facilities were monitoring the sky to search for the prompt emission from GRBs. The Third InterPlanetary Network (IPN; Hurley et al. 2010) is a group of nine satellites sensitive to high-energy emission. When multiple satellites detect a GRB, the sky localization can be reconstructed from light travel time constraints. The IPN provides essentially continuous all-sky coverage (i.e., 100% duty cycle), with a sensitivity to fluences (10 keV – 5 MeV) of erg cm-2 (at 50% efficiency; i.e., half of the GRBs with this fluence are too faint to trigger the IPN detectors). In addition to the IPN, the Gamma-Ray Burst Monitor (GBM; Meegan et al. 2009) on the Fermi satellite, and the Burst Alert Telescope (BAT; Barthelmy et al. 2005) on the Swift satellite (Gehrels et al., 2004), also regularly discover a large number of GRBs. The GBM detects bursts down to a 8 keV – 1 MeV fluence of erg cm-2, but has a field of view of 8.8 sr (the area of the sky unocculted by the Earth in the Fermi orbit) and a duty cycle of %. Likewise, the Swift BAT has detected events with 15–150 keV fluences as low as erg cm-2, but only observes a field of view of 2 sr with a duty cycle of . We caution that, for all three facilities, the high-energy fluence required to trigger the onboard GRB algorithms depends on the duration of the event; therefore, the above sensitivity limits should be treated only as approximate.
We have searched all three facilities for GRB triggers from the direction of PTF11agg over the time period from 17:00 2011 January 29 to 5:17 2011 January 30 (i.e., the outburst onset window derived in §2.1.2). No triggers were reported by any facility in the direction of PTF11agg during this hr window. We further conducted a search for untriggered events in the GBM data in the energy range 10–300 keV on several different time scales (0.256 s, 0.512 s, 1.024 s, 2.048 s, 4.096 s, and 8.192 s)333Two individual GBM detectors with a significance of 4.0 and 3.8 above background were required for a trigger to register in this search.. No potential high-energy counterparts to PTF11agg were found.
Given the field of view and duty cycle of the GBM and BAT, there is a significant likelihood that events below the IPN sensitivity threshold would be missed by both instruments. For example, for a GRB with fluence above the GBM sensitivity level (but below the IPN threshold), the probability of a nondetection from both instruments is as high as (assuming a uniform and independent distribution of sky pointings for the two instruments). Given the relatively large window of time required to search (i.e., multiple Swift and Fermi orbits), we consider a fluence of erg cm-2 (i.e., twice the all-sky IPN sensitivity) a reasonable limit on any high-energy prompt emission associated with PTF11agg. Given the extremely weak correlation between prompt -ray fluence and optical afterglow brightness (Nysewander et al., 2009), this limit is consistent with the known properties of GRBs and their afterglows.
2.3.2 X-ray Limits
To search for an X-ray counterpart, we obtained observations of the location of PTF11agg with the X-ray Telescope (XRT; Burrows et al. 2005) on board the Swift satellite on 2011 March 13 ( d). Data were reduced using the automated pipeline described by Butler & Kocevski (2007). No X-ray source is detected at the location of PTF11agg at this time. Assuming a power-law spectrum with a photon index of , we derive a upper limit on the 0.3–10 keV flux of erg cm-2 s-1.
Finally, we note that no historical X-ray emission has been reported at this location, neither in the ROSAT All-Sky Survey (0.1–2.4 keV; Voges et al. 1999) nor in any compilations of known Galactic X-ray sources (accessed via the HEASARC444See http://heasarc.gsfc.nasa.gov . and SIMBAD555See http://simbad.u-strasbg.fr/simbad . databases).
3 Comparison with Known Galactic Transients
The combination of (1) a rapidly fading optical transient ( mag in d) and (2) a faint, blue ( mag), quiescent optical counterpart makes PTF11agg unique amongst the thousands of discoveries by PTF to date. Together with (3) the long-lived ( d) radio emission, here we attempt to simultaneously account for these three distinguishing characteristics.
In order to understand the nature of the emission from PTF11agg, we must constrain its distance. In this section, we first consider a Galactic origin by comparing PTF11agg with known classes of Galactic transients.
Assuming the faint optical source is associated with PTF11agg (i.e., the quiescent counterpart), the measured color, mag, implies a spectral type of F2 ( K) for a main-sequence star. More conservatively, adopting our 3 limit on the color ( mag), we can rule out single main-sequence stars with K (i.e., cooler than spectral type K4). Given the observed brightness, a main-sequence star hotter than K4 would lie at a distance kpc. This firmly rules out an association with the Praesepe cluster ( pc); in fact, only 4 globular clusters are known to exist at such large distances in the extreme outer halo of the Milky Way (e.g., AM 1 at kpc; Madore & Arp 1979). In addition to the extremely small source densities this far in the halo, the inferred lower limit on the radio luminosity at such a distance ( erg s-1) is three orders of magnitude larger than the most luminous known stellar radio sources (e.g., RS CVn binaries, FK Com class stars, and Algol-class stars; Güdel 2002).
While a posteriori unlikely, it is nonetheless important to consider that the quiescent optical source may be unrelated to PTF11agg. Absent color information, an optical nondetection, even at the depth of our late-time imaging, is not sufficient to rule out a Galactic origin. With their smaller effective temperatures, low-mass stars and brown dwarfs (in particular ultracool stars, with spectral type later than M7) emit little flux in the optical bandpass. Furthermore, ultracool stars are known to exhibit high-amplitude, short timescale (minutes to hours) optical and radio outbursts that have in the past been mistaken for extragalactic transients (Becker et al., 2004; Kulkarni & Rau, 2006; Mahabal et al., 2012; Berger et al., 2012a).
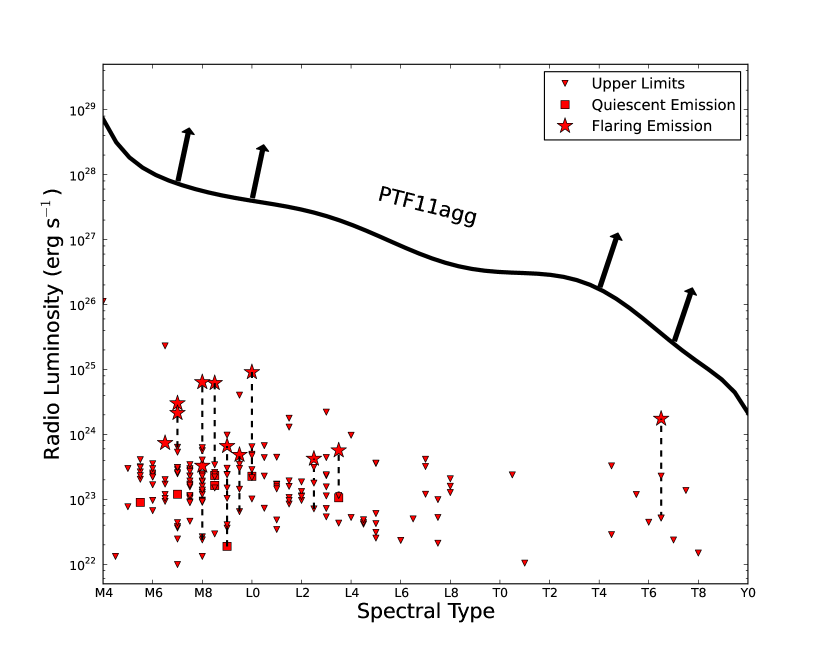
We can use our NIR limits on the quiescent emission at the location of PTF11agg to calculate the minimum distance to an ultracool star as a function of spectral type; in other words, for each spectral type, any object closer than this “detectability” distance would be identified in our NIR imaging. For spectral types later than M4, the strongest constraint is provided by our deepest epoch of -band imaging: mag. Using the observed -band magnitudes and distance (parallax) measurements for ultracool stars from Dahn et al. (2002) and Patten et al. (2006), we fit a low-order polynomial to calculate the absolute -band magnitude as a function of spectral type, , where for M5, for L2, etc. We find the scatter about our derived absolute -band magnitude fit is mag (i.e., 30%) over the range M5–T8. We then convert the observed peak radio flux density ( Jy) to a lower limit on the radio luminosity () using these distance constraints.
The resulting luminosity limits, as a function of spectral type, are plotted in Figure 5. For comparison, we have also plotted all radio observations of ultracool stars from the literature (see figure caption for references). Our luminosity limits are typically at least two orders of magnitude larger than the most luminous known ultracool stellar flares. Even comparing with the recently detected flare from the T6.5 dwarf 2MASS J1047+21, by far the coolest brown dwarf detected at radio frequencies (Route & Wolszczan, 2012), our limits require a radio luminosity a factor of times larger. We furthermore see no evidence for a high degree of circular polarization (common to many, though not all, flares; Berger 2006; Hallinan et al. 2007), and the radio emission from PTF11agg is much more long-lived than these low-mass stellar outbursts (durations typically of only hours).
In addition to stellar flares, binary systems where one member is a compact object (white dwarf, neutron star, or black hole) are known sources of optical and radio outbursts in the Milky Way. Such a system could circumvent two issues with Galactic transients we previously identified. First, the energy release during the accretion process is more than sufficient to power the observed radio flux; Cyg X-3 (Geldzahler et al., 1983), for example, has reached peak radio luminosities in excess of erg s-1. Second, the presence of an accretion disc can alter the optical color of such systems. Accordingly, our previous inference that the quiescent counterpart must lie at kpc would no longer be valid.
We consider first X-ray binaries, where the degenerate primary is a neutron star or black hole. Of particular interest are the subclass of microquasars (Mirabel & Rodríguez, 1999), whose powerful radio jets exhibit apparent superluminal motion (and thus imply a relativistic outflow). Due to the lack of a bright quiescent optical counterpart, we consider only low-mass systems where the accretion occurs via Roche-lobe overflow from the nondegenerate secondary (low-mass X-ray binaries, or LMXBs).
Black hole LMXBs are typically characterized by well-defined “states”: correlations between X-ray spectra, X-ray flux, and radio emission (Remillard & McClintock, 2006). Radio emission is observed in a well-defined region of this hardness-intensity phase space (Fender et al., 2004; Falcke et al., 2004). In the so-called low-hard state, thought to correspond to low (), radiatively inefficient accretion (Esin et al., 1997), relatively steady radio emission from a jet is observed in most black hole X-ray binary systems. Like PTF11agg, the radio spectrum is flat or inverted (, with –0.5), and circularly unpolarized. However, a reasonably tight correlation exists between the radio and X-ray luminosity in the low-hard state (Corbel et al., 2003; Gallo et al., 2003), of the form . Using the derived formulation from Gallo et al. (2003) and the observed radio flux, we would expect an X-ray flux of erg cm-2 s-1 (note that this estimate is entirely independent of the distance to the source). This is more than an order of magnitude above our derived X-ray limits. We further note that while neutron star X-ray binaries do not obey the same radio–X-ray correlation in the hard state, the ratio of X-ray to radio luminosity is even larger in these sources (Muno et al., 2005).
Alternatively, the most luminous radio flares from LMXBs arise as the system transitions through the intermediate state into a bright, quasi-thermal outburst (jet emission at the highest X-ray fluxes appears to be largely suppressed; Fender et al. 2004). Unlike the steady radio jets in the low-hard phase, this state transition in the accretion flow (from radiatively inefficient, advection-dominated to geometrically thin, optically thick; Esin et al. 1997) can sometimes cause the ejection of relativistic material (Mirabel & Rodríguez, 1999). While LMXBs in this state do not always follow the same radio–X-ray correlation (Gallo et al., 2003), the radio spectrum from this extended emission becomes optically thin. The X-ray and optical fluxes can rise by several orders of magnitude on a time scale of only a few days during these “X-ray novae,” but typically both take many months to return to quiescence (Tanaka & Shibazaki, 1996; Charles & Coe, 2006).
PTF11agg differs from these X-ray novae in several major respects. Most importantly, to reach the intermediate (and, ultimately, high) state where the radio flare is launched, the compact primary must be accreting material at a substantial fraction of the Eddington limit ( 1–10%; Esin et al. 1997). As a result, these outbursts have been discovered exclusively by wide-field X-ray or -ray satellites. But for any reasonable Galactic distance scale ( kpc), our X-ray limits rule out emission at the level of (for a 1 M⊙ black hole or neutron star). While our X-ray observations were obtained d after the initial optical outburst, this is comparable to the -folding time of these systems. As it requires month for the disc mass to accrete onto the neutron star or black hole (the viscous time scale; King & Ritter 1998), this time delay alone cannot account for the many orders of magnitude gap between our limits and the required X-ray luminosity.
In addition to the lack of bright X-ray emission, we note several more characteristics that distinguish PTF11agg from known X-ray nova outbursts: (1) the radio emission at late times remains unresolved, which is difficult to reconcile with relativistic ejecta in our Galaxy; (2) the inverted radio spectrum is inconsistent with the optically thin emission expected at this time; (3) the time scale of the optical decay ( d) is significantly shorter than what is observed in X-ray novae (–40 d); and (4) the location, well off the Galactic plane (, ), is inconsistent with the known population of LMXBs (van Paradijs & White, 1995; White & van Paradijs, 1996), which have a scale height of kpc (although several prominent counterexamples are known; Tomsick et al. 1999; Zurita et al. 2000; Hynes et al. 2000; Uemura et al. 2000; Mirabel et al. 2001; Wagner et al. 2001).
Finally, we consider systems with a white dwarf accreting material from a (low-mass) stellar companion or another white dwarf. Short-timescale optical outbursts have been observed from AM CVn systems (a white dwarf accreting H-poor material in a short-period orbit), but never with amplitudes larger than 4 mag (Levitan et al., 2011; Ramsay et al., 2012). Dwarf novae, the analogous phenomenon to X-ray novae in LMXBs (e.g., disc instabilities; Cannizzo 1993), have also in the past been mistaken for extragalactic transients (Rau et al., 2007). In fact, the amplitude and duration of the optical outburst from PTF11agg are not unlike the most extreme dwarf novae. But dwarf novae rarely exhibit coincident radio emission (Benz et al., 1996), and the few known examples have outburst durations of only 1–2 weeks (Benz et al., 1983; Körding et al., 2008), where the radio emission closely follows the optical evolution.
To summarize, we have examined a variety of known classes of Galactic transients (stellar flares, LMXBs, dwarf novae), and found that PTF11agg does not fit neatly into any of these categories. It should go without saying that it is entirely possible that PTF11agg represents a new type of Galactic outburst, characterized by (1) bright, rapidly fading optical emission; (2) a long-lived radio transient; and (3) an extremely subluminous ( mag for kpc) quiescent optical counterpart. Given the broad agreement between our observations and the properties of long-duration GRB afterglows (§5.1), we do not further explore this possibility here.
4 An Extragalactic Origin: Implications and Comparisons
Having rejected a Galactic origin for PTF11agg, we now consider the possibility that it resides instead at a cosmological distance (i.e., well beyond the Local Group and into the Hubble flow). Assuming the quiescent counterpart is indeed the host galaxy of PTF11agg, we constrain possible redshifts in §4.1. Even with these crude constraints, the angular size derived in §2.2.3 requires the presence of a relativistic outflow (§4.2). Finally, we briefly compare the observed properties with those of known extragalactic sources capable of generating relativistic ejecta in §4.3, and quickly settle on a long-duration GRB-like outburst (i.e., the core collapse of a massive star) as the most plausible explanation.
4.1 Redshift Constraints
Assuming the quiescent optical source is related to PTF11agg (§2.1.3), we can place an upper limit on its distance based on the absence of redshifted H I absorption along the line of sight (i.e., the Lyman break). Our detection implies that redshifted Ly ( Å) falls at an observed wavelength of Å (i.e., the middle of the filter bandpass). This results in an upper limit on the host-galaxy redshift of .
Alternatively, assuming a modest rest-frame UV luminosity for the host galaxy ( mag, or ; Reddy et al. 2008), we place a lower limit on the host redshift of . A similar lower limit is derived if we compare the observed -band brightness with that of known host galaxies of long-duration GRBs (Jakobsson et al., 2012).
We therefore conclude that the redshift of PTF11agg should fall somewhere in the range .
4.2 Evidence for Relativistic Ejecta
In §2.2.3, we derived two independent constraints on the angular diameter of the emitting region from our radio observations: as at d, and as at d. To convert these to constraints on the outflow velocity, we use the redshift limits derived above: (corresponding to angular-diameter distances of 1.3–1.8 Gpc for a concordance CDM cosmology). Assuming ballistic (i.e., constant velocity) expansion, the angular diameter is then given by
| (6) |
where is the outflow Lorentz factor (), is the speed of light, is the time since outburst (in the observer frame), is the angular-diameter distance, and is the source redshift.
At , where our limits on the outflow velocity are the weakest, we find at d, and at d. These limits vary little over our redshift range of interest, due primarily to the limited evolution of the angular-diameter distance over this range: at , we find at d, and at d.
We therefore conclude that, even at this late time, the ejecta powering the transient emission from PTF11agg are at least transrelativistic. For any more realistic form for the ejecta deceleration (e.g., Blandford & McKee 1976), we infer that PTF11agg was initially at least a modestly relativistic explosion.
4.3 Comparison with Known Relativistic Sources
Only a handful of extragalactic sources are known to produce relativistic ejecta: GRBs, with initial Lorentz factors as least as large as several hundred (Lithwick & Sari, 2001), and possibly greater than (Abdo et al., 2009); AGNs, in particular the subclass of blazars, with Lorentz factors as large as 50 (Lister et al., 2009); and the recently discovered relativistic tidal disruption flares (TDFs; Levan et al. 2011; Bloom et al. 2011; Zauderer et al. 2011; Burrows et al. 2011; Cenko et al. 2012), with initial Lorentz factors (Metzger et al., 2012; Berger et al., 2012b; van Velzen et al., 2011). Though with only one or two examples to date, the known relativistic TDFs do not appear to vary in the optical on time scales as short as those of PTF11agg, where d. Furthermore, the SEDs of these sources are dominated by the soft X-ray (–10 keV) bandpass, with peak isotropic luminosities as large as erg s-1. Even at , our X-ray limits (§2.3.2) imply erg s-1.
Blazars, however, are known to vary in the optical on short time scales ( d), and have in the past been mistaken for optically discovered GRB afterglows (Vanden Berk et al., 2002; Gal-Yam et al., 2002). But significant () interstellar scintillation is observed only very rarely in blazars ( of the population; Lovell et al. 2008). More importantly, the degree of optical variability observed from PTF11agg, in particular the amplitude from peak to quiescence ( mag in month), makes this source unlikely to belong to any known AGN class (MacLeod et al., 2012).
On the other hand, a long-duration GRB can naturally accommodate all of the observed properties of PTF11agg. We find that the standard GRB afterglow fireball model can accurately reproduce the observed optical and radio light curves (§5.1). The small initial size of the ejecta explains the observed interstellar scintillation, though this should be quenched as the blast wave expands relativistically (usually on a time scale of weeks to months). And the faint, blue quiescent optical counterpart is consistent with the long-duration GRB host-galaxy brightness distribution for (Jakobsson et al., 2012). We therefore conclude that the most likely explanation for PTF11agg is a long-duration GRB-like (i.e., massive star core collapse) explosion, the first time such an event has been discovered at cosmological distances absent a high-energy trigger.
5 PTF11agg as a GRB: Untriggered, Orphan, or Dirty Fireball?
Broadly speaking, there are three reasons why a distant, relativistic outburst may lack detected prompt high-energy emission. The null hypothesis is a lack of sky coverage (i.e., an “untriggered” GRB), as the more sensitive high-energy satellites (Swift and Fermi) have only a combined likelihood of detecting any given event (§2.3.1). The limiting -ray fluence from the only all-sky satellite available (the IPN) corresponds to an isotropic -ray energy release of (2–200) erg from – 3.0. These values are not sufficiently low to rule out typical cosmological long-duration GRBs (Butler et al., 2007), let alone the class of subluminous (e.g., GRB 980425 / SN 1998bw-like) events uncovered in relatively nearby galaxies (Soderberg et al., 2006b; Cobb et al., 2006; Guetta & Della Valle, 2007). Without any additional information, the simplest explanation is that PTF11agg is an otherwise normal but untriggered long-duration GRB.
There exist other, more intriguing, possibilities, however. The second possible explanation for a GRB-like explosion absent any high-energy signature is a viewing-angle effect. Due to their high degree of collimation (Sari et al., 1999; Rhoads, 1999), the prompt emission from most GRBs is beamed away from our line of sight. However, the long-lived afterglow emission may nonetheless be visible, either if the region generating the afterglow is less beamed than the -ray emitting material (i.e., an on-axis orphan afterglow; Nakar & Piran 2003), or if, as expected, the outflow spreads laterally at late times and illuminates an increasing fraction of the sky (i.e., an off-axis orphan afterglow; Rhoads 1997; Perna & Loeb 1998; Nakar et al. 2002). The discovery of a bona fide orphan afterglow would provide robust constraints on the GRB beaming fraction, still a large source of uncertainty in calculations of the true energy release and the all-sky rate of GRBs.
Finally, a source may lack detectable high-energy emission altogether, either because no high-energy photons were produced, or such emission may be unable to escape to distant observers due to some internal suppression mechanism. It has long been noted (e.g., Piran 2004, and references therein) that the baryon composition of the relativistic jet in the fireball model must be very finely tuned in order to generate any detectable prompt high-energy emission (the so-called “baryon loading problem”). Without any baryons in the ejecta, the internal shocks thought to power the prompt emission will not form666An alternative possibility is that the prompt emission is generated by magnetic dissipation in a Poynting-flux-dominated outflow (see, e.g., Lyutikov & Blandford 2003).. But with too large a baryon fraction, the jet will not accelerate to a sufficiently high initial Lorentz factor (), inhibiting any high-energy emission via – pair production (Huang et al., 2002; Ghirlanda et al., 2012). Such explosions, dubbed “dirty fireballs,” have long been predicted (Dermer et al., 2000; Huang et al., 2002; Rhoads, 2003) to occur as a result of a modest baryon loading of the jet; a proton content as small as will lower the initial Lorentz factor sufficiently (), yet can still produce the observed broad-band afterglow. Distinguishing between a source that produces no high-energy emission whatsoever and one in which these photons are unable to escape is clearly challenging – for the remainder of this work we shall refer to such objects generically as dirty fireballs or afterglows lacking prompt high-energy emission.
Here we attempt to discriminate between these competing hypotheses through two different means. First, we distinguish between on-axis and off-axis models by comparing the observed optical and radio emission with analytic and numerical predictions for GRB afterglow light curves in the fireball model (§5.1). Second, we calculate the rate of PTF11agg-like outbursts to determine if it is consistent with the all-sky (on-axis) GRB event rate (§5.2).
5.1 PTF11agg and the Fireball Model
In the standard GRB afterglow fireball model (see, e.g., Piran 2004 for a review), relativistic ejecta with (kinetic) energy sweep up material in the circumburst medium, forming a collisionless shock and accelerating electrons to a power-law distribution of energies with exponent and minimum Lorentz factor . It is assumed that a constant fraction of the total post-shock energy density is partitioned to the electrons () and the magnetic field (). These accelerated electrons then emit synchrotron radiation, powering the long-lived X-ray, optical, and radio afterglow.
The observed afterglow spectrum depends on the relative ordering of three critical frequencies: the frequency where self-absorption becomes important (), the characteristic frequency of the emission (), and the frequency above which electrons are able to cool efficiently through radiation (). We shall assume that all our observations occur in the “slow” cooling regime (), and that the self-absorption frequency falls below the frequency range probed by our observations ( Hz).
The light curve produced by such emission depends on the radial profile of the circumburst medium into which the shock is expanding. The simplest circumburst medium to consider is one in which the density is constant (). This scenario is also referred to as an interstellar medium (ISM; Sari et al. 1998), and is parametrized in terms of the particle number density , where g cm-3.
Long-duration GRBs, however, have been conclusively linked to the deaths of massive stars (e.g., Woosley & Bloom 2006). In the late stages of evolution, massive Wolf-Rayet stars are stripped of their outer H and (possibly) He envelopes in a wind, leaving behind a signature density profile that should be discernible in the afterglow light curve. Wind-like environments (Chevalier & Li, 2000) are parametrized in terms of , where g cm-3.
Finally, we note that the hydrodynamical evolution also depends on the geometry of the outflow. GRBs are now widely believed to be aspherical explosions (Rhoads, 1999; Sari et al., 1999), biconical jets with half-opening angle . At early times, the jet emission is collimated into a narrow cone (, where is the Lorentz factor of the expanding shock) due to relativistic beaming. As the shock slows, however, simple analytic solutions suggest that lateral spreading of the jet becomes important, and on-axis observers eventually “miss” emission from wider angles. This hydrodynamic transition manifests itself as an achromatic steepening in the afterglow light curve (the “jet break”), with an expected post-break decay proportional to . While more recent numerical simulations have suggested a more complex picture of the jet-break phenomenon (Zhang & MacFadyen, 2009; van Eerten et al., 2010; Granot & Piran, 2012), the assumption of a general light-curve steepening around the time when remains largely valid.
At d (the approximate time of discovery), we expect the optical bandpass to fall below the cooling frequency (i.e., ). If we also assume that these early optical data occur before any jet break (see below), the observed temporal decay index () can be translated directly into the electron spectral index . For a constant-density medium, we find , while for a wind-like environment, we infer . Electron spectral indices derived from previous observations of long-duration GRBs (Shen et al., 2006; Starling et al., 2008; Curran et al., 2010) fall in the range –3, so the large uncertainty makes it difficult to distinguish between the competing density profiles solely on this basis.
While the radio emission is relatively variable at d, the approximate radio spectral index, , implies that the peak synchrotron frequency is not well below the radio at this time (or else we would expect ). Conservatively, we assume GHz, and Jy. For a wind-like medium, and . Extrapolating back to the time of optical discovery, we conclude Hz, and Jy. For , . Thus, we find that the inferred optical (-band) flux at discovery, Jy, is a factor of larger than our observations at this time. For a constant-density environment, the peak flux is constant in time, and so a similar analysis yields a self-consistent result. We therefore do not consider a wind-like medium any further.
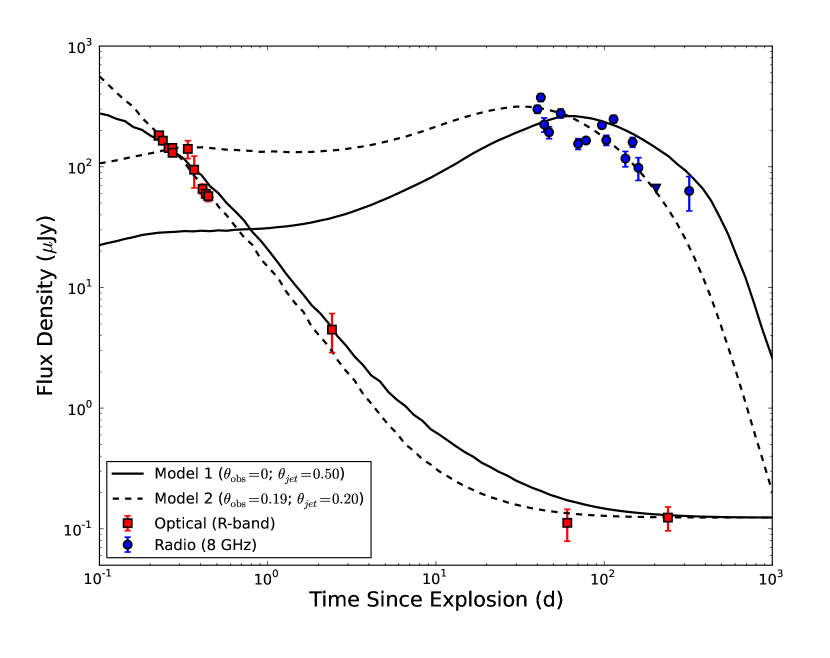
Using these general constraints, we have used the software described by van Eerten et al. (2012) to fit the observed optical and radio light curves to afterglow models calculated from high-resolution two-dimensional relativistic hydrodynamical jet simulations. In all cases, we have assumed a constant-density circumstellar medium and adopted a fiducial redshift of 1. We find that a relatively wide set of parameters is able to reproduce the observations777In all cases the predicted X-ray flux is well below the XRT limit (§2.3.2), so we have not included this point in our fitting., largely consistent with values derived from previous GRB afterglow modeling (Panaitescu & Kumar, 2001a, b; Yost et al., 2003), although with a somewhat smaller circumburst density ( cm-3). The best-fit model, assuming the observer is oriented directly along the jet axis (i.e., ), is plotted in Figure 6 ( erg, rad, cm-3, , , and ). Repeating a similar analysis with the software described by Yost et al. (2003) yields qualitatively similar results. The general agreement between the fireball model and our optical and radio observations supports our conclusion that PTF11agg is most likely a distant, relativistic explosion like other long-duration GRBs.
One concern regarding the models is the implied angular size of the source (). In the best-fit on-axis model, we find that the outflow has an angular size mas at d. This is somewhat larger than the value inferred from our scintillation analysis, but within a factor of two. However, many of the other models that provide a reasonable fit to the data are likely to be too spatially extended to scintillate strongly at d. One potential solution may be a more distant origin; due to cosmological time dilation, an observer-frame time of d would correspond to only 25 rest-frame days post-explosion at , half the expansion time as inferred at . Given the large spread in acceptable models, however, we do not explore this possibility further here.
Next we consider limits on the opening angle and observer orientation from the observed optical and radio emission. After the jet break, the peak synchrotron flux declines linearly with time (in a constant-density environment). Thus, if the jet break occurred well before the first radio observations, the large radio flux would be difficult to reconcile with our early optical observations. We consider it likely, then, that d. These conclusions are largely confirmed by our numerical models, where we find that the opening angle is only weakly constrained to be rad.
In addition to cases where the observer is oriented directly along the jet axis (i.e., ), we also have considered more general geometries, where the observer may be oriented off-axis, either within (i.e., ) or outside () the jet opening angle. For simplicity, we consider only “top-hat” jet geometries, where the jet Lorentz factor is given by a step function. For , observers will see rising emission until approximately the time of the jet break, after which the decay will resemble the on-axis case. For observers off-axis but within the jet opening angle, the modifications to the on-axis afterglow light curves will be more subtle (Granot et al., 2002; Zhang & MacFadyen, 2009; van Eerten et al., 2010).
The arguments used above to infer d necessarily require that the observer cannot be well outside the jet opening angle (or else we would expect to see post jet-break decay). This result is borne out by our numerical modeling, where geometries with are unable to accurately reproduce the observed light curves. Allowing the observer orientation to vary as a free parameter, the best-fit afterglow model is plotted as a dashed line in Figure 6 ( erg, rad, rad, cm-3, , , and ).
Finally, we can derive a lower limit on the distance to PTF11agg based only on the observed radio evolution. The radio spectrum at d, , with , is inconsistent with Sedov-Taylor blast-wave evolution. In other words, the outgoing shock wave has not transitioned to nonrelativistic expansion at this point in time. The nonrelativistic transition will occur at a time (Wygoda et al., 2011)
| (7) |
Even neglecting our previous finding of a low circumburst density, we infer a sizeable lower limit on the blast-wave kinetic energy: erg. Integrating over the observed 8 GHz radio light curve, we measure a fluence of erg cm-2. For a typical cosmological distance (, or cm), this corresponds to a radiated energy of erg, a typical radiative efficiency for a GRB. But for a Galactic outburst, the radiated energy would be many orders of magnitude smaller ( erg at kpc). Unless the radiative efficiency was incredibly small, we once again conclude that PTF11agg must lie at a cosmological distance.
5.2 The Rate of PTF11agg-like Events
Our objective in this section is to estimate the number of GRB optical afterglows discovered by chance (i.e., not as a result of deliberate follow-up observations of a high-energy trigger) by PTF. If the likelihood of chance detection of an untriggered afterglow with PTF is significant, we will conclude that the rate of PTF11agg-like events is consistent with the rate of normal (i.e., on-axis) long-duration GRBs. If this probability is small, then we can use these calculations to place lower limits on the observed frequency of PTF11agg-like outbursts (in units of the GRB rate). Given the relatively complex nature of PTF scheduling (Law et al., 2009), we have conducted a series of Monte Carlo simulations to this end.
PTF began full operations on about 2009 April 1. We have retrieved a listing of all images obtained beginning at this time through 2012 December 31, or over a period of 45 months. We removed fields at Galactic latitude (due to the large foreground extinction)888Given that the primary objective of PTF is the discovery of extragalactic transients, this represents less than 10% of the total number of observations.. The resulting sample includes 129,206 pointings, each covering an area of 7.2 deg2. The sample comprises 1940 unique fields, each imaged an average of 67 times.
Since launch, the Swift BAT999See http://swift.gsfc.nasa.gov/docs/swift/archive/grb_table . detects GRBs at a rate of yr-1. The field-of-view of the BAT is sr, and the instrument has a duty cycle of . Thus, the all-sky rate for events at the BAT threshold is yr-1. Over the 3.75 yr period of interest, the total number of all-sky GRBs is . We note that this is an upper limit to the long-duration GRB rate, as we have included short-duration GRBs in this sample as well.
For each trial, we create a mock catalog of 2360 GRBs. Each GRB is randomly assigned a trigger time (uniformly distributed between 2009 April 1 and 2012 December 31) and spatial coordinates , (isotropically distributed on the sky). To estimate the duration over which the optical afterglow would be detectable by PTF, we utilize the sample of 29 long-duration afterglows from the Palomar 60 inch (P60) Swift afterglow catalog (Cenko et al., 2009). These events were selected solely on the basis of visibility to Palomar Observatory, so they should represent an unbiased sample of the Swift afterglow brightness distribution. For each event in the P60-Swift sample, we have calculated the amount of time following the high-energy trigger that the afterglow is brighter than mag. These values range from s (GRB 050721) to 1.2 d (GRB 050820A). Each mock GRB is randomly assigned one of the 29 actual “visibility windows” from this sample101010For GRBs without any detected optical afterglow (e.g., “dark” bursts), we use the earliest non-detection below our sensitivity threshold for the visibility window. If anything, this would bias us to over-estimate the expected number of untriggered GRB afterglow detections by PTF..
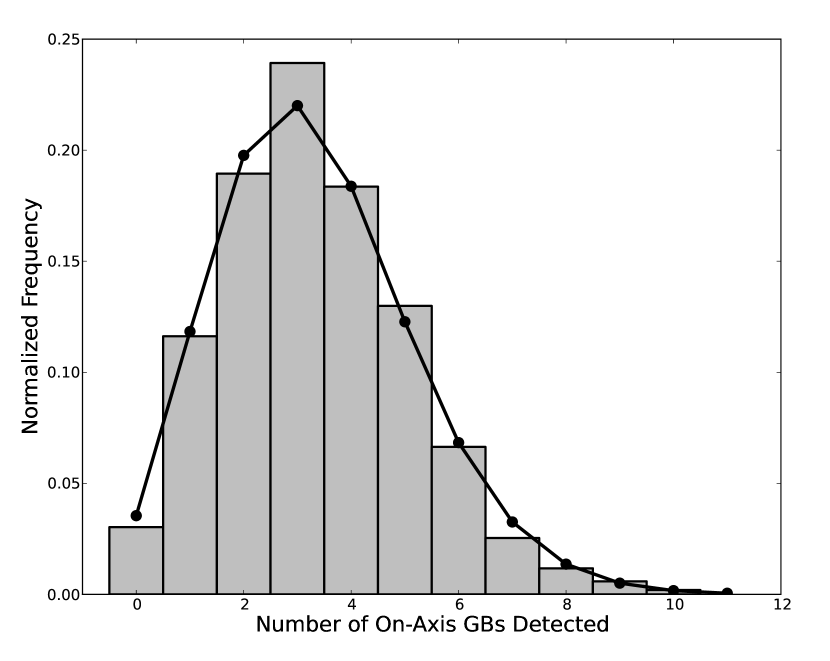
For each mock GRB, we then determine if the event occurred within the 7.2 deg2 footprint of any individual PTF image, and, if so, if the time of observation occurred within the necessary window during which the afterglow was brighter than 20 mag. The number of afterglows detected in each trial (), together with the number of individual frames on which each detected afterglow was brighter than the P48 sensitivity limit (), were then recorded. The results of 1000 individual runs (i.e., different randomly selected groups of 2360 GRBs) constitute a sufficiently large sample to evaluate the likelihood of serendipitous detection of long-duration GRB afterglows with PTF.
In the 1000 trials conducted, at least one GRB afterglow was detected (i.e., ) in 970 instances. Thus, the probability of detecting at least one on-axis afterglow over the course of the first two years of PTF is quite high, . The expectation value for the number of afterglows detected is . The distribution of the number of afterglows detected in our 1000 trials is reasonably well described by Poisson statistics (Figure 7). In this respect, then, PTF11agg appears to be consistent with a normal on-axis GRB.
However, the field in which PTF11agg was identified (the Beehive cluster) is atypical amongst PTF pointings. Most fields are only observed 2 or 3 times per night (multiple images are used to identify Solar-System objects). But the Beehive cluster is a “high-cadence” field, observed many times () per night during its observing season. Instead of calculating the rate of afterglow detections over the entire survey (i.e., ), a more appropriate comparison would limit the scope to similar high-cadence fields.
We therefore consider on how many individual images each of the “detected” GRB afterglows (in our 1000 trials) were above the P48 limiting magnitude (i.e., ). This is illustrated in Table 3. The vast majority of the afterglows are detected on only one or two images (87%). In fact, in our 1000 trials, an optical afterglow was detected on at least ten individual images only 11 times (i.e., ). PTF11agg was detected 11 times on 2011 January 30 with mag.
We can understand this result analytically in the following manner. In the case where the integration time () is much smaller than the period over which a transient is visible (), the number of detectable events at any given time will be
| (8) |
where is the field of view (in steradian) and is the all-sky event rate. For long-duration GRB optical afterglows, serendipitous detection by PTF will be dominated by the of events that remain brighter than mag for d (certainly this is true for those afterglows with ). Thus, for the PTF project, sr (7.2 deg2), and adopting 0.1 630 yr-1 and (1 d), we find events per field.
The expected number of detected events, , will then be , where is the number of (independent) measurement epochs. Over the two-year period of interest, the number of individual P48 images obtained is all. Thus, we predict , in good agreement with the results of our Monte Carlo simulations.
Conversely, we can calculate the relative frequency of high-cadence () observations in our two-year PTF sample by measuring how often each field was observed on a nightly basis. The results of this analysis are shown in the far-right column of Table 3. As is evident, high-cadence observations with () (i.e., more than 10 observations of a field obtained in a single night) occur with a frequency of 1% when compared with regular-cadence fields ().
From this analysis, we conclude that the rate of PTF11agg-like events is inconsistent with the rate of long-duration GRBs with 97.4% confidence. Admittedly a number of assumptions went into this analysis, and one should always be careful with results drawn from such an a posteriori analysis. But independent of the exact likelihood, we conclude that the probability of untriggered afterglow detection in a high-cadence PTF field is small. Either we have been quite lucky, or we may have uncovered a new, more common class of distant, relativistic outbursts lacking entirely in high-energy emission.
It is crucial to verify, however, that our inferred rate does not violate any other limits on short-timescale transients, either from PTF itself, or from previous optical and radio surveys. As highlighted above, low-cadence fields are observed significantly more frequently with PTF than high-cadence fields like the Beehive. Thus, any short-timescale ( d) transient should be detected in many more and fields than high-cadence fields. In the case of PTF11agg, repeating the above Monte Carlo simulations for a transient population with five times the GRB event rate (but the same optical brightness distribution), we find an expected number of detected sources of in all fields. At first glance, the fact that we have not discovered such a population of sources would seem to favor the untriggered GRB scenario.
Here it is important to distinguish between transient detection, by which we mean a source is above the P48 sensitivity limit on a given image, and discovery, where a transient is flagged as astrophysically interesting (by software or human beings; Bloom et al. 2012). Because of the large number of uncatalogued asteroids near the PTF limit, our software requires at least two detections at a given location to flag a source as a bona fide transient (e.g., to “discover” the source). Thus, any PTF11agg-like outburst with only a single detection () will never be discovered by our survey. Likewise, there may be subtle biases limiting our capability to identify and/or conduct follow-up observations of similar short-timescale transients with only a few detections.
Whether these discovery biases are sufficient to account for the lack of similar sources in our low-cadence fields with PTF remains to be seen. We have attempted to search through all PTF discoveries that were detected only on a single night (independent of )111111We cannot avoid the requirement of at least two detections, however. Otherwise we would be completely swamped with asteroids, which are detected at a rate of thousands per night., but have yet to uncover any additional viable candidates. Ultimately, future wide-field, high-cadence optical surveys may be required to resolve this issue.
Finally, we compare our derived rate of PTF11agg-like events with previous searches for orphan optical (Vanden Berk et al., 2002; Becker et al., 2004; Rykoff et al., 2005; Rau et al., 2006, 2008) and radio (Levinson et al., 2002; Berger et al., 2003; Gal-Yam et al., 2006; Soderberg et al., 2006a) afterglows, to verify that our results are consistent with these limits. The tightest constraints on the rate of relativistic outbursts come from radio surveys, where Gal-Yam et al. (2006) derive a limit on the all-sky volumetric rate of GRB-like explosions of events Gpc-3 yr-1. Even assuming an all-sky GRB rate as large (Guetta & Della Valle, 2007) as 100 Gpc-3 yr-1 (more recent estimates suggest a significantly smaller value; Butler et al. 2010), a population of PTF11agg-like events occurring at a rate of times that of normal GRBs is consistent with these results. Our derived rate is therefore orders of magnitude lower than the all-sky rate of Type Ibc supernovae ( Gpc-3 yr-1; Li et al. 2011). It may approach the rate of low-luminosity GRBs (Soderberg et al., 2006b; Cobb et al., 2006; Guetta & Della Valle, 2007), although this depends both on the assumed beaming correction and the true GRB rate.
6 Summary and Conclusions
To summarize our results, we report here the discovery of PTF11agg, a rapidly fading optical transient with a long-lived, scintillating radio counterpart. Together with the observed optical and radio light curves, the detection of a faint, blue quiescent counterpart at the location of PTF11agg indicates that the transient likely originated in the distant universe. Using our measurements of the source size derived from the radio observations, we infer that PTF11agg must be powered by a relativistic outflow. These properties are all consistent with the population of long-duration GRB afterglows, marking the first time such an event has been discovered at cosmological distances without a high-energy trigger.
Searching various high-energy satellites, we find no potential -ray counterpart for PTF11agg. We therefore consider three possible explanations that can simultaneously account for a GRB-like explosion without any associated prompt high-energy emission: an untriggered GRB, an orphan afterglow, and a dirty fireball.
Using the all-sky rate of GRBs discovered by the Swift satellite, together with a measurement of their observed optical brightness distribution, we have calculated the likelihood of serendipitous untriggered GRB afterglow detection by PTF (April 2009 – December 2012). Surprisingly, we found that the a posteriori probability of untriggered GRB afterglow detection in a high-cadence field like the one where PTF11agg was found (11 observations on a single night) is only 2.6%. While we cannot rule out entirely our null hypothesis that PTF11agg is an untriggered GRB, this probability is sufficiently low that we consider alternative interpretations as well.
The afterglow emission from an orphan GRB will rise in flux at early times, as more and more of the jet becomes visible due to relativistic beaming effects. Using both analytic and numerical formulations, we are unable to reproduce the observed PTF11agg light curves unless the observer viewing angle is within the opening angle of the jet. While these models assume a relatively simple jet structure, the requirement of rising afterglow emission at early times is a robust prediction for all off-axis models.
A more intriguing possibility is that PTF11agg may represent a new class of relativistic outbursts with little or no corresponding high-energy emission. In much the same way that SN 2009bb (Soderberg et al., 2010) demonstrated that the more nearby, subluminous class of GRBs may generate relativistic ejecta yet lack high-energy emission, PTF11agg may play an analogous role for the more energetic, cosmologically distant sample of long-duration GRBs. Dirty fireballs (i.e., a baryon-loaded jet) are one possible explanation, though alternative possibilities surely exist as well.
In this picture, the inferred rate of PTF11agg-like events must be four times higher (90% confidence) than the rate of on-axis long-duration GRBs. When combined with traditional core-collapse supernovae and long-duration GRBs, these objects would enable a more complete census of the deaths of massive stars, and also provide a probe of the location of massive-star formation in distant galaxies without the need for a high-energy satellite trigger.
Regardless of its ultimate origin, we expect such sources to be discovered in large numbers by ongoing and future wide-field, high-cadence optical surveys such as the Catalina Real-Time Transient Survey (Drake et al., 2009), PTF, Pan-STARRS (Kaiser et al., 2010), and the Large Synoptic Survey Telescope (Ivezic et al., 2008). Furthermore, the discovery of PTF11agg bodes well for optical surveys in the future era of gravitational wave astronomy, as the electromagnetic counterparts of gravitational wave sources should exhibit largely similar observational signatures (though they are also expected to be associated with more nearby galaxies; Nakar & Piran 2011; Metzger & Berger 2012).
References
- Abdo et al. (2009) Abdo, A. A., Ackermann, M., Ajello, M., et al. 2009, ApJ, 706, L138
- Agüeros et al. (2011) Agüeros, M. A., Covey, K. R., Lemonias, J. J., et al. 2011, ApJ, 740, 110
- Aihara et al. (2011) Aihara, H., Allende Prieto, C., An, D., et al. 2011, ApJS, 193, 29
- Antonova et al. (2007) Antonova, A., Doyle, J. G., Hallinan, G., Golden, A., & Koen, C. 2007, A&A, 472, 257
- Audard et al. (2007) Audard, M., Osten, R. A., Brown, A., et al. 2007, A&A, 471, L63
- Barthelmy et al. (2005) Barthelmy, S. D., Barbier, L. M., Cummings, J. R., et al. 2005, Space Sci. Rev., 120, 143
- Becker et al. (2004) Becker, A. C., Wittman, D. M., Boeshaar, P. C., et al. 2004, ApJ, 611, 418
- Benz et al. (1983) Benz, A. O., Fuerst, E., & Kiplinger, A. L. 1983, Nature, 302, 45
- Benz et al. (1996) Benz, A. O., Gudel, M., & Mattei, J. A. 1996, in Astronomical Society of the Pacific Conference Series, Vol. 93, Radio Emission from the Stars and the Sun, ed. A. R. Taylor & J. M. Paredes, 188
- Berger (2002) Berger, E. 2002, ApJ, 572, 503
- Berger (2006) —. 2006, ApJ, 648, 629
- Berger et al. (2012a) Berger, E., Fong, W., Sanders, N., & Chornock, R. 2012a, The Astronomer’s Telegram, 4619, 1
- Berger et al. (2003) Berger, E., Kulkarni, S. R., Frail, D. A., & Soderberg, A. M. 2003, ApJ, 599, 408
- Berger et al. (2012b) Berger, E., Zauderer, A., Pooley, G. G., et al. 2012b, ApJ, 748, 36
- Berger et al. (2001) Berger, E., Ball, S., Becker, K. M., et al. 2001, Nature, 410, 338
- Berger et al. (2005) Berger, E., Rutledge, R. E., Reid, I. N., et al. 2005, ApJ, 627, 960
- Berger et al. (2008a) Berger, E., Gizis, J. E., Giampapa, M. S., et al. 2008a, ApJ, 673, 1080
- Berger et al. (2008b) Berger, E., Basri, G., Gizis, J. E., et al. 2008b, ApJ, 676, 1307
- Berger et al. (2009) Berger, E., Rutledge, R. E., Phan-Bao, N., et al. 2009, ApJ, 695, 310
- Berger et al. (2010) Berger, E., Basri, G., Fleming, T. A., et al. 2010, ApJ, 709, 332
- Bertin et al. (2002) Bertin, E., Mellier, Y., Radovich, M., et al. 2002, in Astronomical Society of the Pacific Conference Series, Vol. 281, Astronomical Data Analysis Software and Systems XI, ed. D. A. Bohlender, D. Durand, & T. H. Handley, 228
- Blandford & McKee (1976) Blandford, R. D., & McKee, C. F. 1976, Physics of Fluids, 19, 1130
- Blanton & Roweis (2007) Blanton, M. R., & Roweis, S. 2007, AJ, 133, 734
- Bloom et al. (2002) Bloom, J. S., Kulkarni, S. R., & Djorgovski, S. G. 2002, AJ, 123, 1111
- Bloom et al. (2006) Bloom, J. S., Starr, D. L., Blake, C. H., Skrutskie, M. F., & Falco, E. E. 2006, in Astronomical Society of the Pacific Conference Series, Vol. 351, Astronomical Data Analysis Software and Systems XV, ed. C. Gabriel, C. Arviset, D. Ponz, & S. Enrique, 751
- Bloom et al. (2011) Bloom, J. S., Giannios, D., Metzger, B. D., et al. 2011, Science, 333, 203
- Bloom et al. (2012) Bloom, J. S., Richards, J. W., Nugent, P. E., et al. 2012, PASP, 124, 1175
- Burgasser & Putman (2005) Burgasser, A. J., & Putman, M. E. 2005, ApJ, 626, 486
- Burrows et al. (2005) Burrows, D. N., Hill, J. E., Nousek, J. A., et al. 2005, Space Sci. Rev., 120, 165
- Burrows et al. (2011) Burrows, D. N., Kennea, J. A., Ghisellini, G., et al. 2011, Nature, 476, 421
- Butler et al. (2010) Butler, N. R., Bloom, J. S., & Poznanski, D. 2010, ApJ, 711, 495
- Butler & Kocevski (2007) Butler, N. R., & Kocevski, D. 2007, ApJ, 663, 407
- Butler et al. (2007) Butler, N. R., Kocevski, D., Bloom, J. S., & Curtis, J. L. 2007, ApJ, 671, 656
- Cannizzo (1993) Cannizzo, J. K. 1993, The Limit Cycle Instability in Dwarf Nova Accretion Disks, ed. Wheeler, J. C., 6
- Cardelli et al. (1989) Cardelli, J. A., Clayton, G. C., & Mathis, J. S. 1989, ApJ, 345, 245
- Cenko et al. (2009) Cenko, S. B., Kelemen, J., Harrison, F. A., et al. 2009, ApJ, 693, 1484
- Cenko et al. (2012) Cenko, S. B., Krimm, H. A., Horesh, A., et al. 2012, ApJ, 753, 77
- Chandra & Frail (2012) Chandra, P., & Frail, D. A. 2012, ApJ, 746, 156
- Charles & Coe (2006) Charles, P. A., & Coe, M. J. 2006, Optical, ultraviolet and infrared observations of X-ray binaries, ed. Lewin, W. H. G. & van der Klis, M. (Cambridge, UK: Cambridge University Press), 215
- Chevalier & Li (2000) Chevalier, R. A., & Li, Z.-Y. 2000, ApJ, 536, 195
- Cobb et al. (2006) Cobb, B. E., Bailyn, C. D., van Dokkum, P. G., & Natarajan, P. 2006, ApJ, 645, L113
- Corbel et al. (2003) Corbel, S., Nowak, M. A., Fender, R. P., Tzioumis, A. K., & Markoff, S. 2003, A&A, 400, 1007
- Cordes & Lazio (2002) Cordes, J. M., & Lazio, T. J. W. 2002, arXiv:astro-ph/0207156
- Curran et al. (2010) Curran, P. A., Evans, P. A., de Pasquale, M., Page, M. J., & van der Horst, A. J. 2010, ApJ, 716, L135
- Dahn et al. (2002) Dahn, C. C., Harris, H. C., Vrba, F. J., et al. 2002, AJ, 124, 1170
- Dermer et al. (2000) Dermer, C. D., Chiang, J., & Mitman, K. E. 2000, ApJ, 537, 785
- Drake et al. (2009) Drake, A. J., Djorgovski, S. G., Mahabal, A., et al. 2009, ApJ, 696, 870
- Dressler et al. (2011) Dressler, A., Bigelow, B., Hare, T., et al. 2011, PASP, 123, 288
- Esin et al. (1997) Esin, A. A., McClintock, J. E., & Narayan, R. 1997, ApJ, 489, 865
- Falcke et al. (2004) Falcke, H., Körding, E., & Markoff, S. 2004, A&A, 414, 895
- Fender et al. (2004) Fender, R. P., Belloni, T. M., & Gallo, E. 2004, MNRAS, 355, 1105
- Gal-Yam et al. (2002) Gal-Yam, A., Ofek, E. O., Filippenko, A. V., Chornock, R., & Li, W. 2002, PASP, 114, 587
- Gal-Yam et al. (2006) Gal-Yam, A., Ofek, E. O., Poznanski, D., et al. 2006, ApJ, 639, 331
- Gallo et al. (2003) Gallo, E., Fender, R. P., & Pooley, G. G. 2003, MNRAS, 344, 60
- Gehrels et al. (2004) Gehrels, N., Chincarini, G., Giommi, P., et al. 2004, ApJ, 611, 1005
- Geldzahler et al. (1983) Geldzahler, B. J., Johnston, K. J., Spencer, J. H., et al. 1983, ApJ, 273, L65
- Ghirlanda et al. (2012) Ghirlanda, G., Nava, L., Ghisellini, G., et al. 2012, MNRAS, 420, 483
- Granot et al. (2002) Granot, J., Panaitescu, A., Kumar, P., & Woosley, S. E. 2002, ApJ, 570, L61
- Granot & Piran (2012) Granot, J., & Piran, T. 2012, MNRAS, 421, 570
- Güdel (2002) Güdel, M. 2002, ARA&A, 40, 217
- Guetta & Della Valle (2007) Guetta, D., & Della Valle, M. 2007, ApJ, 657, L73
- Hallinan et al. (2007) Hallinan, G., Bourke, S., Lane, C., et al. 2007, ApJ, 663, L25
- Hogg et al. (1997) Hogg, D. W., Pahre, M. A., McCarthy, J. K., et al. 1997, MNRAS, 288, 404
- Huang et al. (2002) Huang, Y. F., Dai, Z. G., & Lu, T. 2002, MNRAS, 332, 735
- Hurley et al. (2010) Hurley, K., Golenetskii, S., Aptekar, R., et al. 2010, in Deciphering the Ancient Universe with Gamma-Ray Bursts, Vol. 1279, American Institute of Physics Conference Series, ed. N. Kawai & S. Nagataki, 330–333
- Hynes et al. (2000) Hynes, R. I., Mauche, C. W., Haswell, C. A., et al. 2000, ApJ, 539, L37
- Ivezic et al. (2008) Ivezic, Z., Tyson, J. A., Acosta, E., et al. 2008, arXiv:astro-ph/0805.2366
- Jakobsson et al. (2012) Jakobsson, P., Hjorth, J., Malesani, D., et al. 2012, ApJ, 752, 62
- Kaiser et al. (2010) Kaiser, N., Burgett, W., Chambers, K., et al. 2010, in Ground-based and Airborne Telescopes III, Vol. 7733, Society of Photo-Optical Instrumentation Engineers (SPIE) Conference Series, 77330
- Kann et al. (2010) Kann, D. A., Klose, S., Zhang, B., et al. 2010, ApJ, 720, 1513
- King & Ritter (1998) King, A. R., & Ritter, H. 1998, MNRAS, 293, L42
- Körding et al. (2008) Körding, E., Rupen, M., Knigge, C., et al. 2008, Science, 320, 1318
- Kulkarni & Rau (2006) Kulkarni, S. R., & Rau, A. 2006, ApJ, 644, L63
- Kulkarni et al. (1998) Kulkarni, S. R., Frail, D. A., Wieringa, M. H., et al. 1998, Nature, 395, 663
- Law et al. (2009) Law, N. M., Kulkarni, S. R., Dekany, R. G., et al. 2009, PASP, 121, 1395
- Levan et al. (2011) Levan, A. J., Tanvir, N. R., Cenko, S. B., et al. 2011, Science, 333, 199
- Levinson et al. (2002) Levinson, A., Ofek, E. O., Waxman, E., & Gal-Yam, A. 2002, ApJ, 576, 923
- Levitan et al. (2011) Levitan, D., Fulton, B. J., Groot, P. J., et al. 2011, ApJ, 739, 68
- Li et al. (2011) Li, W., Chornock, R., Leaman, J., et al. 2011, MNRAS, 412, 1473
- Lister et al. (2009) Lister, M. L., Cohen, M. H., Homan, D. C., et al. 2009, AJ, 138, 1874
- Lithwick & Sari (2001) Lithwick, Y., & Sari, R. 2001, ApJ, 555, 540
- Lovell et al. (2008) Lovell, J. E. J., Rickett, B. J., Macquart, J.-P., et al. 2008, ApJ, 689, 108
- Lyutikov & Blandford (2003) Lyutikov, M., & Blandford, R. 2003, arXiv:astro-ph/0312347
- MacLeod et al. (2012) MacLeod, C. L., Ivezić, Ž., Sesar, B., et al. 2012, ApJ, 753, 106
- Madore & Arp (1979) Madore, B. F., & Arp, H. C. 1979, ApJ, 227, L103
- Mahabal et al. (2012) Mahabal, A. A., et al. 2012, The Astronomer’s Telegram, 4586, 1
- McLean et al. (2012) McLean, M., Berger, E., & Reiners, A. 2012, ApJ, 746, 23
- Meegan et al. (2009) Meegan, C., Lichti, G., Bhat, P. N., et al. 2009, ApJ, 702, 791
- Metzger & Berger (2012) Metzger, B. D., & Berger, E. 2012, ApJ, 746, 48
- Metzger et al. (2012) Metzger, B. D., Giannios, D., & Mimica, P. 2012, MNRAS, 420, 3528
- Mirabel et al. (2001) Mirabel, I. F., Dhawan, V., Mignani, R. P., Rodrigues, I., & Guglielmetti, F. 2001, Nature, 413, 139
- Mirabel & Rodríguez (1999) Mirabel, I. F., & Rodríguez, L. F. 1999, ARA&A, 37, 409
- Muno et al. (2005) Muno, M. P., Belloni, T., Dhawan, V., et al. 2005, ApJ, 626, 1020
- Nakar & Piran (2003) Nakar, E., & Piran, T. 2003, New Astronomy, 8, 141
- Nakar & Piran (2011) —. 2011, Nature, 478, 82
- Nakar et al. (2002) Nakar, E., Piran, T., & Granot, J. 2002, ApJ, 579, 699
- Nysewander et al. (2009) Nysewander, M., Fruchter, A. S., & Pe’er, A. 2009, ApJ, 701, 824
- Oates et al. (2009) Oates, S. R., Page, M. J., Schady, P., et al. 2009, MNRAS, 395, 490
- Ofek et al. (2012) Ofek, E. O., Laher, R., Law, N., et al. 2012, PASP, 124, 62
- Oke & Gunn (1983) Oke, J. B., & Gunn, J. E. 1983, ApJ, 266, 713
- Oke et al. (1995) Oke, J. B., Cohen, J. G., Carr, M., et al. 1995, PASP, 107, 375
- Panaitescu & Kumar (2001a) Panaitescu, A., & Kumar, P. 2001a, ApJ, 560, L49
- Panaitescu & Kumar (2001b) —. 2001b, ApJ, 554, 667
- Panaitescu & Vestrand (2008) Panaitescu, A., & Vestrand, W. T. 2008, MNRAS, 387, 497
- Patten et al. (2006) Patten, B. M., Stauffer, J. R., Burrows, A., et al. 2006, ApJ, 651, 502
- Perley et al. (2011) Perley, R. A., Chandler, C. J., Butler, B. J., & Wrobel, J. M. 2011, ApJ, 739, L1
- Perna & Loeb (1998) Perna, R., & Loeb, A. 1998, ApJ, 509, L85
- Piran (2004) Piran, T. 2004, Reviews of Modern Physics, 76, 1143
- Rahmer et al. (2008) Rahmer, G., Smith, R., Velur, V., et al. 2008, in Ground-based and Airborne Instrumentation for Astronomy II, Vol. 7014, Society of Photo-Optical Instrumentation Engineers (SPIE) Conference Series, 70144
- Ramsay et al. (2012) Ramsay, G., Barclay, T., Steeghs, D., et al. 2012, MNRAS, 419, 2836
- Rau et al. (2006) Rau, A., Greiner, J., & Schwarz, R. 2006, A&A, 449, 79
- Rau et al. (2008) Rau, A., Ofek, E. O., Kulkarni, S. R., et al. 2008, ApJ, 682, 1205
- Rau et al. (2007) Rau, A., Schwarz, R., Kulkarni, S. R., et al. 2007, ApJ, 664, 474
- Rau et al. (2009) Rau, A., Kulkarni, S. R., Law, N. M., et al. 2009, PASP, 121, 1334
- Readhead (1994) Readhead, A. C. S. 1994, ApJ, 426, 51
- Reddy et al. (2008) Reddy, N. A., Steidel, C. C., Pettini, M., et al. 2008, ApJS, 175, 48
- Remillard & McClintock (2006) Remillard, R. A., & McClintock, J. E. 2006, ARA&A, 44, 49
- Rhoads (1997) Rhoads, J. E. 1997, ApJ, 487, L1
- Rhoads (1999) —. 1999, ApJ, 525, 737
- Rhoads (2003) —. 2003, ApJ, 591, 1097
- Rickett (1990) Rickett, B. J. 1990, ARA&A, 28, 561
- Route & Wolszczan (2012) Route, M., & Wolszczan, A. 2012, ApJ, 747, L22
- Rykoff et al. (2005) Rykoff, E. S., Aharonian, F., Akerlof, C. W., et al. 2005, ApJ, 631, 1032
- Rykoff et al. (2009) —. 2009, ApJ, 702, 489
- Sari et al. (1999) Sari, R., Piran, T., & Halpern, J. P. 1999, ApJ, 519, L17
- Sari et al. (1998) Sari, R., Piran, T., & Narayan, R. 1998, ApJ, 497, L17
- Sault et al. (1995) Sault, R. J., Teuben, P. J., & Wright, M. C. H. 1995, in Astronomical Society of the Pacific Conference Series, Vol. 77, Astronomical Data Analysis Software and Systems IV, ed. R. A. Shaw, H. E. Payne, & J. J. E. Hayes, 433
- Schlegel et al. (1998) Schlegel, D. J., Finkbeiner, D. P., & Davis, M. 1998, ApJ, 500, 525
- Shen et al. (2006) Shen, R., Kumar, P., & Robinson, E. L. 2006, MNRAS, 371, 1441
- Skrutskie et al. (2006) Skrutskie, M. F., Cutri, R. M., Stiening, R., et al. 2006, AJ, 131, 1163
- Soderberg et al. (2006a) Soderberg, A. M., Nakar, E., Berger, E., & Kulkarni, S. R. 2006a, ApJ, 638, 930
- Soderberg et al. (2006b) Soderberg, A. M., Kulkarni, S. R., Nakar, E., et al. 2006b, Nature, 442, 1014
- Soderberg et al. (2010) Soderberg, A. M., Chakraborti, S., Pignata, G., et al. 2010, Nature, 463, 513
- Spergel et al. (2007) Spergel, D. N., Bean, R., Doré, O., et al. 2007, ApJS, 170, 377
- Starling et al. (2008) Starling, R. L. C., van der Horst, A. J., Rol, E., et al. 2008, ApJ, 672, 433
- Tanaka & Shibazaki (1996) Tanaka, Y., & Shibazaki, N. 1996, ARA&A, 34, 607
- Tody (1986) Tody, D. 1986, in Instrumentation in astronomy VI, Vol. 627, Society of Photo-Optical Instrumentation Engineers (SPIE) Conference Series, ed. D. L. Crawford, 733
- Tomsick et al. (1999) Tomsick, J. A., Halpern, J. P., Kemp, J., & Kaaret, P. 1999, ApJ, 521, 341
- Uemura et al. (2000) Uemura, M., Kato, T., Matsumoto, K., et al. 2000, PASJ, 52, L15
- van Eerten et al. (2012) van Eerten, H., van der Horst, A., & MacFadyen, A. 2012, ApJ, 749, 44
- van Eerten et al. (2010) van Eerten, H., Zhang, W., & MacFadyen, A. 2010, ApJ, 722, 235
- van Paradijs & White (1995) van Paradijs, J., & White, N. 1995, ApJ, 447, L33
- van Velzen et al. (2011) van Velzen, S., Körding, E., & Falcke, H. 2011, MNRAS, 417, L51
- Vanden Berk et al. (2002) Vanden Berk, D. E., Lee, B. C., Wilhite, B. C., et al. 2002, ApJ, 576, 673
- Voges et al. (1999) Voges, W., Aschenbach, B., Boller, T., et al. 1999, A&A, 349, 389
- Wagner et al. (2001) Wagner, R. M., Foltz, C. B., Shahbaz, T., et al. 2001, ApJ, 556, 42
- Walker (1998) Walker, M. A. 1998, MNRAS, 294, 307
- White & van Paradijs (1996) White, N. E., & van Paradijs, J. 1996, ApJ, 473, L25
- Wilson et al. (2003) Wilson, J. C., Eikenberry, S. S., Henderson, C. P., et al. 2003, in Instrument Design and Performance for Optical/Infrared Ground-based Telescopes, Vol. 4841, Society of Photo-Optical Instrumentation Engineers (SPIE) Conference Series, ed. M. Iye & A. F. M. Moorwood, 451
- Woosley & Bloom (2006) Woosley, S. E., & Bloom, J. S. 2006, ARA&A, 44, 507
- Wygoda et al. (2011) Wygoda, N., Waxman, E., & Frail, D. A. 2011, ApJ, 738, L23
- Yost et al. (2003) Yost, S. A., Harrison, F. A., Sari, R., & Frail, D. A. 2003, ApJ, 597, 459
- Zauderer et al. (2011) Zauderer, B. A., Berger, E., Soderberg, A. M., et al. 2011, Nature, 476, 425
- Zhang & MacFadyen (2009) Zhang, W., & MacFadyen, A. 2009, ApJ, 698, 1261
- Zurita et al. (2000) Zurita, C., Casares, J., Shahbaz, T., et al. 2000, MNRAS, 316, 137
| Date | Telescope/Instrument | Filter | Exposure Time | Magnitude |
|---|---|---|---|---|
| (MJD) | (s) | |||
| 55590.30519 | P48/CFHT12k | 540 | ||
| 55591.22026 | P48/CFHT12k | 60 | ||
| 55591.22245 | P48/CFHT12k | 60 | ||
| 55591.23391 | P48/CFHT12k | 60 | ||
| 55591.25326 | P48/CFHT12k | 60 | ||
| 55591.26691 | P48/CFHT12k | 60 | ||
| 55591.26800 | P48/CFHT12k | 60 | ||
| 55591.33081 | P48/CFHT12k | 60 | ||
| 55591.36188 | P48/CFHT12k | 60 | ||
| 55591.40604 | P48/CFHT12k | 60 | ||
| 55591.42439 | P48/CFHT12k | 60 | ||
| 55591.43978 | P48/CFHT12k | 60 | ||
| 55593.40775 | P48/CFHT12k | 420 | ||
| 55594.23819 | P48/CFHT12k | 300 | ||
| 55621.19100 | PAIRITEL | 2246 | ||
| 55621.19100 | PAIRITEL | 2246 | ||
| 55621.19100 | PAIRITEL | 2246 | ||
| 55624.49 – 55678.28 | Keck I/LRIS | 6680 | ||
| 55624.49 – 55678.28 | Keck I/LRIS | 5700 | ||
| 55830.60259 | Keck I/LRIS | 2100 | ||
| 55830.59849 | Keck I/LRIS | 2160 | ||
| 55944.22461 | Magellan/IMACS | 2400 | ||
| 56014.27324 | P200/WIRC | 1200 |
| Date | Observatory | Frequency | Integration Time | Flux Density |
|---|---|---|---|---|
| (2011 UT) | (GHz) | (min) | (Jy) | |
| Mar. 11.27 | VLA | 8.46 | 15.5 | |
| Mar. 13.12 | VLA | 4.50 | 15.5 | |
| Mar. 13.12 | VLA | 7.92 | 15.5 | |
| Mar. 14.05 | CARMA | 93.5 | 492.0 | |
| Mar. 15.08 | VLA | 4.50 | 15.5 | |
| Mar. 15.08 | VLA | 7.92 | 15.5 | |
| Mar. 18.08 | VLA | 4.50 | 15.5 | |
| Mar. 18.08 | VLA | 7.92 | 15.5 | |
| Mar. 18.10 | VLA | 22.46 | 10.8 | |
| Mar. 18.15 | VLA | 4.50 | 15.5 | |
| Mar. 18.15 | VLA | 7.92 | 15.5 | |
| Mar. 18.17 | VLA | 22.46 | 10.8 | |
| Mar. 26.22 | VLA | 8.46 | 15.5 | |
| Apr. 5.17 | VLA | 21.8 | 30.1 | |
| Apr. 7.03 | CARMA | 93.5 | 378.0 | |
| Apr. 10.11 | VLA | 4.8 | 13.7 | |
| Apr. 10.11 | VLA | 7.4 | 13.7 | |
| Apr. 11.01 | CARMA | 93.5 | 342.0 | |
| Apr. 18.15 | VLA | 4.8 | 37.2 | |
| Apr. 18.15 | VLA | 7.4 | 37.2 | |
| May 6.08 | VLA | 4.8 | 13.7 | |
| May 6.08 | VLA | 7.4 | 13.7 | |
| May 13.15 | VLA | 4.8 | 12.9 | |
| May 13.15 | VLA | 7.4 | 12.9 | |
| May 14.03 | VLA | 21.8 | 28.5 | |
| May 23.96 | VLA | 4.8 | 8.7 | |
| May 23.96 | VLA | 7.4 | 8.7 | |
| June 1.06 | VLA | 22.5 | 26.5 | |
| June 12.88 | VLA | 4.8 | 13.8 | |
| June 12.88 | VLA | 7.8 | 13.8 | |
| June 26.86 | VLA | 4.8 | 14.0 | |
| June 26.86 | VLA | 7.4 | 14.0 | |
| July 9.94 | VLA | 4.8 | 14.0 | |
| July 9.94 | VLA | 7.4 | 14.0 | |
| Aug. 21.71 | VLA | 8.5 | 37.2 | |
| Dec. 16.45 | VLA | 8.4 | 25.0 |
| 1 | 1311 | 11376 |
| 2 | 1583 | 40101 |
| 3 | 228 | 5889 |
| 4 | 118 | 825 |
| 5 | 30 | 693 |
| 6 | 31 | 305 |
| 7 | 6 | 189 |
| 8 | 4 | 113 |
| 9 | 3 | 54 |
| 26 | 426 |