Non-parametric resampling of random walks for spectral network clustering
Abstract
Parametric resampling schemes have been recently introduced in complex network analysis with the aim of assessing the statistical significance of graph clustering and the robustness of community partitions. We propose here a method to replicate structural features of complex networks based on the non-parametric resampling of the transition matrix associated with an unbiased random walk on the graph. We test this bootstrapping technique on synthetic and real-world modular networks and we show that the ensemble of replicates obtained through resampling can be used to improve the performance of standard spectral algorithms for community detection.
pacs:
89.75.-k, 02.50.Ga, 05.10.LnIn the past decade, network science has proven to be a robust and comprehensive framework to investigate, model and understand the structure and function of the complex interaction patterns observed in diverse biological, physical, social and technological systems boccaletti ; Barabasi2002rev ; Barrat2008 ; Newman2010 . One of the most intriguing characteristic of many real-world complex networks is the presence of communities, i.e. tightly-knit groups of nodes which exhibit poor connectivity with the rest of the graph Girvan2002 . As a matter of fact, many experimental evidences have confirmed that communities are the meso-scale building blocks of complex networks: they usually correspond to functional modules in the brain Bullmore2009 ; chavez , to topical clusters in social and communication networks Newman2004 , to metabolic reactions and functional domains in protein interaction networks Guimera2005 ; Jonsson2006 , to disciplines and research areas in collaboration networks Girvan2002 . Consequently, a lot of effort has been devoted to the identification of efficient algorithms for community detection fortunato .
A typical problem in complex networks analysis is that a real-world network is just a single observation drawn from an unknown distribution of graphs having certain characteristics wassermanBOOK . As a consequence, there is no predefined way to assess the statistical variability of any local, meso-scale of global network property, including the presence and composition of communities. A widely used approach to determine the statistical significance of network observables consists in considering random network ensembles, i.e. sets of graphs obtained from the original network by keeping fixed some structural properties (e.g. the degree sequence or the clustering coefficient) and rewiring the edges at random maslov ; ziv ; bianconi2 . In the case of community detection, this approach led to the definition of the modularity function, which quantifies the significance of a given community partition of a graph as the deviation from the average modularity expected in an ensemble of random graphs having the same degree sequence Newman2004 . Another possibility is parametric bootstrapping, in which the robusteness of a network property is assessed against small perturbations of the graph connectivity gfeller ; karrer ; rosvall . This approach relies on the hypothesis that the observed network is representative of a set of graphs (a model) having a certain (a-priori known) structure. Consequently, the variability of any network observable can be estimated as the deviation from the average of the corresponding model. Many different parametric resampling schemes have been used to assess the robustness of network communities against small connectivity perturbations. However, all these methods require an a-priori hypothesis about the model to which the network belongs, so that the unbiased statistical assessment of a network partition remains an open challenge mirshahvalad .
A possible solution to this problem is non-parametric bootstrapping, a data-driven technique for providing the statistical confidence of almost any statistical estimate efronBOOK ; efron , based on the generation of repeated observations (replicates) from an unknown population using the available data samples (in our case, a single network) as a starting point. This approach has been successfully employed for several different applications, and in particular to improve the stability and accuracy of clustering algorithms in metric spaces Strehl02 .
In this Brief Report we propose to use non-parametric bootstrapping to improve the performance of spectral community detection algorithms. The method is based on the construction of replicates of the transition matrix of the network, and on the estimation of an average distance matrix, whose elements correspond to the expected spectral distances between pairs of nodes of the graph, averaged over the ensemble of replicates. Then, the obtained distance matrix is fed into a standard hierarchical clustering algorithm. The idea is that the aggregation of information about different replicates, representative of the unknown ensemble to which the network belongs, should filter out noise and allow to obtain more accurate and robust partitions than the one found on the original network. This approach is in the same line of ensemble or consensus clustering methods, which combine several partitions generated by different clustering algorithms —or by different runs of the same algorithm— into a single, more robust partition Kwak2009 ; karrer ; rosvall ; kim ; lancichinetti12 . We analyze the community partitions obtained by non-parametric bootstrapping in different synthetic and real-world modular networks, and we show that this approach can substantially improve the performances of existing spectral clustering methods.
Spectral clustering for community detection.– Let be a connected undirected and unweighted graph with nodes and edges, and let be the adjacency matrix of , whose entry if there is an edge connecting node and node , while otherwise. We consider the problem of finding communities of , i.e. subsets of nodes of which are more connected internally than with the rest of the graph Newman2004 . Several community detection algorithms are based on mapping each node of into a point of an appropriate metric space , so that two nodes and having similar structural properties (e.g., similar set of neighbours) are mapped to two points and placed relatively close to each other in . Then, the nodes are clustered according to the Euclidean distance between their corresponding images in , so that nodes whose projections are closer in have a higher probability to be put in the same cluster.
A widely adopted method to map the nodes of a graph into a metric space makes use of spectral properties of matrices associated to , and in particular of the eigenvectors of the adjacency matrix or, more frequently, of the transition matrix associated to an unbiased random walk on the graph (, where is the degree of node ) gfeller2 ; chavez ; cvetkovicBook ; chungBook . This choice is motivated by the observation that both and carry information about the overall structure of the graph. Here we consider the transition matrix . This matrix is characterized by a set of eigenvalues such that . Each eigenvalue is associated to the left and right eigenvectors and , which satisfy and , respectively. Thus, it is possible to map node to the point whose coordinate is equal to the the component of the right eigenvector of . The distance between two points and , can be written in terms of eigenvectors and eigenvalues of lafon2006 , namely: where denotes the component of the right eigenvector. In general, this distance can be approximated by using only the first nontrivial eigenvectors and eigenvalues of note_approx :
| (1) |
The elements of the matrix obtained from Eq. (1) represent the distances between each pair of points and in the lower dimensional space .
Since the terms represent distances in a metric space, then we can use the matrix to detect candidate community partitions of by means of hierarchical clustering, an iterative aggregation algorithm which starts by considering each node as a separate cluster, and successively merges the two clusters having minimal distance according to note_linkage . The algorithm stops when all the nodes have been grouped in a single cluster. The hierarchical clustering algorithm produces a dendrogram , i.e. a tree where each of the internal nodes represents the fusion of two clusters. A horizontal cut of corresponds to a partition of the graph into a certain number of communities. The quality of each partition can be quantified using the modularity function Newman2004 , which compares the abundance of edges lying inside each community with respect to a null model. In formula:
| (2) |
where is the number of clusters in the partition , is the total number of edges in the network, is the number of edges between vertices in cluster , and is the sum of the degrees of the nodes in cluster . We assume that the best partition in communities of the graph is the cut of the dendrogram having maximum modularity.
Clustering through non-parametric bootstrapping.– The main limitation of community detection algorithms based on the spectral properties of the transition matrix is that the obtained partition is pretty sensitive to fluctuations in the adjacency matrix of the graph. As a matter of fact, the eigenvalues and eigenvectors of the transition matrix can be substantially modified by adding, deleting or rewiring just a few edges. Therefore, we propose to improve the quality of spectral clustering by using information about the average spectral properties of transition matrices obtained by a non-parametric bootstrapping of the observed matrix .
The authors of Ref. basawa have proposed a generic bootstrap scheme to resample the transition probabilities of a finite state time-invariant Markov chain. Starting from a realization of the Markov chain, one constructs the maximum likelihood estimator of the associated transition matrix as , where is the observed number of transitions from state to state in and . Then, replicates of the observed transition matrix are obtained by drawing, for each state , the random variables according to . The distribution of is then obtained by Monte-Carlo sampling. This approach was shown to be asymptotically valid for approximating the sampling distribution of basawa , and has been also used to assess the confidence intervals of transition probabilities in disease modeling sendi .
Since the unbiased random walk on the graph defined by the transition matrix is a finite-state time-invariant Markov chain, we can construct a similar resampling scheme in which replicates of the transition matrix are obtained by randomly drawing the variables from a multinomial distribution with probabilities , conditional on the observed degree sequence of . It is worth noticing that, in contrast to previous approaches where each link was resampled independently from the others gfeller ; rosvall , here the replicas of the transition probabilities for each node are drawn from a multinomial distribution, accounting for the observed transitions to other nodes .
Given the transition matrix of , we generate bootstrap transition matrices . Then, we project each matrix into (where is a tunable parameter), and we estimate the corresponding bootstrap distance matrices , whose entry is the Euclidean distance between and in according to the mapping induced by . Then, we compute the average distance matrix , which is expected to be the most consistent (similar) with the central tendency of the population of replicates. The matrix effectively quantifies the dissimilarity between any pair of vertices of (the smaller the distance the more similar are and ), in terms of the average distance between their projections in across several replicas of .
We notice that, in principle, the spectral network decomposition based on non-parametric bootstrapping does not rely on modularity, so that any quality function can be used to determine the best partition in the dendrogram. We also would like to stress that the partitions obtained with resampling-based clustering methods do not necessarily provide the absolute optimum of a given quality function. Instead, non-parametric bootstrapping yields partitions that are the most consistent with the central tendency across different replicates drawn from the same population.
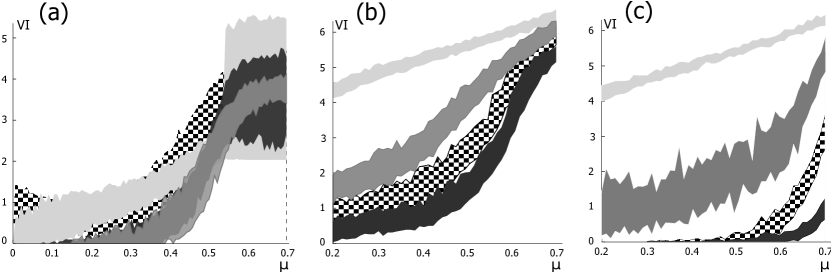
Synthetic networks.– We have tested the performance of our approach on two classes of synthetic graphs with tunable modular structure. In the first benchmark (GN), proposed by Girvan and Newman Girvan2002 , each network consists of nodes divided into modules of equal size. Pairs of nodes in the same module are connected with probability , while nodes belonging to different modules are linked with a probability . Parameters are set such that the average degree is kept constant . By appropriately tuning and one can set the percentage of edges lying between communities. The second class of modular graphs (LFR), proposed by Lancichinetti, Fortunato and Radicchi lancichinetti , accounts for the heterogeneity in the distributions of node degrees and community sizes. In this case, we generated modular graphs with scale-free degree distribution and community size distribution , where and . An appropriate tuning of the model parameters allows to create graphs with a prescribed fraction of inter-community edges. We considered graphs having and (LFR500) and graphs with nodes and (LFR2000).
Since the real partition in communities of these synthetic networks is a-priori known, we can compare the best partition obtained through spectral clustering with the reference one. A widely used measure to compare two different partitions is the variation of information () meila . In a nutshell, this non-negative metric quantifies how much information is lost and gained in changing from a partition to a partition . It can be estimated by , where () is the total number of clusters in the partition (), () is the number of nodes in the () cluster of partition (), and is the number of nodes shared by the cluster of partition and the cluster of partition . Values of range from , when and are identical partitions, to when both and are randomly drawn.
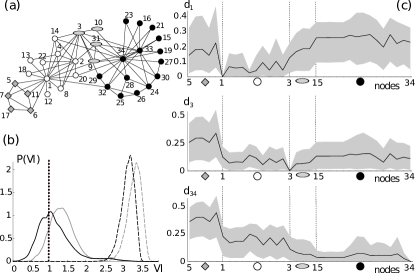
Fig. 1 shows the variation of information between the reference partition and the best one obtained through bootstrap-based spectral clustering, as a function of the fraction of inter-community edges . The reported results suggest that even when the graphs do not have any more a strong community structure, i.e. when for each node the number of neighbours outside its community is similar with the number of neighbours inside its community, the accuracy of the proposed bootstrap-based method remains pretty high. For GN networks, the accuracy of the bootstrap-based method is comparable to that of a standard modularity optimization algorithm newmanEigenvectorsPNAS ; Newman2004 . For LFR500 and LFR2000, the non-parametric bootstrap method outperforms the other algorithms, even when we consider an embedding with , and exhibits a smaller value of up to relatively large values of .
The Zachary’s karate club network.– Fig. 2(a) shows the best partition found by the bootstrap-based algorithm (, ) in the Zachary’s karate club network zachary , a paradigmatic example of graph with a strong modular structure. The partition consists of three main modules (black circles, white circles and grey diamonds, respectively) and a small interface community which contains nodes (grey ellipses). The distribution of the between the partitions obtained through spectral clustering on each single replicate and the one found using (reported in Fig. 2(b), solid black line) shows that the latter one indeed represents the central tendency of the population of replicates. However, the typical between the partition of a single replicate and the one with maximum modularity (Fig. 2(b), grey curve) is higher than that obtained by averaging over all replicates (indicated in Fig. 2(b) by the vertical line). Notice also that the typical between random partitions of the graph and, respectively, the one obtained averaging over all replicates or the one with maximum modularity (respectively the dashed black line and the dashed grey line in Fig. 2(b)) is much larger than that obtained through spectral clustering.
Despite the partition of Fig. 2(a) is not the one with maximum modularity duch2005 , it is worth noticing that most of the nodes put in the interface community (namely, , and ) have been ambiguously classified by many different community detection algorithms li ; estrada , mostly because assigning them to either the black or the white module has negligible effects on modularity gfeller . A more in-depth analysis of the dissimilarity matrix provides a possible explanation for this fact. In Fig. 2(c) we report the average spectral distance between node (top panel), node (middle panel) and node (bottom panel) and all the other nodes in the graph. As expected, both node and node exhibit a sensibly smaller distance towards the other nodes in their repective natural communities, which is consistent with the fact that and are known to be the centers of these two groups. Conversely, the distance between node and the nodes in the white community is comparable to that between and the nodes in the black community. This explains why the central tendency of the population of replicates is to place node in a separate community, together with other three nodes having a similar spectral distance pattern.
Concluding remarks.– In this work we have shown how the generation of replicates of the transition matrix associated to a graph allows to improve the performance of community detection algorithms based on spectral clustering. In general, we believe that non-parametric bootstrapping techniques, which do not require any assumption about the ensemble of graphs to which a given network belongs, might be successfully employed also to assess the significance of the variability of nodes attributes defined by different random walk parameters (e.g. hitting times or return times), and for the statistical validation of other structural properties defined on different flavors of random walks allefeld07 ; sinatra10 .
This work was supported by the EU-LASAGNE Project, Contract No.318132 (STREP). F. De Vico Fallani is financially supported by the French program “Investissements d’avenir” ANR-10-IAIHU-06.
References
- (1) S. Boccaletti, V. Latora, Y. Moreno, M. Chavez, and D.U. Hwang, Phys. Rep. 424, 175 (2006).
- (2) R. Albert and A.-L. Barabasi, Rev. Mod. Phys. 74,, 47 (2002).
- (3) A. Barrat, M. Barthlemy and A. Vespignani, Dynamical processes on complex networks Cambridge University Press, Cambridge (2008).
- (4) M. Newman, Networks: an introduction, Oxford University Press, Oxford (2010).
- (5) M. Girvan and M. E. J. Newman, Proc. Natl. Acad. Sci. USA 99, 7821-7826 (2002).
- (6) M. Chavez, M. Valencia, V. Navarro, V. Latora, and J. Martinerie, Phys. Rev. Lett. 104, 118701 (2010).
- (7) E. Bullmore and O. Sporns, Nat. Rev. Neurosci. 10, 186–198 (2009).
- (8) M. E. J. Newman and M. Girvan, Phys. Rev. E 69, 026113 (2004).
- (9) P.F. Jonsson, T. Cavanna, D. Zicha, P.A. Bates, BMC Bioinf. 7, 2 (2006).
- (10) R. Guimerà and L. A. N. Amaral, Nature 433, 895 (2005).
- (11) S. Fortunato, Phys. Rep. 486, 75 (2010).
- (12) S. Wasserman and K. Faust, Social Network Analysis. Cambridge University Press, Cambridge, (1994).
- (13) S. Maslov and K. Sneppen, Science 296, 910 (2002).
- (14) E. Ziv, R. Koytcheff, M. Middendorf and C. Wiggins, Phys. Rev. E. 71, 016110 (2005)
- (15) G. Bianconi, P. Pin and M. Marsili, Proc. Natl. Acad. Sci. USA 106, 11433 (2009).
- (16) D. Gfeller, J. C. Chappelier and P. De Los Rios, Phys. Rev. E. 72, 056135 (2005)
- (17) B. Karrer, E. Levina and M.E.J. Newman, Phys. Rev. E. 77, 046119 (2008)
- (18) M. Rosvall and C. T. Bergstrom, PLoS ONE 5, e8694 (2010)
- (19) A. Mirshahvalad, O. H. Beauchesne, É. Archambault and M. Rosvall, PLoS ONE 8, e53943 (2013)
- (20) B. Efron and R. J. Tibshirani, An Introduction to the Bootstrap. Chapman and Hall/CRC, New York (1993).
- (21) B. Efron and R. Tibshirani, Statist. Sci. 1, 54 (1986)
- (22) A. Strehl, and J. Ghosh, J. Mach. Learn. Res. 3, 583 (2002)
- (23) Kwak, H., Choi, Y., Eom, Y.-H., Jeong, H., and Moon, S., Proceedings of IMC ’09, 301–314 (2009).
- (24) E.-Y. Kim, D.-U. Hwang, and T.-W. Ko, Phys. Rev. E. 85, 026119 (2012).
- (25) A. Lancichinetti and S. Fortunato Sci. Rep. 2, 336 (2012);
- (26) D. M. Cvetkovic, M. Doob, and H. Sachs, Spectra of Graphs: Theory and Applications. Johann Ambrosius Barth Verlag, Heidelberg, (1995).
- (27) F. R. K. Chung, Spectral Graph Theory. American Mathematical Society, Providence, RI, (1997).
- (28) D. Gfeller, and P. De Los Rios, Phys. Rev. Lett. 99, 038701 (2007).
- (29) R. R. Coifman and S. Lafon, Appl. Comput. Harmon. Anal. 21 5 (2006).
- (30) The quality of this approximation depends on the distribution of . However, empirical evidences suggest that the spectral density of real-world scale-free networks is triangular, with power-law decaying tails (see for instance Ref. Barabasi2002rev for details), so that the spectral distance between any pair of nodes is dominated by the contributions given by eigenvectors associated to the first few largest eigenvelues.
- (31) The distance of two clusters and is computed as the average distance between any pair of nodes such that and . This policy is also known as average linkage. See Sect. 4.2 in Ref.fortunato for details.
- (32) I. V. Basawa, T. A. Green, W. P. McCormick, and R. L. Taylor, Commun. Stat.-Theory Methods 19, 1493 (1990)
- (33) P. P. Sendi, H. C. Bucher, B. A. Craig, D. Pfluger, and M. Battegay, J. Acquir. Immune Defic. Syndr. Hum. Retrovirol. 20, 376 (1999)
- (34) A. Lancichinetti, S. Fortunato and F. Radicchi, Phys. Rev. E. 78, 046110 (2008)
- (35) M. Meilă, J. Multivariate Anal. 98, 873 (2007).
- (36) M. E. J. Newman, Proc. Natl. Acad. Sci. USA 103, 8577 (2006).
- (37) W. W. Zachary, J. Anthropol. Res. 33, 452-473 (1977).
- (38) J. Duch, A. Arenas, Phys. Rev. E 72, 027104 (2005).
- (39) D. Li, I. Leyva, J.A. Almendral, I. Sendiña-Nadal, J.M. Buldú, S. Havlin and S. Boccaletti, Phys. Rev. Lett. 101, 168701 (2008).
- (40) E. Estrada, Chaos 21, 016103 (2011).
- (41) C. Allefeld and S. Bialonski, Phys. Rev. E. 76, 066207 (2007);
- (42) R. Sinatra, D. Condorelli, and V. Latora, Phys. Rev. Lett. 105, 178702 (2010).