Anharmonic phonons in few layer MoS2: Raman spectroscopy of ultra low energy compression and shear modes.
Abstract
Molybdenum disulfide (MoS2) is a promising material for making two-dimensional crystals and flexible electronic and optoelectronic devices at the nanoscaleWang2012 ; Radisavljevic2011 ; Castellanos2012 ; Kim2012 . MoS2 flakes can show high mobilities and have even been integrated in nanocircuits Radisavljevic2012 ; Wang2012b . A fundamental requirement for such use is efficient thermal transport. Electronic transport generates heat which needs to be evacuated, more crucially so in nanostructures. Anharmonic phonon-phonon scattering is the dominant intrinsic limitation to thermal transport in insulators. Here, using appropriate samples, ultra-low energy Raman spectroscopy and first principles calculations, we provide a full experimental and theoretical description of compression and shear modes of few-layer (FL) MoS2. We demonstrate that the compression modes are strongly anharmonic with a marked enhancement of phonon-phonon scattering as the number of layers is reduced, most likely a general feature of nanolayered materials with weak interlayer coupling.
I Introduction
Bulk MoS2 is made of vertically stacked layers (single formula unit consisting of a Mo sheet sandwiched between two S sheets) weakly held together by Van der Waals forces, with layers per unit cell. While MoS2 is an indirect gap semiconductor, it displays a crossover to a direct gap semiconductor with a resulting marked increase of photoluminescence upon reduction of crystal thickness down to one layerMak2010 .
In the case of a layered hexagonal system, the shearing modes are twofold degenerate as there are two equivalent in-plane shear-directions. Generally an N-layer flake has shearing modes and compression-extension (noted compression henceforth) modes. Thus, while single layer MoS2 should have neither one nor the other mode, in FL MoS2 additional modes should appear with respect to bulk or the bilayer which both have 2 degenerate shear modes and one compression mode.
Both modes, importantly, are expected at very low energies since the interlayer interaction in MoS2 is weak ( cm-1 or K). Therein lies their relevance to transport, both thermal and electronic. At room temperature these phonon modes are all thermally populated and influence thermal transport via phonon scattering with defects and impurities or via phonon-phonon scattering. As anharmonicity is an intrinsic mechanism, in clean samples it is the dominant limitation to the thermal conductivity. Determining the behaviour of these modes as a function of the flake thickness is of the greatest importance for nanoelectronic devices based on MoS2.
Recently low energy Raman modes in Graphene Marzari2012 and MoS2Plechinger2012 ; Zeng2012 ; Zhang2013 were measured for FL flakes on p-doped Si substrates. In Ref. Plechinger2012, only a single shear mode was detected and no compression modes were seen. Low energy modes are weak in intensity and, to eliminate a broad low-energy background due to inelastic scattering of free carriers in the p-doped substrateChandrasekhar1980 , these spectra were recorded in crossed geometry (i.e. the polarization of the outcoming light is perpendicular to that of the incident beam) where all compression modes are forbidden. In Ref. Zeng2012, , beside the shearing mode detected in Ref. Plechinger2012, , a second feature was detected. No polarization analysis of the Raman spectra was performed and one of the features was attributed to a compression mode from a fit to a behaviour ( number of layers). In Ref. Zhang2013, a detailed study of shearing and compression modes up to 19 layers has been carried out. The authors were able to classify the low energy Raman peaks in two groups, namely those that stiffen with increasing and those that soften with increasing . Then using a chain model they were able to build fan diagrams and obtain MoS2 shearing and compression strength. No first principles calculations of the Raman spectra were carried out.
In this work we measure low-energy Raman spectra as a function of the number of layers in multilayer MoS2. We overcome the difficulty related to the presence of a broad low-energy background due to inelastic scattering of free carriers in the p-doped substrateChandrasekhar1980 by using FL MoS2 on borosilicate glass substrates. We measure shear and compression modes from 1 to 5 layers. By performing first principles calculations of the positionQE and intensityLazzeri of Raman peaks we obtain a complete understanding of shear and compression modes in FL MoS2 . We also analyze theoretically the dependence of the main shearing mode as a function of applied pressure and show that it behaves linearly at low pressure (below 1GPa).
II Experimental
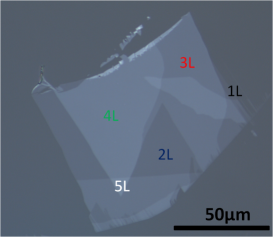
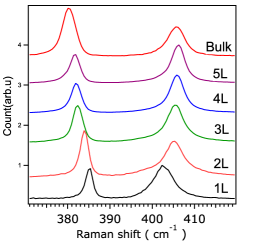
The samples are made using the anodic bonding method which bonds a bulk flake to a borosilicate glass substrate shukla2009 ; gacem2012 at a temeprtaure between 130 C and 200 C and a high voltage which may range from 200V to 1500V. The flake is then mechanically cleaved leaving large few layer samples on the glass (see Fig. 1). The sample used in this work is exceptional in that it provides all different thicknesses used on the same flake, making comparison easy. The sample thickness was identified first by optical contrast and then confirmed by atomic force microscope and Raman spectroscopy Lee2010 , as shown in Fig. 2.
MicroRaman spectra of the FL MoS2 are measured ( nm radiation, mW laser power) in backscattering configuration with parallel and crossed polarization geometry. To enable measurements down to cm-1 on a single-grating spectrometer (LabRAM HR from HORIBA Jobin Yvon), an ultra-low wavenumber filtering (ULFTM) accessory for nm wavelength was used. These volume Bragg gratings can be fabricated with diffraction efficiencies as high as 99.99% and the linewidth narrower than 1 cm-1 at FWHM that corresponds to 3-4 cm-1 cut-off frequency at -60 dB from maximum. They also make a unique notch filter for Rayleigh light rejection by sequential cascading of several Bragg notch filters, enabling ultra-low frequency Raman measurements with single stage spectrometers Glebov ; Glebov2 To avoid laser heating, a laser power of 1 mW was focused through a 50X or 100X microscope objectives.
In order to evaluate the actual temperature on the sample and to exclude laser-heating, we measure for all thicknesses both Stokes and antiStokes features at high and low energy. We then determine the temperature as
| (1) |
where is the Raman shift and the pulsation of the laser light. For a more precise determination of the temperature we use the intensity of the high energy A1g and E2g modes. We obtain K. Thus the laser heating is K, i. e. negligible.
III Theory
Calculations were performed by using density functional theory in the local density approximationpz . The QUANTUM-ESPRESSOQE package was used with norm-conserving pseudopotentials and a plane-wave cutoff energy of Ry. Semicore states were included in Mo pseudopotential. All calculations were performed at 0 and 6 Kbar uniaxial pressure, corresponding to the uniaxial pressure imposed in the anodic bonding procedure. The crystal structure at a given pressure is obtained by keeping the same in-plane experimental lattice parameter as in bulk samples. The interlayer distance is obtained by imposing a 6 Kbar pressure with respect to the bulk experimental structure at 0 Kbar. The distance between the plane is then kept constant for all N-layers flakes, but Sulfur height, the only free parameter, is optimized following internal forces. Phonon frequencies, born-effective charges and Raman tensor were calculated using a k-point grid for the monolayer and a for the bulk. Using this grid, phonon frequencies of shearing and compressing modes are converged with an accuracy of cm-1. Raman intensities were calculated with the method of Ref. Lazzeri, in the Placzek approximation.
The intensity of a mode is written as
where and are the phonon frequency and the occupation of the phonon mode . Moreover, where is the Raman tensor while and are the the polarization of the incident and scattered radiation respectively. In table 1 we give the calculated value of as a function of the layer number and the experimental geometries for the low energy modes.
| N=2 | ||
| cm | ||
| 23.1 | 0.282 | 1.0 |
| 37.6 | 1.0 | 0.001 |
| N=3 | ||
| cm | ||
| 16.31 | 0.001 | 0.001 |
| 26.43 | 1.0 | 0.001 |
| 28.42 | 0.73 | 1.0 |
| 45.95 | 0.001 | 0.001 |
| N=4 | ||
| cm | ||
| 12.56 | .005 | 0.001 |
| 20.53 | 0.69 | 0.001 |
| 23.34 | 0.001 | |
| 30.57 | 1.0 | 1.0 |
| 47.45 | 0.001 | 0.001 |
| 48.90 | 0.001 | 0.13 |
| N=5 | ||
| cm | ||
| 10.04 | 0.001 | 0.001 0 |
| 16.61 | 0.42 | 0.001 |
| 19.18 | 0.02 | 0.002 |
| 26.50 | 0.001 | 0.001 |
| 31.21 | 1.0 | 1.0 |
| 31.25 | 0.001 | 0.001 |
| 42.62 | 0.17 | |
| 50.45 |
The experimental spectrum is then obtained as
| (2) |
In order to compare with experiments, the Dirac functions are convoluted with the experimental linewidths.
At ambient pressure, the calculated frequencies are in excellent agreement with previous calculations Wirtz , however they disagree with the calculations of Ref. Zeng2012, . In particular, for a MoS2 bilayer at zero uniaxial pressure and using the experimental in-plane lattice parameter we find cm-1 for the main shearing mode. Performing structural optimization of both in-plane and interlayer distance (keeping always the same empty region between periodic images) we find cm-1 for the shear mode. Thus the shear phonon frequency weakly depends on the choice of the experimental or theoretical in-plane lattice parameters in the calculation. This has to be compared with cm-1 in our experimental Raman data, with cm-1 in experimental Raman data of Ref. Zeng2012, and with cm-1 in Raman data of Ref. Plechinger2012, . In Ref. Zeng2012, the shearing mode was calculated at cm-1 using the theoretical lattice structure and the LDA approximation which would correspond to a very large applied pressure, not relevant to the experiments in consideration.
IV General discussion on secondary shear and compression modes
As already stressed in the introduction, a MoS2 N-layer flake has twofold degenerate shearing modes and compression modes. Shear modes correspond to rigid layer displacements perpendicular to the c-axis. The twofold degeneracy depends on the crystal symmetry of the lattice. In MoS2 for example it is equivalent to rigidly shift a subset of layers with respect to one in-plane crystalline axis or the other. For an N layer flake (with N) the rigid layer displacement patterns are schematically illustrated in Fig. 3 (right). The hardest shear mode always corresponds to the rigid shift of the innermost layers, these being more tightly bound by the bilateral interaction with the other layers. The hardest (also named principal or primary) shear mode is labeled Sn, where is the number of layers. The shear mode is Raman active and is also the most intense of all the shear modes. As the number of layer increases, there are more possibilities of rigidly shifting layers. For example in a three layer flake, it is possible to shift only the top (or bottom) layer keeping the other two fixed. This mode is however softer then the main shear mode, as the outer layers have only one nearest neighbour layer with weaker binding. In our case and at 6 Kbar uniaxial pressure, the secondary shear mode is calculated to be at 16.3 cm, but with essentially zero Raman intensity (although this mode is not forbidden by symmetry). In the general case of an N-layer flake, there are independent ways of shifting a subset of layers with respect to the others and their energies lie between that of the (softest) secondary shear mode related to the shift of extremal layer and the (hardest) main shear mode.
Compression (or extension) modes are rigid vibrations of the layers in the direction perpendicular to the layers. For an N layer flake (with N) the rigid layer displacement pattern are schematically illustrated in Fig. 3 (left). As in the case of shear modes it is possible to identify a primary or main compression mode. The main compression mode is the one corresponding to (i) the lower half of the layers shifting in the same direction and (ii) the higher half of the layers in the opposite direction. The main compression mode (labeled Cn) is the softest compression mode. Secondary compression modes arise when the top half (respectively bottom half) layers are not all displaced in the same direction. Secondary compression modes are higher in energy then the main compression mode (see Fig. 4, the rigid layer model of Michel2012, and the discussion below).
V Results
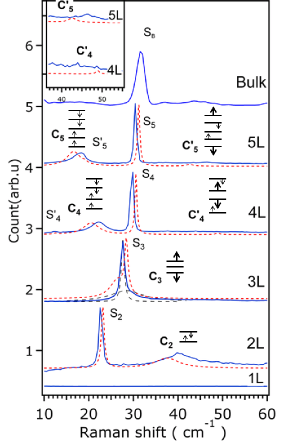
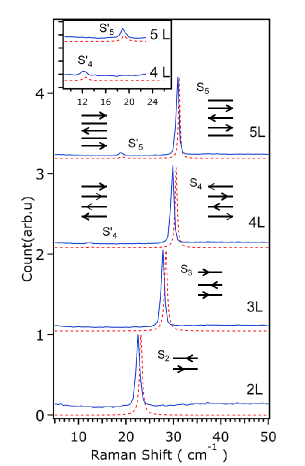
In Fig. 3 we show measured and calculated spectra in parallel and crossed geometries. The peaks are normalized to the main shear mode intensity and the theoretical spectra are convoluted by the experimental linewidth.
By comparing the main shear-mode (labeled Sn) to existing measurements Plechinger2012 , we notice that in our samples this mode is systematically harder by cm-1. We attribute this to the anodic bonding method which binds flakes to a glass substrate electrostatically due to the creation of a space charge in the substrate. This also generates an electrostatic pressure on the flake bound to the substrate. Knowing the depth of this space charge layer (1-2 microns) this uniaxial pressure along the c-axis Anthony1983 can be estimated to be in the range of 3-6 Kbar.
We thus performed first principles calculations as a function of pressure and obtain an essentially linear behaviour of the main shearing mode for a MoS2 bilayer as a function of uniaxial pressure, with a linear coefficient that is cm-1/Kbar (the second order coefficient in the fit is 0.04 cm-1/Kbar2). Comparing the measured spectra with the calculated ones for Kbar uniaxial pressure, we find remarkable agreement.
Besides the main shear mode, already detected in Refs. Plechinger2012, ; Zeng2012, we measure secondary shear (Sn and S) and compression (labeled Cn and C) modes (see Figs. 4 and 3 ). In Ref. Zeng2012, only the compression mode was detected.
The compression mode is clearly visible in 2, 4 and 5 layer samples and less so in the 3 layer sample because it coincides in energy with the shear mode. In the 4 and 5 layer samples, theory also accounts for the additional shear (S) and compression (C) modes detected in experiments.
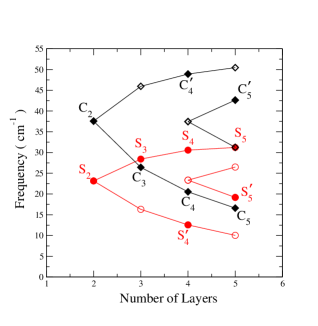
It is worthwhile to recall that the energy of shear and compression modes can either increase or decrease as a function of the number of layers , as shown in the fan diagrams in Ref. Michel2012, and in Fig. 4. In FL MoS2, the energy of Raman visible Eg shear modes increases with the number of layer, while that of Raman visible compression modes decreases.
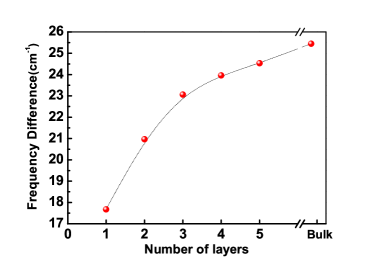
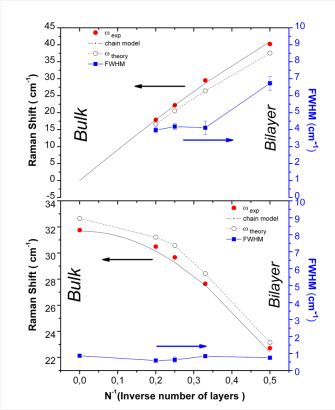
The qualitative behaviour of the position of the main shear and compression modes as a function of layer number can be easily understood in a simple rigid-layer (or chain) modelAshcroft . We write for the shear-mode frequency
| (3) |
where is the rigid layer mass per unit and is the shearing strength. The Cn compression mode behaves as
| (4) |
and is the compression strength. From the experimental curves we obtain , twice the value in graphene Marzari2012 ; Michel2012 , and . Both these effects are in part explained by the smaller interlayer distance in MoS2 (the Sulfur-Sulfur distance along c is ) with respect to graphite (). The agreement between Eqs. 3, 4 and experimental data is shown in Fig. 5, validating the chain model and the extracted values of and .
In Fig. 5 we also plot the variation of the linewidth for the Sn shear and the Cn compression modes as a function of the number of layers . Shear mode linewidth is resolution limited while all the compression modes are very broad (roughly 7 times broader), the linewidth of the C2 mode being the largest. As the broadening is inversely proportional to the phonon-phonon scattering time, our result indicates that the phonon scattering time of compression modes is approximately times smaller than that of shear modes. Thus the contribution of optical modes to the intrinsic thermal conductivity of MoS2 flakes is dominated by scattering to compression modes. In a MoS2 bilayer, the scattering time of compression modes is nearly 9 times smaller then that of shear modes.
The compression modes linewidths are generally larger then those of shearing modes as the potential is more anharmonic for a displacement perpendicular to the MoS2 layers then for a shearing displacement. In the case of C2, the linewidth is enhanced with respect to Cn with due to the fact that more channels for anharmonic decay are available. Indeed for , the compression mode is lower in energy (or at the same energy for ) then the shearing mode. As such it can only decay into two acoustic modes of opposite momentum. In the case , the compression mode is at roughly twice the energy of the shearing mode S2. Thus the compression mode can decay into (i) two acoustic modes of opposite momentum, (ii) an acoustic and a shearing mode of opposite momentum, or (iii) two shearing modes of opposite momentum.
VI Conclusion
In conclusion we have measured primary and secondary shearing and compression modes in MoS2 from 1 to 5 layers. The compression modes are found to be strongly anharmonic, with phonon-phonon scattering increasing upon reducing the number of layers. Thus compression modes represent the overriding optical phonon contribution to the intrinsic thermal conductivity of MoS2 flakes, a crucial aspect of any use of these in future nano or microelectronic devices. The relevance of our work is far reaching as compression modes are most likely strongly anharmonic in all flakes obtained from weakly-interacting layered-materials such as few layer graphene, transition metal dichalcogenides and topological insulators. In all these systems a crucial limit to thermal transport could be the anharmonicity of compression phonon modes.
VII Acknowledgements
We acknowledge K. Gacem for help in sample preparation. This work was supported by French state funds managed by the ANR within the Investissements d’Avenir programme under reference ANR-11-IDEX-0004-02 and ANR-11-BS04-0019. Calculations were performed at the IDRIS supercomputing center.
References
- (1) Wang Q. H., Kurosh K. Z., Kis A., Coleman J. N., and M. Strano, Nature Nanotechnology 7, 699 (2012)
- (2) Radisavljevic B., Radenovic A., Brivio J., Giacometti V., and A. Kis, Nature Nanotechnology 6, 147 (2011)
- (3) Castellanos-Gomez A., Barkelid M., Goossens A. M., Calado V. E., van der Zant H. S. J., and Steele G. A., NanoLetters 12, 3187 (2012)
- (4) Kim, S, Konar, A , Hwang, WS , Lee, JH , Lee, J , Yang, J , Jung, C , Kim, H , Yoo, JB , Choi, JY , Jin, YW , Lee, SY , Jena, D , Choi, W , Kim, K, Nature Communications, 3, 111 (2012)
- (5) Radisavljevic B, Whitwick, MB, and Kis, A, ACS NANO 5, 9934 (2012)
- (6) Wang, Han and Yu, Lili and Lee, Yi-Hsien and Shi, Yumeng and Hsu, Allen and Chin, Matthew L. and Li, Lain-Jong and Dubey, Madan and Kong, Jing and Palacios, Tomas, Nano Letters 12, 4674 (2012)
- (7) Mak K. F., Lee C., Hone J., Shan J., and Heinz T. F., Phys. Rev. Lett. 105, 136805 (2010)
- (8) Tan P. H., Han W. P., Zhao W. J., Wu Z. H., Chang K., Wang H., Wang Y. F., Bonini N., Marzari N., Pugno N., Savini G., Lombardo A. and Ferrari A. C., Nature Materials, 11, 294 (2012)
- (9) Plechinger G , Heydrich S , Eroms J, Weiss D, Schuller C, Korn T, Applied Phys. LETT. 101, 101906 (2012)
- (10) X. Zhang, W. P. Han, J. B. Wu, S. Milana, Y. Lu, Q. Q. Li, A. C. Ferrari, P. H. Tan, Phys. Rev. B 87, 115413 (2013)
- (11) H. Zeng, B. Zhu, K. Liu, J. Fan, X. Cui, and Q. M. Zhang, Phys. Rev. B 86, 241301(R) (2012)
- (12) M. Chandrasekhar, U. Rössler, and M. Cardona, Phys. Rev. B 22, 761 (1980).
- (13) Shukla, A, Kumar, R, Mazher, J , Balan, A, Solid State Comm. 149, 718 (2009)
- (14) Gacem, Karim, Boukhicha, Mohamed, Chen, Zhesheng, Shukla, Abhay Nanotechnology 23, 505709 (2012)
- (15) Lee C., Yan H., Brus L. E. , Heinz T. F. , Hone J., and Ryu S., ACSnano 5, 2695 (2010)
- (16) L. B. Glebov, in Encyclopedia of SmartMaterials 2, (Ed.: M. Schwartz), John Willey and Sons: 2002, pp. 770.
- (17) Glebov et al. Proc. SPIE, 8428, 84280C, (2012)
- (18) Appendix C of J. P. Perdew and A. Zunger, Phys. Rev. B 23, 5048-5079 (1981).
- (19) Molina-Sanchez A. and Wirtz L., Phys. Rev. B 84, 155413
- (20) P. Giannozzi et al., J. Phys. Condens. Matter 21, 395502 (2009).
- (21) Lazzeri M, Mauri F, Phys. Rev. Lett. 90, 036401 (2003)
- (22) Anthony,Thomas, J. Appl. Phys. LETT. 54, 2419 (1983)
- (23) Michel, K. H. and Verberck, B., Pys. Rev. B 85, 094303 (2012)
- (24) N. W. Ashcroft and N. D. Mermin, Harcourt Inc. 1976, page 433.