RX J1301.9+2747: A Highly Variable Seyfert Galaxy with Extremely Soft X-ray Emission
Abstract
In this paper we present a temporal and spectral analysis of X-ray data from the XMM-Newton and Chandra observations of the ultrasoft and variable Seyfert galaxy RX J1301.9+2747. In both observations the source clearly displays two distinct states in the X-ray band, a long quiescent state and a short flare (or eruptive) state which differs in count rates by a factor of 5–7. The transition from quiescent to flare state occurs in 1–2 ks. We have observed that the quiescent state spectrum is unprecedentedly steep with a photon index , and the spectrum of the flare state is flatter with . X-rays above 2 keV were not significantly detected in either state. In the quiescent state, the spectrum appears to be dominated by a black body component of temperature about 30–40 eV, which is comparable to the expected maximum effective temperature from the inner accretion disk. The quiescent state however, requires an additional steep power-law, presumably arising from the Comptonization by transient heated electrons. Optical spectrum from the Sloan Digital Sky Survey shows Seyfert-like narrow lines for RX J1301.9+2747, while the HST imaging reveals a central point source for the object. In order to precisely determine the hard X-ray component, future longer X-ray observations are required. This will help constrain the accretion disk model for RX J1301.9+2747, and shed new light into the characteristics of the corona and accretion flows around black holes.
Subject headings:
accretion, accretion disks — galaxies: active — galaxies: individual (RX J1301.9+2747) — X-rays: galaxies1. Introduction
Active galactic nuclei (AGNs) are thought to be powered by supermassive black holes of accreting the surrounding gas (see Rees, 1984, for a review). They are also considered to be scaled-up versions of Galactic black hole binaries (BHBs, , McHardy et al. (2006) and references therein). The rapid X-ray variability is one example of the similarities between these two types of systems (Gierlinski et al., 2008). In Seyfert galaxies, variations of the X-ray continuum emission over a timescale from minutes to hours have been reported (e.g. Ulrich et al., 1997; Boller et al., 1997; Ponti et al., 2012), however, persistent giant and rapid variability appears to be fairly rare and its origin is still poorly understood.
Soft X-ray excesses above an extrapolation of the underlying hard X-ray power-law is commonly observed in Type 1 AGNs and radio quiet quasars (Piconcelli et al., 2005; Bianchi et al., 2009). The origin of this additional component is not clear, and may be the high-energy tail of the AGN accretion disk emission (e.g. Grupe et al., 1995). The problem using this explanation is that the temperatures of the soft X-ray excesses appear to fall within a narrow range (kT 0.1–0.2 keV) from a sample of AGNs containing a large range of black hole (BH) mass, which is difficult to explain using the standard accretion disk models (e.g. Gierlinski & Done, 2004; Crummy et al., 2006).
So far there has been no convincing evidence for the presence of direct accretion disk emission seen in the X-ray spectra of AGNs. Yuan et al. (2010) reported a luminous ultra-soft excess in the narrow line Seyfert 1 galaxy (NLS1) J1633+4718 from archival ROSAT spectra, and found a lowest soft excess temperature of 32 eV among AGNs. This characteristic of the soft excess is likely an observational signature for the accretion disk emission. However, the blackbody nature of this emission needs to be tested further, utilizing higher quality X-ray data, as the ROSAT spectra ( 0.1–2.4 keV) are less sensitive to constrain the harder power-law emission above 2 keV. Recently, Terashima et al. (2012) reported the discovery of a candidate ’ultrasoft’ AGN, whose X-ray spectrum can be represented by a soft thermal component with a blackbody temperature of 0.13–0.15 keV, by analog with the accretion disk dominated spectrum typically seen in the high/soft state of BHBs. Additionally, the soft X-ray emission obtained shows spectral variability consistent with being caused by strong Comptonization. Interestingly, the object was later optically confirmed to be a Type 2 AGN (Ho et al., 2012) with a central BH mass as small as . However, in their work they did not test in detail the possibility of the accretion disk emission as the origin for the soft excess.
In this paper, we report results of new XMM-Newton and Chandra observations of RX 1301.9+2747 at =0.0237 (hereafter J1302), a highly variable and ultra-soft X-ray source in a post-starburst galaxy (Dewangan et al., 2000). Our detailed analysis of the optical spectrum from the SDSS revealed that it is a Seyfert galaxy. The ultrasoft X-ray emission of J1302 was confirmed in the new X-ray observations. In particular, we found unusual giant flares in both XMM-Newton and Chandra light curves, accompanied by spectra hardening during the flare state. In the quiescent state, the spectrum appears to be dominated by a thermal blackbody component, whose temperature is comparable to the predicted maximum accretion disk temperature. Throughout this paper, we assume a cosmology with = 0.71, = 0.27, = 0.73.
2. Data analysis and result
2.1. Optical Spectrum
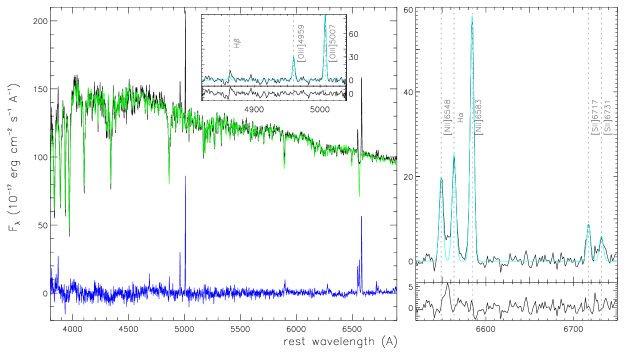
J1302 was spectroscopically observed by the SDSS in March 2007. Figure 1 shows the rest-frame spectrum for J1302 (black line), which is dominated by the starlight of the host galaxy. To subtract the starlight and the nuclear continuum, we followed the recipe described in detail in Dong et al. (2005). As seen in Figure 1, the galaxy starlight model (green line) gives a very good fit to the optical continuum (/dof = 3648/3208). After the subtraction of stellar absorption lines, we fitted the emission-line spectrum, represented by a blue line, by using Gaussians to derive the parameters of the emission lines. [OIII] 4959, 5007, [NII] 6548, 6583, H and [SII] 6717, 6731 emission lines are clearly detected with S/N 5, while H line is only weakly distinguishable with S/N 1.4. The right panel in Fig. 1 displays the emission-line spectra, alongside the best fit Gaussian models. There is no apparent broad component of H line, and a narrow Gaussian with a line width of FWHM 240km s-1 can provide good fit. In order to verify the absence of the broad H line, we add an additional Gaussian to the narrow H, with the width fixed at 2000 km s-1. The flux is allowed to vary in the fitting process. We found that the fitting was marginally improved by adding this component, and the S/N for the H broad component is only 0.5. This suggests that the broad H line, if there is any, is extremely weak in J1302. The ratios of the narrow lines [OIII] 5007/H 4.8 (using 3 upper limit of H line flux), and [NII] 6583/H = 2.3, place J1302 into the Seyfert regime on the BPT diagram of Kewley et al. (2006). The flux ratios of [SII]/H and [OI]/H are 0.56 and 0.32, respectively, further strengthening the Seyfert nature of J1302 according to line ratio diagnostic diagrams of Kewley et al. (2006).
2.2. X-ray Observations
J1302 was observed by XMM-Newton EPIC cameras in December 2000 with a total exposure time of 29 ks. It was detected 7.3 arcmin away from the center of the field of view in the XMM-Newton imaging of the Coma cluster (ObsID 0124710801). The XMM-Newton data were reprocessed with the Science Analysis Software version 11.0.0, using the calibration files as of December 2011. We used principally the PN data, which have much higher sensitivity, using the MOS data only to check for consistency. Spectra and light curves of source were extracted from a circular region with a radius of 40 centered at the source position for both PN and MOS cameras. Background spectra were made from source-free areas on the same chip using four circular regions identical to the source region. The epochs of high background events were examined and excluded by using the light curves in the energy band above 12 keV.
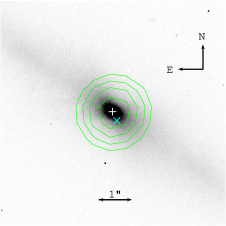
The Chandra pointing observation of J1302 was taken in June 2009 for about 5 ks. The data were processed with CIAO (version 4.3) and CALDB (version 4.4.1), following the standard criteria. Fig. 2 shows the Chandra X-ray contours of J1302, overlaid on the HST image in the B band. It is clear from the figure that the X-ray emission of J1302 is point-like. The center for the X-ray source is coincident with the optical nucleus of the galaxy (with a positional offset of 0.1). Given the subarcsecond spatial resolution of Chandra, we conclude that most of the X-ray emission, if not all, comes from the nuclear region of the galaxy, likely related to the AGN.
2.3. X-ray light curve
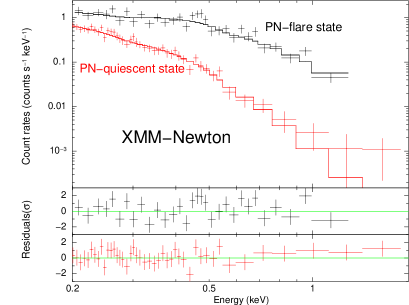
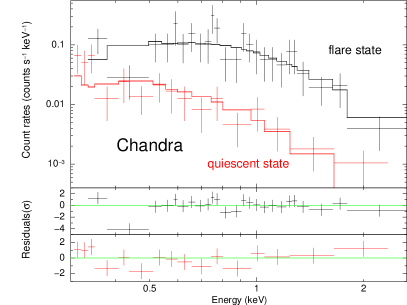
Light curves from the XMM-Newton and Chandra observations are shown in Fig. 3. The source exhibits large-amplitude count rate variations in both observations. It can be seen from the PN light curve that there is a giant flare with count rates rising by a factor of 5 times the average value, having a duration of 2 ks. The X-ray flux then declines to a relatively steady state. Such X-ray flare is confirmed by the MOS light curves, in which a possible decline of another flare is also recorded at the beginning of the MOS observation. The time interval of the two flares is about 17 ks. Interestingly, similar flare is seen in the Chandra light curve, with count rates increasing by a factor of 7 within 1 ks. The similar amplitudes of flares in the XMM-Newton and Chandra observations which span 9 years suggest that the flare behaviour in J1302 seems persistent on time scale of decade. The spectral variability during the flare will be explored in detail in Section 2.4.
2.4. X-ray Spectra
As both XMM-Newton and Chandra observations show peculiar flare behaviours, we attempt to quantify the spectral variability during flares by dividing the data into high and low flux intervals, using count rate thresholds of 0.35 counts s-1 for XMM-PN and 0.08 counts s-1 for Chandra, respectively. For simplicity, we classify the data above the count rate thresholds as belonging to the flare state, and that which falls below, to the quiescent state. The spectra data were grouped in the following manner: data from the XMM-Newton had at least 20 counts per bin to ensure the statistics, and the Chandra data had at least 3 counts per bin and utilized the -statistics which was adopted for minimization. Spectral fitting was performed using the XSPEC (Version 12.6) and limited to the 0.2–2 keV range for XMM-Newton, since the emission is background dominated above that energy range. The Chandra data was fitted in the energy range between 0.3 and 3 keV. Throughout the model fittings, the Galactic column density was considered and fixed at cm-2 (Kalberla et al., 2005).
Spectral variability is clearly present between the two states with the source being much harder in the flare state. To illustrate the differences in the spectral slope between the two states, we show the spectra together with an absorbed power-law model in Figure 4. While the fit is generally acceptable for the two states, as confirmed by the reduced value (see Table 1), the photon indices obtained from a power-law fit are, however, extremely steep with = for cm-2, and = for cm-2, for the XMM flare and quiescent state, respectively. The photon indices belong to the steepest values obtained from AGN X-ray spectra. For comparison, the mean photon index in the 0.2–2.0 keV band is for a sample of soft X-ray selected AGNs observed with the ROSAT RASS (Grupe et al., 2010). The result of this comparison indicates that the X-ray spectrum of J1302 is extremely soft compared to other AGNs. The absorption-corrected luminosity in the 0.5–2.0 keV range for this simple power-law model is and for the XMM flare and quiescent state, respectively.
In order to further investigate the spectral variability in J1302, we then attempted to fit the spectra with a blackbody (bbody in XSPEC) or Multiple Color Disk model (MCD, diskbb in XSPEC), and a thermally Comptonized disk model (compTT in XSPEC, Titarchuk, 1994), both of these alternative models have been used to fit the spectra of Galactic BHBs (e.g., Done et al., 2007), and the soft X-ray excess emission in AGNs (e.g., Porquet et al., 2004; Patrick et al., 2012) . The diskbb model integrates over the surface of accretion disk to form a multicolor blackbody spectrum, and compTT is an analytic model that self-consistently calculates the spectrum produced by the Comptonization of soft seed photons in a hot corona above the accretion disk. The physical parameters of the compTT model are: the soft photon temperature (), the temperature of the Comptonizing electrons (), the plasma scattering optical depth (). For our fitting with the compTT model, a disk geometry was assumed for the comptonizing region, and the seed photons were assumed to follow Wien’s law with a temperature of 22 eV (the expected disk temperature in section 3.2). Because the temperature and optical depth of the Comptonizing plasma are strongly coupled (both are equally involved in shaping the spectrum) and thus cannot be constrained simultaneously, we fixed the plasma temperature at 20 keV and obtained constraints on the optical depth111 Leaving the plasma temperature as a free parameter yields keV and for the XMM quiescent state spectrum, but both parameters cannot be constrained by the data during the flare.. The single Comptonized model yields consistent fitting results with the previous simple power-law model for the spectrum at both states. The Compton optical depth is and for the flare and quiescent state, respectively. For the spectrum in the XMM-Newton flare state, a multicolor-disk blackbody gives equivalent fit, which is statistically better than the simple blackbody emission.
The spectrum at the XMM-Newton quiescent state, however, shows an excess of emission at energies above 0.7 keV when fitted with a thermal model (bbody or diskbb). The addition of a power-law to the model improves the fit with very high statistical significance ( decreased by 13.9 for two extra parameters, at a 99.98% level according to -test). The power-law component contributes 15% of the total luminosity in the 0.3–2 keV band. In this case, we obtain an effective blackbody temperature of eV, comparable to the seed photon temperature assumed in the compTT model. Although with large uncertainties, the additional power-law component is relatively steep with photon index , and it is close to what is observed in the flare state. The spectral fitting results for the PN data, alongside the observed flux and intrinsic luminosity in the 0.5–2 keV range for each model, are shown in Table 1. Note that we used the same models to fit the MOS data and found that the results agree well with the PN data.
The Chandra spectra were fitted with the same models used in the XMM-Newton observation and the results are listed in Table 1. During the first run we found that the photon indices derived from the simplest power-law model are systematically flatter than the values for the XMM-Newton data. The spectrum during the flare can be well fitted by a power-law model (/dof=22.5/22). On the other hand, a power-law model is not sufficient to fit the data at the Chandra quiescent state. The addition of a soft thermal component with respect to the power-law model improves the fit significantly ( value decreases by 9 for two extra parameters, corresponding to a significance level of 98.7%). The resulting best-fit photon index is flatter, with . Similarly, we obtain an effective disk temperature, when fitted with a blackbody, of eV. This value is slightly lower than the blackbody temperature for the XMM-Newton quiescent state, but the parameter is loosely constrained due to the poor statistics of the Chandra data. The power-law component in this case contributes of the total luminosity in the 0.3–2 keV, indicating a possible change of the power-law or the blackbody emission between Chandra and XMM-Newton observations.
Although a Comptonized model as opposed to a power-law model also provides a good fit for the Chandra flare state spectrum, it is not sufficient to fit the data at the quiescent state. The addition of an extra hard power-law component is needed at a significance level of 98.7% according to -test. The best-fitted optical depth for the compTT model is not significantly different from that obtained with the XMM-Newton data. The unabsorbed luminosity in the 0.5–2 keV band, based on the best-fit power-law model and the diskbb+power-law model for the Chandra flare and quiescent state, is and erg s-1, respectively.
3. Discussion
3.1. AGN characteristics in RX J1301.9+2747
X-ray observation with Chandra , which has superb spatial resolution of , revealed the presence of an AGN in J1302: the center of the bright unresolved X-ray emission coinciding with the optical point-like nucleus of the galaxy (with a position offset of ). Both the Chandra and XMM-Newton observations show that it has Seyfert-like X-ray luminosity of erg s-1 in the energy range of 0.5–2 keV ( erg s-1 in the 0.2–2 keV band ), and rapid X-ray variability down to a time-scale 1 ks. Additionally, the optical spectrum of J1302 displays Seyfert-like narrow emission line ratios. All these observational facts point to the presence of an AGN (Seyfert nucleus) in this galaxy. This can be further supported by the point-like appearance of a nuclear source from the HST imaging observations with resolution (Caldwell et al., 1999).
Based on ROSAT X-ray observations, Dewangan et al. (2000) argued for the presence of an AGN in J1302, a view that is consistent with ours on the basis of the new observations. However, based on their observed optical spectrum, Dewangan et al. conclude that the galaxy nucleus is more like a LINER. In this paper, we have carefully modeled the host galaxy’s starlight, especially the stellar absorption features, and subtracted them from the new SDSS spectrum, enabling us to accurately measure the weak AGN emission lines in J1302 (e.g., Dong et al., 2005), thus more resolutely confirming the Seyfert nature based on the line ratio diagnostics.
The lack of detectable broad permitted lines prevents us from estimating the central BH mass of J1302 using conventional linewidth-luminosity-mass scaling relation. In the SDSS spectral fitting, we found the strongest narrow line, [OIII]5007, is marginally resolved with Gaussian km s-1 (after correcting for the instrument resolution).Using the width of the [OIII]5007 line as a proxy for the stellar velocity dispersion of the host galaxy, we obtained a BH mass of with an intrinsic scatter of 0.5 dex (e.g., Xiao et al., 2011).
The bolometric luminosity for J1302 can be estimated from the optical continuum luminosity. We retrieved the high resolution HST/WFPC2 images of J1302 in the (F450W filter) and (F814W filter) passbands from the HST archive. The HST observations (dataset U39D0301M–U39D0304M) were made in July 1997, with two 600 s exposures in the band and two 400 s exposures in the band, respectively. The images were processed using the standard HST pipeline routines in IRAF/STSDAS222http://www.stsci.edu/institute/software_hardware/stsdas. We then performed two-dimensional profile decompositions of this galaxy with the code GALFIT (version 3.0, Peng et al. 2010). Our model consists of an exponential disk component, a bulge component, and an unresolved central point source for the nuclear AGN emission. In our GALFIT modeling, the point-spread function was generated by the software (Krist et al., 1995). Note that the bulge for this galaxy displays a box/peanut shape, which is commonly seen in edge-on barred disk galaxy, consequently we added a boxiness parameter to the bulge profile in GALFIT. The model generally matches the data well (). The inferred flux for the central point source in the -band is = -15.8, corresponding to a nuclear luminosity of = erg s-1. For comparison, the B-band bulge luminosity of this galaxy derived from the GALFIT decomposition is LB,bulge erg s-1. If indeed the nuclear emission comes from AGN333Note that we have not accounted for the dust extinction in estimating the luminosity., we estimate the bolometric luminosity to be using the -band luminosity for the central point source by adopting a bolometric correction of 13 (Marconi et al., 2004). For a BH mass of , the accretion rate in Eddington unit is 0.1, which suggests J1302 is accreting at high Eddington ratio.
3.2. Extremely Soft X-ray Emission
One of the remarkable features of J1302 is the extreme softness of the X-ray spectra. The best-fitted power-law index for the spectrum in the XMM-Newton quiescent state () is one of the steepest soft X-ray photon indices among AGNs (e.g., Grupe et al., 1995; Boller et al., 2011). Understanding the origin of the ultrasoft X-ray emission will help to pin down the nature of the source. Some AGNs such as NLS1s can be very soft (e.g., Boller et al., 1996; Middleton et al., 2007), showing a strong soft X-ray excess over an underlying power-law component. The strength of soft excess can be quantitatively described as the ratio of flux at 0.5 keV to the power law extrapolation of the fitting to the spectrum above 2 keV (Middleton et al., 2007). Since no significant hard X-ray emission above 2 keV was detected in the XMM observation of J1302, we estimated 90% confidence upper limit on the count rates in 2–7 keV, counts s-1, and converted it to an upper limit on the extrapolated flux at 0.5 keV. XSPEC simulations of models with power-law = 2, 2.5 and 3 show that the lower limits on the ratios defined above are 37, 15 and 6.1, respectively. Note that the ratios for a sample of NLS1s (Middleton et al., 2007) are usually found to be less than 10. Thus, the soft emission relative to that at the hard X-rays in J1302 is extremely strong compared to other AGNs.
The origin of soft excess is still unclear. The spectrum at the XMM quiescent state can be fitted well by a Comptonized model and a blackbody plus power-law emission equally. Interestingly, the fitted blackbody temperature ( eV) is much lower than the canonical values of 0.1–0.2 keV found for AGNs (Crummy et al., 2006). Standard accretion disk models (Shakura & Sunyaev, 1973) give a maximum effective temperature of the accreting material eV, where is mass accretion rate in Eddington unit and = . Using and for J1302, we obtained 22 eV, which is comparable to the fitted blackbody temperature. Note that though with larger uncertainties, the lower fitted temperature for the Chandra quiescent state data ( eV) is more compatible with the predicted maximum disk temperature. Therefore, the ultrasoft X-ray emission in J1302 may be connected with the direct thermal emission from the accretion disk. Another constraint on the X-ray spectra due to thermal disk emission can come from the optical/UV data. The optical -band flux of nuclear point source from the HST observation is, however, much higher than the extrapolated MCD flux in the optical (), about one order of magnitude difference. The difference cannot be explained by the contamination from nuclear star clusters, as they have typical absolute -band magnitudes between and (Böker et al., 2002), much lower than the observed -band flux of J1302 nucleus (, obtained with the same GALFIT decomposition of the HST/WFPC2 image as detailed in Section 3.1). To further investigate this difference we need a more realistic disk spectral modeling, and fit to a broader band data, which is beyond the scope of this paper.
3.3. Unusual X-ray variability
Another unusual feature of J1302 is that it clearly shows two distinct states in the X-ray, a flare (or eruptive) state and a quiescent state. The amplitudes of the flare in the Chandra and XMM-Newton light curves look very similar, with the count rates increased by a factor of 5–7 within 1–2 ks. Both the XMM-Newton observation in 2000 and the Chandra observation in 2009 detected rapid flares, suggesting that the flare itself appears repetitive and occurs very frequently in the object. In fact, ROSAT PSPC observations also found that the object is highly variable and demonstrates a rapid flare event in light curve lasting 1.3 ks (Dewangan et al., 2000). The rapid energetic flare in J1302 is fairly rare among Seyfert galaxies and quasars, although some extreme variations have also been found in objects such as IRAS 13224-3809 (Boller et al., 1997) and PKS 0558-504 (Wang et al., 2001). As discussed by Wang et al. (2001), a magnetic coronal model in which electrons in the corona are continuously heated by magnetic reconnection, can produce rapid energetic X-ray flare. A realistic physical model to explain a rapid energetic flare in AGNs, and the comparison with Galactic BHBs are beyond the scope of this work and will be presented elsewhere.
The spectral variability is clearly present between the two flux states with the source being much harder in the flare state. This behavior is markedly contrast to what is commonly seen in AGNs and BHBs (e.g., Markowitz & Edelson, 2004; Done et al., 2007). Clearly the spectral variability cannot be explained by any simple spectral model. One possibility is that the spectrum in the quiescent state is represented by a relatively stable thermal emission from accretion disk, and the spectral variability is caused by the flux variations of a second additional component such as strongly Comptonized power-law emission. This perhaps explains why the photon index for the power-law emission in the XMM-Newton flare state (which dominates the spectrum) is consistent with the additional power-law component in the quiescent state, whose strength is relatively weak. In this case, the underlying power-law emission is still steep (4) compared to other AGNs, the nature of which remains understood. Note that similar spectral change has also been seen in the Chandra observation of J1302, though the spectra statistics for the data is low. Longer X-ray observations are required to examine the presence of persistent flares and to investigate the origin of spectral variability during flare periods. This can in turn shed new lights on the characteristics of corona and accretion flows around BHs.
References
- Boller et al. (1996) Boller, T., Brandt, W. N., & Fink, H. 1996, A&A, 305, 53
- Boller et al. (1997) Boller, T., Brandt, W. N., Fabian, A. C., & Fink, H. H. 1997, MNRAS, 289, 393
- Boller et al. (2011) Boller, T., Schady, P., & Heftrich, T. 2011, ApJ, 731, 16
- Bianchi et al. (2009) Bianchi, S., Guainazzi, M., Matt, G., et al. 2009, A&A, 495, 421
- Böker et al. (2002) Böker, T., Laine, S., van der Marel, R. P., et al. 2002, AJ, 123, 1389
- Caldwell et al. (1999) Caldwell, N., Rose, J. A., & Dendy, K., 1999, AJ, 117, 140
- Crummy et al. (2006) Crummy, J., Fabian, A. C., Gallo, L., & Ross, R. R. 2006, MNRAS, 365, 1067
- Dewangan et al. (2000) Dewangan, G. C., Singh, K. P., Mayya, Y. D., & Anupama, G. C., 2000, MNRAS, 318, 309
- Done et al. (2007) Done, C., Gierlinski, M., & Kubota, A. 2007, A&ARv, 15, 1
- Dong et al. (2005) Dong, X. B., Zhou, H. Y., Wang, T. G., Wang, J. X., Li, C., & Zhou, Y. Y., 2005, ApJ, 620, 629
- Gierlinski & Done (2004) Gierlinski, M., & Done, C., 2004, MNRAS, 349, 7
- Gierlinski et al. (2008) Gierlinski, M., Middleton, M., Martin, W., & Done, C. 2008, Nature, 455, 369
- Grupe et al. (1995) Grupe, D., Beuerman, K., Mannheim, K, et al. 1995, A&A, 300, 21
- Grupe et al. (2010) Grupe, D., Komossa, S., Leighly, K. M., & Page, K. L. 2010, ApJS, 187, 64
- Ho et al. (2012) Ho, L. C., Kim, M., & Terashima, Y. 2012, ApJ, 759, L16
- Kalberla et al. (2005) Kalberla, P.M.W., Burton, W.B., Hartmann, D., Arnal, E.M., et al. 2005, A&A, 440, 775
- Kewley et al. (2006) Kewley, L. J., Groves, B., Kauffmann, & G., Heckman, T. 2006, MNRAS, 372, 961
- Krist et al. (1995) Krist, J. 1995, Astronomical Data Analysis Software and Systems IV, 77, 349
- Marconi et al. (2004) Marconi, A., Risaliti, G., Gilli, R., et al. 2004, MNRAS, 351, 169
- Markowitz & Edelson (2004) Markowitz, A., & Edelson, R. 2004, ApJ, 617, 939
- McGill et al. (2008) McGill, K. L., Woo, J. H., Treu, T., & Malkan, M. A. 2008, ApJ, 673, 703
- McHardy et al. (2006) McHardy, I. M., Koerding, E., Knigge, C., et al. 2006, Natrue, 444, 730
- Middleton et al. (2007) Middleton, M., Done, C., & Gierli ski, M. 2007, MNRAS, 381, 1426
- Miller et al. (2009) Miller, N. A., Hornschemeier, A. E., Mobasher, B. 2009, AJ, 137, 4436
- Morrison & McCammon (1983) Morrison, R., & McCammon, D. 1983, ApJ, 270, 119
- Patrick et al. (2012) Patrick, A. R., Reeves, J. N., Porquet, D., et al. 2012, MNRAS, 426, 2522
- Peng et al. (2010) Peng, C. Y., Ho, L. C., Impey, C. D., & Rix, H. W. 2010, AJ, 139, 2097
- Piconcelli et al. (2005) Piconcelli, E., Jimenez-Bailon, E., Guainazzi, M., et al. 2005, A&A, 432, 15
- Ponti et al. (2012) Ponti, G., Papadakis, I., Bianchi, S., et al. 2012, A&A, 542, A83
- Porquet et al. (2004) Porquet, D., Reeves, J. N., O’Brien, P., & Brinkmann, W. 2004, A&A, 422, 85
- Rees (1984) Rees, M.-J. 1984, ARA&A, 22, 471
- Shakura & Sunyaev (1973) Shakura, N. I., & Sunyaev, R. A. 1973, A&A, 24, 337
- Terashima et al. (2012) Terashima, Y., Kamizasa, N., Awaki, H., et al. 2012, ApJ, 752, 154
- Titarchuk (1994) Titarchuk, L. 1994, ApJ, 434, 570
- Ulrich et al. (1997) Ulrich, M.-H., Maraschi, L., & Urry, C. M. 1997, ARA&A, 35, 445
- Wang et al. (2001) Wang, T. G., Matsuoka, M., Kubo, H., Mihara, T., Negoro, H., 2001, ApJ, 554, 233
- Xiao et al. (2011) Xiao, T., Barth, A. J., Greene, J. E., Ho, L. C.,et al. 2011, ApJ, 739, 28
- Yuan et al. (2010) Yuan, W., Liu, B. F., Zhou, H., & Wang, T. G. 2010, ApJ, 723, 508
| XMM-PN flare state | ||||||||
| wabs*modela | kT | b | /d.o.f. | F0.5-2keVc | L0.5-2keVc | |||
| () | (eV) | ( erg s-1 cm-2) | ( erg s-1) | |||||
| powl | 40.4/28 | 40 | 67 | |||||
| bbody | 0.75(fixed)d | 55.5/29 | 38 | 54 | ||||
| diskbb | 0.75(fixed) | 43.7/29 | 39 | 55 | ||||
| compTTe | 40.3/28 | 40 | 67 | |||||
| XMM-PN quiescent state | ||||||||
| powl | 27.9/40 | 1.6 | 2.8 | |||||
| bbody+powl | 0.75(fixed) | 26.3/39 | 1.7 | 2.5 | ||||
| diskbb+powl | 0.75(fixed) | 25.9/39 | 1.7 | 2.6 | ||||
| compTT | 0.016(0.03) | 27.7/40 | 1.6 | 2.7 | ||||
| Chandra flare state | ||||||||
| wabs*model | kT | /d.o.f. | f0.5-2keV | Lintr,0.5-2keV | ||||
| () | (eV) | ( erg s-1 cm-2) | ( erg s-1) | |||||
| powl | 3.7(11) | 22.5/22 | 34 | 51 | ||||
| bbody | 0.75(fixed) | 27.6/23 | 35 | 47 | ||||
| diskbb | 0.75(fixed) | 22.5/23 | 35 | 47 | ||||
| compTT | 3(20) | 22.5/22 | 34 | 50 | ||||
| Chandra quiescent state | ||||||||
| powl | 0.75(fixed) | 16.5/14 | 3.7 | 5.3 | ||||
| bbody+powl | 0.75(fixed) | 8.0/12 | 3.2 | 4.5 | ||||
| diskbb+powl | 0.75(fixed) | 8.0/12 | 3.2 | 4.4 | ||||
| compTT+powl | 0.75(fixed) | 2.8(3.9) | 0.01(0.09)f | 8.1/12 | 3.1 | 4.3 | ||
-
a
Spectral model (as given in XSPEC) multiplied by a neutral absorption (wabs) with column density . wabs is the photo-electric absorption model using Wisconsin–Morrison & McCammon (1983) cross-sections.
-
b
Plasma optical depth in the CompTT model.
-
c
is the observed 0.5–2 keV flux in units of . is the unabsorbed luminosity in the energy range of 0.5–2 keV, in units of .
-
d
The column density was fixed to Galactic value if the fitting yields a .
-
e
The spectrum of the seed photons is assumed to be Wien law with a temperature of 22 eV (see Section 3.2 for details). We fixed the plasma temperature at 20 keV and obtained constraints on the optical depth.
-
f
Pegged at the minimum value allowed in XSPEC.