An octave bandwidth frequency independent dipole antenna
Abstract
Precision measurements of the spectrum of the cosmic radio background require frequency independent antennas of small electrical dimensions. We describe the design of a wide-band fat-dipole antenna with a sinusoidal profile having a frequency independent performance over the octave band 87.5 to 175 MHz. The input return loss exceeds 15 dB and the radiation power pattern is frequency invariant and close to cosine square over the octave bandwidth. The structure has been optimized using electromagnetic modeling, and the design has been validated by constructing a prototype.
Index Terms:
Antenna measurements, radio astronomy, reflector antennas.I Introduction
A simple half-wave dipole antenna works on the principle of resonance; therefore, it inherently has a narrow bandwidth and its radiation pattern and impedance change rapidly away from the resonant frequency. In general, any antenna structure whose thickness varies smoothly over its length would radiate energy efficiently over a wide frequency range. However, its impedance and radiation characteristics would be independent of frequency only if its surface current decays linearly away from the feed point in a frequency dependent fashion [1]. Several such antenna structures that exhibit frequency independent performance have been discussed in the literature [2].
The scientific motivation of designing a frequency independent antenna is to measure the brightness spectrum of the cosmic radio background and faint features in the spectrum that arise from redshifted atomic hydrogen 21cm emission. The brightness spectrum is expected to have structures over a range of scales. If the antenna used to measure has frequency dependent radiation pattern, it results in spurious spectral response similar the red shifted 21cm emission. To avoid this problem, a frequency independent antenna is required [3].
With the aim of deriving a frequency independent antenna for the measurement of cosmic radio background in the frequency range 87.5–175 MHz, we carried out electromagnetic simulations of a few types of smoothly profiled fat-dipole structures and examined their performance for frequency independent behaviour. We used WIPL-D electromagnetic (EM) simulation software for modeling. Our study showed that a dipole with a sinusoidal profile exhibits good frequency independent characteristics over the octave band 87.5 to 175 MHz. A prototype of the fat-dipole operating in this frequency range has been built and tested for its frequency independent performance. Section II of this paper describes our design objectives motivated by observational cosmology. Our investigations of a few types of smoothly profiled fat-dipole structures, especially the sinusoidal profile in detail, are described in Section III. Section IV contains the details of fabrication of the prototype dipole. The antenna performance measurements are described in Sections V to VIII and our work is summarized in section IX.
II Design objectives
The motivation for the antenna design is in its application for a wide band spectral measurement of the cosmic radio background; specifically for the detection of features arising from events in the epoch of reionization [4], [5]. Cosmological expansion of the Universe shifts the 1420.4 MHz spin flip transition of neutral atomic hydrogen gas, which is the most abundant element in early times and in the epoch of reionization, by factors between 8–15 into the octave band 87.5–175 MHz. The cosmological signals are predicted to be at most 20–30 mK and hence about times weaker than the foreground emission from celestial radio sources. Nevertheless, they may be distinguished by their frequency structure that is in contrast with the relatively smoother foregrounds [6], which arise from impulsive thermal brehmsstrahlung and synchrotron processes that are inherently broad spectrum emissions. In our application, the designed dipole will be used to estimate the cosmological signal averaged over a wide field of view in the sky. This will be carried out by measuring the total power from the sky using the designed dipole and subtracting from it a model for the foreground emission of the sky and the receiver noise derived from the same set of observations [3].
Two characteristics of an antenna element relevant for detecting weak spectral signatures in the sky signal are i) Radiation pattern and ii) Return loss. Their dependence on frequency plays a major role in limiting the detectability of such signals.
To arrive at the design specifications of the dipole, we model the sky temperature distribution using the 408 MHz sky survey of Haslam et al. [7]. We also assume a spectral index distribution that is given by the brightness ratio between this image and that of the 150-MHz all-sky map synthesized by Landecker et al. [8]. When averaged over a significant sky area, the variation in log temperature versus log frequency is well fit by a third order polynomial. However, the brightness variations over the sky will naturally result in undesirable spectral structure and enhanced residuals to the above fit if the measuring antenna has a radiation pattern that varies with frequency. We have computed the increase in residuals to the above fit assuming frequency dependence in the antenna beam pattern and find that residuals would be less than 5 mK (a small fraction of the signal expected) if the half-power beamwidth varies by less than over the frequency range 87.5 to 175 MHz. This defines the tolerance for frequency dependence of the radiation power pattern of the fat dipole antenna. Since in general an electrically small radiator exhibits a frequency independent radiation pattern, we prefer to have an antenna which is electrically small in dimensions.
An antenna with relatively constant impedance is preferred, so that the antenna gain losses as well as internal reflections of the receiver noise are low and vary smoothly with frequency. For efficient performance, a return loss of 10 dB or more is preferred over the entire frequency band. However, even with this return loss, a 0.1 dB variation in it results in a passband ripple of about 0.5 K, for an antenna temperature of 200 K. A carefully crafted bandpass calibration methodology is required to eliminate this problem; nevertheless, a low and relatively uniform return loss without any inflection points in the band of interest is desirable to relax the calibration requirements. Several broadband antennas are available off-the-shelf for Eg. Quadridged horn antenna from ETS Lindgren(www.ets-lindgren.com), magnetic mount antenna from Antenna Products (www.antennaproducts.com) and omni directional wide band antenna from AntennaSys Inc.(www.antennasys.com) which have bandwidth more than an octave. However, they do not seem to have frequency independent beam characteristics and smoothly varying impedance match over their operating band. These two aspects have been achieved in the work presented in this paper.
III Investigation of smoothly profiled fat dipole structures
Frequency independent antenna characteristics are exhibited by radiating structures whose shapes are specified only in terms of angles. Additionally, biconical antennas that are infinitely long and specified only in terms of the included cone angle also exhibit frequency independence characteristics[9]. However, because of their unmanageable dimensions, they are not practically realizable. Meeting the frequency independent requirement in a finite structure requires that the current attenuates along the structure and be negligible at the point of truncation. The profile of the antenna structure is expected to play an important role in attenuating the surface current. In addition, it also controls the radiation reactance of the antenna. A profile that gives minimum radiation reactance is always preferred.
Several authors have investigated the broad band performance of planar fat dipole structures having different profiles [10-12]. Those structures are found to have non-uniform radiation patterns with large dispersion in their half power beamwidths and higher order impedance responses, which are unacceptable for the application on hand. In view of this, we investigated the frequency-independent performance of non-planar dipoles having five different smooth profiles : i) exponential ii) conical with multi-conic sections iii) cubic spline iv) sine-square and v) sinusoidal. The investigation was carried out through simulations using WIPL-D - an electromagnetic modeling and simulation software (www.wipl-d.com) used extensively for accurate frequency-domain analysis of metallic structures.
In our simulation, the first three profiles for a two point excitation showed a variation in the radiation reactance in the range to +100 ohms and the fourth one showed a variation in the range of 0 to 35 ohms in the frequency range 87.5 to 175 MHz. However, with the sinusoidal profile, this variation was limited to the range -10 to +10 ohms. This led us to simulate and explore the sinusoidal profile in greater detail.
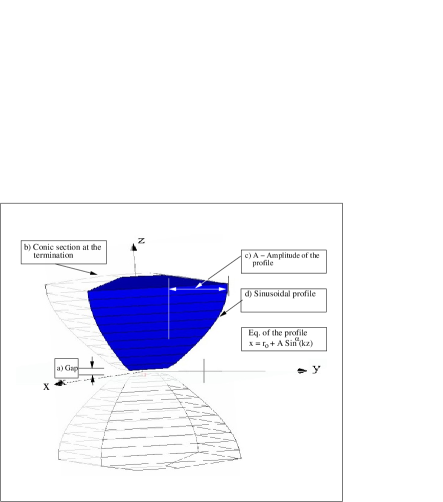
Each arm of the fat dipole simulated, has basically three sections : i) input conic section ii) profiled middle section and iii) terminating conic section. A finite gap separates the two arms and provides space for making electrical connections.
The input conic section varies the thickness of the dipole smoothly at the feeding point. This gradual variation helps in maintaining input impedance of the dipole constant over a wide range of frequencies.
The profiled middle section controls i) the generation of the reactive component of the antenna impedance and ii) the dependency of the radiation pattern on frequency. The profile used in our design is described by the equation :
where
is the radial shift given to the profile while making the dipole thick
is the amplitude of the profile defined in terms of operating wavelength,
is the index of the sinusoidal function,
= 2/ and
is the design wavelength. Fig. 1 shows a 3-D view of the structure investigated, with its various
parameters indicated.
A short dipole exhibits frequency independent characteristics and since we aim to design a profiled dipole that is
short over an octave bandwidth, the design frequency
is biased towards the higher frequency end of the band.
The conic section at the termination minimizes abrupt reflection of surface current. Any abrupt reflection is expected to narrow the operating bandwidth; therefore, the output conic section is profiled smoothly like the input conic section.
The body of revolution of the dipole has been approximated by four flat aluminium sheets each bent along a sinusoidal profile. This simplification was adopted to ease the manufacturing process of the dipole and make disassembly and transportation to remote observing sites easy. The entire simulation study was carried out for this simplified structure.
The simulation was employed mainly to understand the influence of i) various physical parameters of the proposed dipole structure, and ii) the design wavelength, on the input return loss and radiation pattern of the antenna. We examined physical parameters like a) the gap between the two arms of the dipole structure, b) the dimension of the conic sections at the feeding point and termination and c) functional form of the profile and its amplitude. Each parameter was varied over a finite range based on constraints posed by physical realizability.

In our simulation, optimization of the structure was not carried out using the entire parameter space available, to obtain a global minimum. Instead, a technique similar to the gradient descent was adopted to optimize each of the system parameters. In this method, each parameter was varied from its initial value assigned over a range decided mainly by the fabrication considerations, in the direction of the negative gradient of the vector till a local minimum was reached. The gradient vector represents the change in the antenna performance as a function of physical parameters.
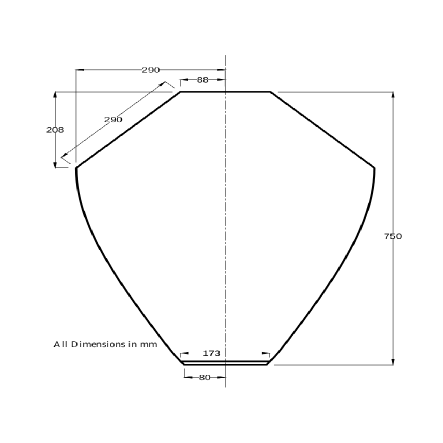
The antenna performance was quantified by estimating the variation of 3-dB beamwidth as a function of frequency and visually inspecting the return loss for its smooth and flat response. Fig. 2 shows the schematic diagram of the fat dipole with optimized structural parameters.
Normally a resonating antenna exhibits frequency independent characteristics when it is used as a short dipole. Therefore, if we ensure that the electrical length of the antenna is smaller than half wave length at the highest frequency of operation, then the antenna would act as a short dipole over most of the operating band. However, a short dipole does not have an easily matchable impedance characteristic even over an octave bandwidth.
The wavelength for defining the electrical dimension of the structure was varied in simulation over a wide range in the operating band, covering the entire band of interest trying to obtain both frequency independent radiation characteristics and lower order return loss response. After simulation, 2027 mm was obtained as an optimum design wavelength () for which the dipole exhibited a minimum deviation ( 2 %) of 3-dB beamwidth across the entire frequency band and greater than 10 dB return loss. 2027 mm corresponds to a frequency of 148 MHz. As expected, this is much closer to 175 MHz which is the maximum frequency of operation.
In order to study the behaviour of the dipole, each parameter was varied about its optimal value and at each step the system response was carefully monitored.
The gap between the two arms of the dipole structure was varied between 20 mm to 56 mm. It was found that it had a major influence on the return loss of the antenna. A gap lesser than 30 mm resulted in a return loss exceeding 15 dB only at lower frequencies while a gap more than 40 mm improved return loss only at higher frequencies. However, a gap of 37.2 mm resulted in a return loss dB throughout the frequency range. Fig. 3 shows the variation of the input return loss over the frequency range 87.5–175 MHz for a range of gaps between the two arms of the dipole structure. In this plot other parameters of the antenna structure were maintained at their optimal values obtained in the design study (see Fig. 2). The gap did not appear to have any significant effect on the radiation patterns at different frequencies.

The dimension of the truncated conic section at the feeding point also influences the return loss substantially. The radius of the conic section at the feeding point was varied from 60 mm to 150 mm. It was noticed that the return loss had a subtantial variation in the frequency range 87.5 to 175 MHz both at lower and higher values of the radius. For a radius (r2) of 113 mm at the feeding point and 153 mm (r1) at the start of the flare, return loss observed exceeded 15 dB over the entire band and had a uniform response with frequency.
The index of the sinusoidal function used to form the profile of the antenna structure was varied in the range 0.5–1.5. Lower index value improved the return loss at lower frequencies but degraded it at higher frequencies whereas higher index value improved return loss at higher frequencies but worsened it at lower frequencies. An index value of one was observed to be optimum for a return loss over the entire frequency band. The antenna response for various index values are shown in Fig. 4. The deviation of 3-dB beam width was found to be more than 2 at both lower and higher index values. So to satisfy both the requirements of good return loss and also uniformity in beam pattern, an index value of 1 was selected for the sinusoidal profile.

The amplitude of the profile () is another parameter that has substantial influence on both the input return loss and 3-dB beamwidth at various frequencies. The initial value assigned to it was half the electrical length of each arm () at the designed optimum wavelenth. When the magnitude of the amplitude was varied around this value, it was found that the required characteristics like good return loss () and frequency independent behaviour of the radiation pattern could be achieved only over a narrow range of amplitude values. Both at lower and higher values, return loss exhibited sharp resonances resulting in large variation of return loss over a narrow range of frequencies. In addition, the variation of 3-dB beam width was also more than 5 across the entire band. The optimum value determined for the amplitude of the profile was 1.2 ; for this choice the return loss showed uniform response with frequency and the deviation in 3-dB beamwidth was less than 5.
The dimension of the conic section at the termination did not have any noticeable influence on either the radiation characteristics or the input return loss. This indicates that the surface currents near the end points are negligible over the entire frequency range of operation and hence does not affect the frequency-independent performance. In a similar way, the conic section at the feeding point also did not have any influence on the radiation pattern.
The simulation of the entire antenna structure was carried out without having any ground reflector below. The presence of a reflector at a finite distance makes the response of the antenna highly frequency dependent and, therefore, the antenna is intended for use above an absorber plane.
IV Fabrication of a prototype of the fat dipole antenna with a Sinusoidal profile
As a first step in the process of fabrication, the length of the lateral surface (L) and the thickness (W) of the dipole structure are determined. An aluminium sheet measuring L meter long and W meter wide is taken and kept on a graph sheet. Assuming that the graph sheet represents the XoZ plane, the lower edge of the sheet is kept aligned along the x-axis. The sheet is displaced from the x-axis in the +ve z direction by a distance equal to half the centre gap of the dipole structure.
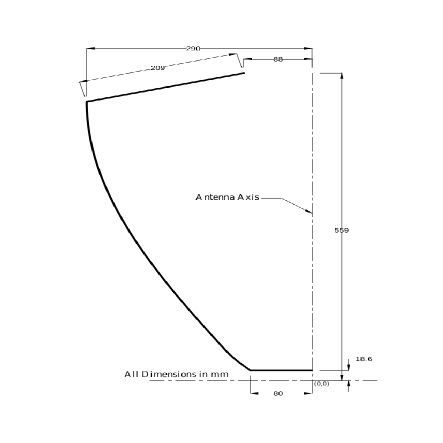
At every point on the profile of the structure, the width of the sheet is calculated from the relationship : Width = 2*x*cos(45), where x represents the x-co-ordinate of the point (Refer Eq. 1) considered on the profile. The angle 45 deg. used in the above relationship assumes that the dipole structure has square cross section. The widths obtained are transferred to the sheet at their respective distances from the bottom edge of the sheet. In a similar way, the widths at the feeding and terminating sections are also determined and transferred to the sheet. After completing this process, the sheet is cut along the transferred marks to obtain a shape as shown in Fig. 5.
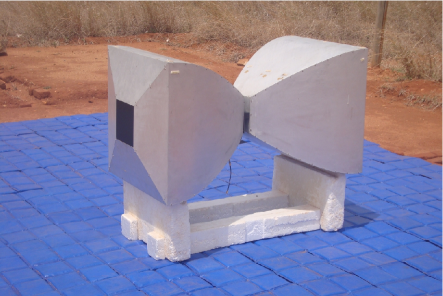
To bend the sheet, the distance of every point on the profile from the z-axis (antenna axis) is found out using the relationship : Distance from antenna axis = x*cos(45). The sheet is bent at every point marked on it, maintaining the distance determined above from the antenna axis (Refer Fig. 6). This process is repeated for eight aluminium sheets. Once they are cut and bent, they are fastened along their edges using bolts and L-brackets to get the desired shape as shown in Fig. 7. The two halves of the dipole were held rigidly together using non-electrically conducting bakelite spacers. This was done to minimize mechanical stress on the feed terminals while making electrical connections between the antenna and the balun. The entire antenna was mounted on light weight styrofoam to ensure that the antenna performance is not affected by the supporting structure.
Tags mounted at the center of the square blocks at the inner ends of the two dipole arms serve as feed points. These tags are normally connected to the inputs of a transformer type balun for converting the balanced output of the antenna to unbalanced output.
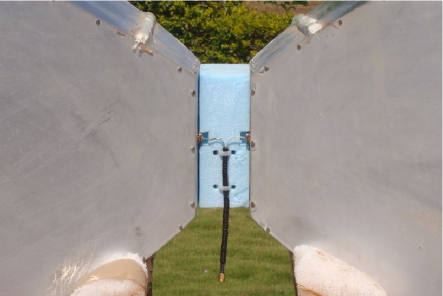
However, imperfect electrical characteristics of transformer type balun prevent the true impedance of the antenna to appear at its output. This problem was overcome by using a choke balun formed out of a RG-174 co-axial cable with ferrite beads. Fig. 8 shows the photograph of the feeding section in which the antenna output is connected to the choke balun. Measurements made to estimate the resistive loss due to the ferrite beads revealed that the attenuation was less than 1 dB. The antenna signal is expected to get attenuated by this much before reaching the receiver input terminals.
Antenna measurements were made on the prototype to characterize the radiation and impedance properties of the antenna; these are described below.
.
V Measurement of Return loss
Return loss is an important performance indicator of an antenna. It indicates the loss while coupling the sky signal from free space via the antenna to its feed terminals. It is primarily due to impedance mismatch between i) the free space and the antenna as well as ii) the antenna and the transmission line connected to its terminals . One of the main objectives in wide-band antenna design is to minimize this impedance mismatch and consequent signal loss across the band so that sky signal coupling efficiency of the antenna is maximized.
The return loss was measured using Agilent Field Fox RF analyser N9912A. The antenna under test was placed over absorber ferrite tiles in order to minimize ground reflection and the measurement was done in an open field. The ferrite tiles were sourced from Panashield Inc.(Model No. SFA 6.3) and were selected to be good absorbers in the frequency range of interest: they reflect only about 0.3 of the incident radiation in the frequency range 87.5 to 175 MHz.


Fig. 9(a) shows the return loss plot of antenna in the frequency range 87.5–175 MHz. Curve with square symbol represents simulation while the other one is the measurement. The return loss measured is greater than 15 dB over the entire frequency range. Generally a half wave dipole tuned to a particular frequency will have a large reactive and real impedance on either side of the resonant frequency. A thin half wave dipole resonant at 130 MHz will have reactive impedance ranging from ohms to 375 ohms and a real part varying from 52 ohms to 246 ohms across the octave band. This would result in a poor impedance match with a 50 ohm transmission line. The fat dipole that we have designed and constructed shows superior performance both in terms of its real and reactive impedances. Over the frequency range of operation, the real component is in the range 40 to 60 ohms and the reactive component is within the range -10 to +10 ohms. This narrow impedance variation over the frequency range gives the fat-dipole an impedance that is fairly well matched to a 50 ohm transmission line, resulting in a broadband performance. Substantial reduction in the reactive component is attributed mainly to the design profile of the fat-dipole antenna. Fig. 9b shows the real and imaginary parts of the antenna impedance. Measurements follow the expectations based on the EM simulations within about 10 ohms.
VI Measurement of currents on the antenna surface
Our EM simulations show that the distribution of current on the antenna surface is frequency dependent. We measured the current distribution on the surface of the prototype using a near-field loop antenna probe from ETS-Lindren (model No.7405). In the experimental setup a CW signal derived from a standard signal generator is given to the antenna feed point. The near field probe is scanned along the surface of the antenna parallel to its axis. The plane of the loop probe is oriented parallel the antenna axis in order to maximize the voltage induced by the antenna surface current. The probe is integrated with an amplifier so that the signal strength in the cable at the amplifier output dominates any spurious radiative coupling from the antenna directly to the cable. The amplified signal power from the probe is measured using a spectrum analyzer. Measurements of surface current were carried out at five frequencies across the operating band.
Fig. 10 shows the log-log plot of the measured current as a function of distance from the feed point. The distance in the plot is expressed in terms of wavelength and the vertical scale is adjusted to correct for gain at different frequencies. The constant slope in the plot indicates that the surface current decays in a frequency dependent way as required for the frequency independent behaviour of the antenna. Edge effects are thought to be responsible for the spread in the current distribution at the end points. The expectation based on EM simulation is shown in Fig. 11. The measurements made match closely the simulation results.


VII Measurement of the radiation Pattern of the antenna
The antenna radiation pattern was measured at five frequencies 90, 110,130,150 and 170 MHz across the 87.5 to 175 MHz band. In general, measurement of the radiation pattern of non-directive antennas at low frequencies is challenging since multiple reflections from nearby objects and particularly the ground poses formidable challenges in accurately measuring the antenna pattern. Since antennas at low frequencies tend to be bigger in size and have larger regions of reactive fields, the zone of avoidance around the antenna under test tends to be larger at lower frequencies exacerbating the problem. The electrical size or cross-section of stray wires and other metallic objects in the environment is greater at lower frequencies, making the requirement of having a clean and large volume for measurements important.
In the experimental set up for the measurement, the antenna under test was used as a receiver and a short dipole antenna whose length was approximately 1/10th of the wavelength at 130 MHz, was used as the transmitter. Both the antennas were kept off the ground and the dipole arms were oriented parallel to the ground. The center of the fat dipole was raised 1.2 m above the ground. The ground below the fat dipole and between the transmitter and receiving antennas were covered by ferrite absorber tiles to attenuate ground reflections. With the absorbers reflecting only three parts in 1000 of the incident wave in the frequency range 87.5–175 MHz, the pattern measurement is expected to be accurate to better than . A stable signal generator model Agilent E 8257D is used to feed the transmitter with a CW signal at discrete frequencies across the band and at a constant power level. The receiver antenna signal is connected to a spectrum analyzer through a co-axial cable for the power measurement. The co-axial cable was routed below the absorber so that the measurement was not affected by the signal flowing through it. While conducting the pattern measurement, the transmitter is kept fixed and the receiving antenna, which is the antenna under test, is rotated in azimuth over a range exceeding . While making measurement, the antenna under test is mounted on a rotating platform which had an angular scale marked on it from 0 deg. to 360 deg. in steps of 10 deg.
At all of the frequencies, the measured patterns were symmetrical and had no significant offsets in peak response. The nulls along the dipole arms were measured to be as deep as 27 dB below the central maximum. The patterns over the octave band of frequencies were very similar indicating the broad band performance of the antenna. Figs. 12 and 13 show plots of the radiation pattern in both logarithmic and linear units: log scale plots are useful to show the stop band performance and depth of the nulls, linear plots are useful in examining the pass band performance and shape of the main lobe. The mean half power beam width (HPBW) of the measured patterns is , which matches roughly the WIPL-D simulation result of (see Fig. 14). The deviation of the measured beamwidth from the simulation is approximately 2.3. The reason for the deviation observed is attributed partly to the measurement error and the rest to the inaccuracies in the structural dimension occurred in the process of fabrication.
The change in HPBW is measured to be 2.1 across the operating frequency range; the expectation for this variation based on the EM simulation is 1.4 (see Fig. 15). Since the antenna is designed to be a short dipole, its radiation pattern is expected to be cosine square function. Fig. 16 shows the deviation in the measured radiation pattern from this form. The measured deviation from a cosine square pattern is much less than over the octave operating frequency range and within of maximum response.
VIII Measurement of the absolute gain of the antenna
The absolute gain of the fat dipole was measured by adopting a standard two antenna method in which a half wave dipole was used as the transmitter and the fat dipole as a receiver. While conducting the experiment, the fat dipole was kept above the absorbing tile at a distance of about 1 meter. The halfwave dipole was kept vertically above it, at a distance, more than its far field distance. The half wave dipole was connected to a standard signal generator for transmitting the signal of its resonant frequency whereas the fat dipole was connected to a spectrum analyser to measure the power received by it. Friis transmission equation was used to relate the power transmitted by the half wave dipole to the power received and estimate the gain of the fat dipole using the gain of the half wave dipole.
The gain of the half wave dipole was independently determined using a similar approach as mentioned above in which two identical half wave dipoles were used to transmit and receive signals. The gain of the half wave dipole estimated was close to the theoretical value of 2.15 dB. This enhanced our confidence in the estimation of the absolute gain of the fat dipole. Since each half wave dipole designed was of narrow bandwidth in nature, different dipoles were designed to operate at 93 MHz, 122 MHz, 143 MHz and 169 MHz to estimate the absolute gain of the fat dipole over the frequency range (87.5-175) MHz. Around each of the above frequencies, gain was estimated over 5 MHz bandwidth. The mean value of the absolute gain obtained and the standard error of the mean is shown in the Fig. 17 as a function of frequency along with the simulation result. The estimation of gain has been carried out after taking into account both the mismatch loss and resistive loss present in the measurement setup. The deviation of the estimated gain from the simulation result may be because of the error in the estimation of loss in the feeding section and inherent loss in the antenna structure itself.


IX Summary
We have designed and developed a low loss frequency independent fat dipole antenna having an octave bandwidth in the frequency range 87.5 to 175 MHz. It has a radiation pattern that varies across the frequency band and a return loss exceeding 15 dB. The frequency independent performance achieved in the impedance and radiation characteristics is attributed mainly to the sinusoidal profile given to the arms of the fat dipole. The radiation pattern is close to a Cosine-square form and the measurement results match the results of EM simulations. The fat-dipole is a useful antenna for the measurement of the cosmic radio background spectrum and, in particular, the all-sky signal from the cosmological epoch of re-ionization.
Acknowledgment
The authors thank the members of radio astronomy laboratory of the Raman Research Institute for assistance in the design of balun and interconnecting cables. The mechanical engineering workshop of the Institute headed by Ateequlla, Durai and Damodaran fabricated the antenna structure along with a styrofoam base. Ashwathappa and members of the Gauribidanur Observatory helped set up the field measurements.
References
- [1] V. H. Rumsey, ”Frequency Independent Antennas,” Academic press., 1966.
- [2] G. H. Brown, and O. M. Woodwarad, ”Experimentally determined Radiation characteristics of Conical and Triangular Antennas,” RCA Rev., 13, pp. 425-452, Dec. 1952.
- [3] Nipanjana Patra, Ravi Subrahmanyan, A. Raghunathan, N. Udaya Shankar,”SARAS: a precision system for measurement of the Cosmic Radio Background and Signatures from the Epoch of Reionization”, astro-ph,arxiv:1211.3800,2012.
- [4] P. A. Shaver, R. A. Windhorst, P. Madau, and A. G. de Bruyn,”Can the reionization epoch be detected as a global signature in the cosmic background?,” Astron. Astrophys., vol. 345, pp. 380-390, 1999.
- [5] Pritchard, R. Jonathan, and Abraham Loeb,”Evolution of the 21cm signal throughout cosmic history,” Phys. Rev. D, vol. 78, Issue 10, id. 103511, 2008.
- [6] Adrian Liu, and Max Tegmark, ”How well can we measure and understand foregrounds with 21cm experiment,”,Mon.Not.R. Astron. Soc.,vol. 419, pp. 3491-3504, 2012.
- [7] C. G. T. Haslam, C. J. Salter, H. Stoffel, and W. E. Wilson, ”A 408 MHz All-Sky continuum survey. II - The aAtlas of Contour Maps,” Astron.Astrophys.Suppl.Ser., vol. 47, pp. 1-143, 1982.
- [8] T. L. Landecker, and R. Wielebinski, ”The Galactic Metre Wave Radiation: A two-frequency survey between declinations +25 and -25 and the preparation of a map of the whole sky,” Aust. J. Phys. Suppl., vol. 16, pp. 1-30, 1970.
- [9] S. A. Schelkunoff, ”Electromagnetic Waves”, Van Nostrand, New York: 1943, pp. 441.
- [10] Young-Jin Park, and Jong-Hwa Song, ”Development of Ultra wideband planar stepped-fat dipole antenna,”Microwave and optical Technology Letters, Vol. 48, No. 9, pp1668-1671, Sept. 2006.
- [11] Yi-Min Lu,Xue-Xia Yang, and Guo-Xin Zheng, ”Analysis on a novel ultra-wide bandwidth antenna of doubleprinted circular disc,” Microwave and optical Technology Letters,Vol. 49, No.2, February 2007.
- [12] Joung Myoun Kim, Young Joong Yoon, Cheol Sig Pyo, ”Wideband Printed fat dipole fed by tapered microstrip balun,” Antennas and Propagation Society International Symposium,Vol.3,Pg. 32-35, 2003.
![[Uncaptioned image]](/html/1304.2919/assets/x19.png) |
Agaram Raghunathan received the B.E degree in Instrumentation Engineering from Bangalore Institute of Technology, Bangalore,1990 and M.Sc.Engg.(By Research) from Engineering dept. of the Bangalore University, India, 2000.Since 1990,he has been at the Raman Research Institute, Bangalore, India. |
![[Uncaptioned image]](/html/1304.2919/assets/x20.png) |
Udaya Shankar N received the M.Sc. degree in Physics from the Bangalore University in 1973 and Ph.D degree in astronomy in 1986. Since 1978 he has been at the Raman Research Institute Bangalore, India, working on the instrumentation for aperture arrays, wide-field imaging and sky surveys. |
![[Uncaptioned image]](/html/1304.2919/assets/x21.png) |
Ravi Subrahmanyan received the B.Tech degree in Electrical Engineering from the Indian Institute of Technology, Madras, India, in 1983 and the Ph.D. degree in astronomy from the Physics department of the Indian Institute of Science, Bangalore, India, in 1990. Since 2006, he has been at the Raman Research Institute, Bangalore, India. |