Resolving the gap and AU-scale asymmetries in the pre-transitional disk of V1247 Orionis
Abstract
Pre-transitional disks are protoplanetary disks with a gapped disk structure, potentially indicating the presence of young planets in these systems. In order to explore the structure of these objects and their gap-opening mechanism, we observed the pre-transitional disk V1247 Orionis (catalog ) using the Very Large Telescope Interferometer, the Keck Interferometer, Keck-II, Gemini South, and IRTF. This allows us spatially resolve the AU-scale disk structure from near- to mid-infrared wavelengths (1.5 to 13 m), tracing material at different temperatures and over a wide range of stellocentric radii. Our observations reveal a narrow, optically-thick inner-disk component (located at 0.18 AU from the star) that is separated from the optically thick outer disk (radii AU), providing unambiguous evidence for the existence of a gap in this pre-transitional disk. Surprisingly, we find that the gap region is filled with significant amounts of optically thin material with a carbon-dominated dust mineralogy. The presence of this optically thin gap material cannot be deduced solely from the spectral energy distribution, yet it is the dominant contributor at mid-infrared wavelengths. Furthermore, using Keck/NIRC2 aperture masking observations in the , , and band, we detect asymmetries in the brightness distribution on scales of 15–40 AU, i.e. within the gap region. The detected asymmetries are highly significant, yet their amplitude and direction changes with wavelength, which is not consistent with a companion interpretation but indicates an inhomogeneous distribution of the gap material. We interpret this as strong evidence for the presence of complex density structures, possibly reflecting the dynamical interaction of the disk material with sub-stellar mass bodies that are responsible for the gap clearing.
Subject headings:
stars: pre-main-sequence — planetary systems: protoplanetary disks — accretion, accretion disks – techniques: interferometric1. Introduction
Planets are believed to form in the circumstellar disks around young stars, either through a process of core accretion (Pollack et al., 1996) or gravitational instabilities in the more extended disk regions (Boss, 2000). A particularly interesting phase in this process starts when the newly-formed planetary bodies have gained sufficient mass to interact with the ambient disk material and affect the disk structure significantly (e.g. Paardekooper & Mellema, 2004). Potential candidates for disks that might have been dynamically affected by planetary bodies are the transitional disks (Strom et al., 1989) and pre-transitional disks (Espaillat et al., 2007). These objects exhibit a strong far-infrared ( m) excess, but have a significantly reduced near-infrared (NIR) to mid-infrared (MIR) excess compared to classical T Tauri disks. This reduced excess emission indicates that the inner-most disk regions contain only optically thin gas and dust (transitional disks) or exhibit an extended gap, which separates the optically thick inner disk from the outer disk (pre-transitional disks). The inner “holes” and gaps observed in transitional/pre-transitional disks could be caused by disk-planet interaction (e.g. Quillen et al., 2004; Kraus & Ireland, 2012), but several alternative disk clearing scenarios have been proposed, including grain growth (e.g. Dullemond & Dominik, 2005), magnetorotational instabilities (Chiang & Murray-Clay, 2007), photoevaporation (Alexander & Armitage, 2007), and truncation by close-in stellar companions (Ireland & Kraus, 2008).
Most of the aforementioned processes take place in the inner few astronomical units (AU) around the central star, corresponding to angular scales , even for the nearest young stars. Given that these scales are not accessible with conventional imaging techniques, earlier studies relied mostly on the modelling of spatially unresolved constraints, in particular the spectral energy distribution (SED). However, these modelling techniques suffer from well-known degeneracies – grain temperature, for instance, is sensitive to both its distance from the illuminating star, the particle size, and the dust composition (Thamm et al., 1994; Vinković et al., 2003). Therefore, we initiated an observational campaign to study these objects using a multi-wavelength interferometry approach, where we combine near- and mid-infrared interferometry constraints. The data set includes long-baseline interferometric data from the Keck Interferometer (KI) and Very Large Telescope Interferometer (VLTI), single-dish interferometric data from Keck & Gemini South, and spectroscopic data from IRTF and the ESO 3.6 m telescope. Given the wide wavelength coverage (m), our interferometric observations probe a wide range of dust temperatures and material located over a wide range of stellocentric radii, from sub-AU to tens of AU.
Here, we report first results from our campaign, focusing on the pre-transitional disk object V1247 Orionis (catalog ) (HD 290764, PDS 192). V1247 Ori is likely a member of the Orion OB1 b association (Schild & Cowley, 1971; Guetter, 1981) and the Alnilam cluster (also known as “ Orionis cluster” and “Collinder 70”), whose age has been estimated to 5-10 Myr (Caballero & Solano, 2008). There is also considerable debate in the literature concerning the precise spectral classification of V1247 Ori, ranging from spectral types of F0V (Vieira et al., 2003) to A5III (Schild & Cowley, 1971), which has caused us to re-evaluate the spectral classification in our study. Caballero (2010) reported the observation of two isolated, but deep UX Ori-like occultation events, which were attributed to occultation from disk material in the inner disk regions. The SED of V1247 Ori shows a significantly reduced excess emission in the wavelength range m (Caballero, 2010), revealing similarities with other pre-transitional disk objects. However, V1247 Ori is of considerably earlier spectral type than most other pre-transitional disks, which makes this system an interesting laborary to study disk evolution and planet-formation in the intermediate-mass regime ().
In the following, we present our extensive observational data set (Sect. 2) and our results, including a re-evaluation of the spectral classification of the central star (Sect. 3.1), the SED and line diagnostics (Sect. 3.2), our interferometric constraints on the disk structure (Sect. 3.3), and a global model based on our multi-wavelength interferometry and SED constraints (Sect. 3.4). Finally, we discuss the implications of our work on the understanding of the pre-transitional disk phase (Sect. 4) and summarize our conclusions (Sect. 5).
2. Observations
| Instrument | UT Date | Mode | Seeing | Calibrator |
|---|---|---|---|---|
| [YYYY/MM/DD] | [arcsec] | |||
| IRTF/SpeX | 2010/02/28 | SXD | 0.6 | HD 34203 |
| LXD | HD 34203 | |||
| Prism | HD 34203 | |||
| IRTF/SpeXaaSXD only due to clouds (1-mag variations in sky transparency). | 2011/03/04 | SXD | 0.8 | HD 34203 |
| IRTF/BASSbbExceptionally low precipitable water vapor allowed observations through the 6 m water vapor band. | 2011/10/17 | 0.7 | HD 29139 | |
| IRTF/SpeXccNo Prism observations due to thin cirrus. | 2011/10/18 | SXD | 0.6 | HD 34203 |
| LXD | HD 34203 | |||
| KI/ASTRA | 2011/11/05 | V2-SPR | 0.6 | HD 41794, HD 37331 |
| Gemini S/T-ReCS | 2011/11/23 | Si-2 | 0.5 | HD 36167 |
| Si-3 | HD 36167 | |||
| Si-5 | HD 36167 | |||
| VLTI/AMBER | 2011/12/09 | LR- | 1.1 | HD 37331, HD 36059 |
| VLTI/MIDI | 2011/12/11 | Prism | 0.9 | HD 39400 |
| VLTI/MIDI | 2011/12/12 | Prism | 0.7 | HD 39400 |
| Keck-II/NIRC2 | 2012/01/08 | K’ | 0.4 | HD 37634, HD 38406 |
| Keck-II/NIRC2 | 2012/01/10 | H | 1.1 | HD 37331 |
| L’ | 1.3 | HD 37634, HD 38406 | ||
| IRTF/SpeX | 2012/02/26 | SXD | 0.9 | HD 34203 |
| LXD | HD 34203 | |||
| Prism | HD 34203 | |||
| IRTF/SpeX | 2012/09/12 | SXD | 0.8 | HD 34203 |
| LXD | HD 34203 | |||
| Prism | HD 34203 | |||
| IRTF/SpeX | 2012/11/04 | SXD | 0.4 | HD 34203 |
| LXD | HD 34203 | |||
| Prism | HD 34203 |
2.1. IRTF/SpeX+BASS near- and mid-infrared spectroscopy and archival spectro-photometry
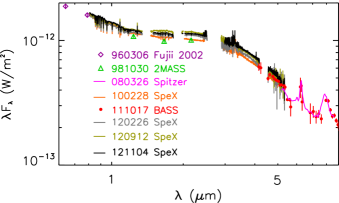
An important first step is to build the SED of V1247 Ori in the relevant near- to mid-infrared regime. For this purpose, we employed the SpeX spectrograph (1–5 m; Rayner et al., 2003) and The Aerospace Corporation’s Broad-band Array Spectrograph System (BASS; 3–14 m), which are mounted at NASA’s Infrared Telescope Facility (IRTF). The observing dates and observing modes are summarized in Table 1, together with our other observations.
The SpeX spectra were recorded using the echelle grating in both short-wavelength mode (SXD, 0.8–2.4 m) and long-wavelength mode (LXD, 2.3–5.4 m) using a 0.8″ slit. The spectra were corrected for telluric extinction and flux calibrated against the calibrator star HD 34203 (catalog ) using the Spextool data reduction package (Vacca et al., 2003; Cushing et al., 2004). In addition to the 0.8″-slit spectra, we also recorded data with a wide 3″ slit, which allows us to retrieve the absolute flux levels. V1247 Ori was observed six times in total with SpeX (see Table 1), allowing us to detect possible mid-infrared variability.
Our BASS short-wavelength (2.9–6 m) and long-wavelength (6–13.5 m) observations cover the full , , and bands with a spectral resolution ranging from about 30 to 125. For extracting the BASS data, we used the Spextool data reduction package. The calibrator star was HD 29139 (catalog ).
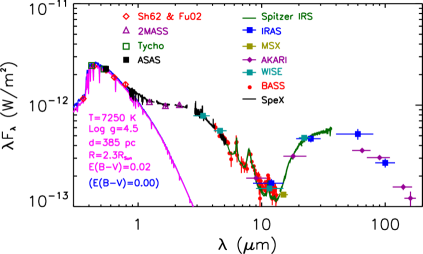
The photometry was taken from the compilation by Caballero (2010), which contains measurements from Sharpless (1962), Fujii et al. (2002), the Infrared Astronomical Satellite (IRAS, Helou & Walker, 1988), the Midcourse Space Experiment (MSX, Egan et al., 2003), and the Akari observatory (Ishihara et al., 2010). In addition, we added band photometry from 2MASS (Skrutskie et al., 2006). Besides the ASAS -band data published in Caballero (2010), no new ASAS observations are available. The Spitzer IRS data were obtained from the Spitzer heritage Archive Post-Basic Calibrated Data (PBCD). All spectra were low resolution spectra, with the deviant end points of each spectral segment trimmed off. The resulting SED is shown in Fig. 1.
2.2. KI near-infrared interferometry
The Keck Interferometer allowed us to resolve the distribution of the hot ( K) circumstellar material around V1247 Ori, forming an effective projected baseline length of 70.1 m towards position angle (PA, measured East of North) 27∘. The observation was conducted on 2011 November 5 and used the ASTRA beam combination instrument (Pott et al., 2009) in its self-phase-referencing mode (V2-SPR), covering the full band with spectral resolution . The science target observations were accompanied by observations of the calibrator stars HD 41794 (catalog ) and HD 37331 (catalog ), which allowed us to correct for atmospheric and instrumental effects. For the calibrator sizes we adopt uniform disk (UD) diameters of milliarcsecond (mas) for HD 41794 (computed with ASPRO) and mas for HD 37331 (computed with ASPRO).
From these observations, we derived a spectrum as well as wavelength-differential visibilities and phases. However, neither the spectrum nor the interferometric observables show any significant spectral features or wavelength-differential features. Therefore, we use only the recorded broadband visibility information for the modeling described in the following sections.
2.3. VLTI/AMBER near-infrared interferometry
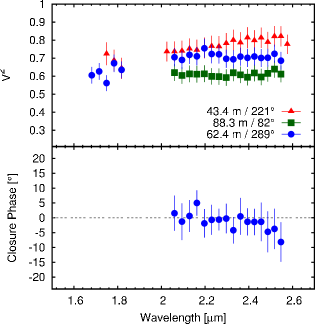
Additional NIR long-baseline interferometric observations were obtained on 2011 December 9 with the AMBER instrument (Petrov et al., 2007), improving the -plane coverage of the KI interferometry. Using the VLTI 8.2 m unit telescope (UT) triplet UT2-UT3-UT4, the observations sample projected baseline lengths (position angles) of 43.4 m (221∘), 62.4 m (289∘), and 88.3 m (82∘). Using optical fibers, AMBER provides spatial filtering, resulting in an effective field-of-view of 60 mas. For the beam combination we used AMBER’s LR--mode, which provides a spectral dispersion of and covers wavelengths between 1.5 and 2.5 m (- and band). We recorded 5000 interferograms with an integration time of 26 ms for V1247 Ori and the calibrators HD 37331 (catalog ) and HD 36059 (catalog ) (UD mas, ASPRO). Data from another calibrator (HD 36811 (catalog )) were rejected, since this object was found to be a close binary system111Given that our companion detection for HD 36811 (catalog ) might be of interest for science programs on Am-type stars, we determined the binary parameters and obtained a separation mas with position angle PA= (epoch 2011-12-09) and flux ratio in the / band..
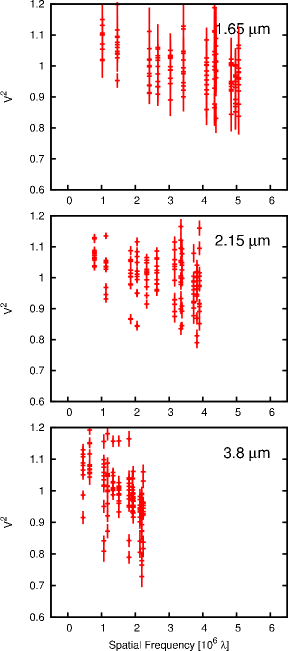
From the data we extract wavelength-dependent visibilities and closure phases using the amdlib software (Release 3; Tatulli et al., 2007; Chelli et al., 2009). In order to minimize the effect of residual telescope jitter, we follow the standard AMBER data reduction procedure and select the interferograms with the 10% best signal-to-noise ratio. In addition, we reject scans where the optical path delay exceeds 4 m. The wavelength calibration was done using the telluric absorption bands between the / and / band (see Appendix A in Kraus et al., 2009b). The final calibrated observables are shown in Fig. 2.
2.4. VLTI/MIDI mid-infrared interferometry
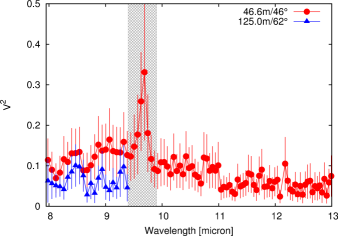
Our mid-infrared long-baseline interferometric observations were obtained with the VLTI/MIDI instrument (Przygodda et al., 2003). The employed telescope baselines were UT2-UT3 (2011 December 11, m, PA=) and UT1-UT4 (2011 December 12, m, PA=), i.e. probing similar position angles, but significantly different spatial frequencies. The observations on V1247 Ori were bracketed with observations of the calibrator star HD 39400 (UD mas, computed using CalVin).
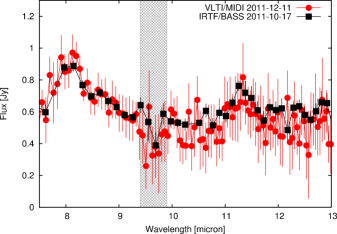
In order to extract the mid-infrared correlated fluxes, we employ the MIA+EWS-assisted (Jaffe, 2004; Leinert et al., 2004) faint-source reduction procedures described in Kishimoto et al. (2011). Together with the MIDI interferograms, we also recorded photometry files on the science star and calibrator, which allowed us to retrieve the absolute flux photometry. Comparing the MIDI total flux spectrum with a BASS spectrum recorded two months earlier (Fig. 3) reveals that the spectra are fully consistent within the measurement uncertainties and we find no indications for mid-infrared flux variability. Therefore, we decided to use the BASS spectrum in order to convert the measured correlated fluxes to visibility amplitudes (Fig. 4).
The wavelength range covered by MIDI contains also two hydrocarbon features (Sect. 3.2). However, we detect no significant change in the visibility at the wavelength of these organic bands (Fig. 4), suggesting that the hydrocarbon grains are located on similar spatial scales as the optically thin dust grains. However, observations with shorter baselines and with higher signal-to-noise ratio will be required for a detailed quantiative analysis.
2.5. Gemini/T-ReCS mid-infrared speckle interferometry
Our MIDI observations show that V1247 Ori is already strongly resolved on the shortest VLTI UT baseline ( m), indicating the presence of an extended emission component that is not properly constrained by our long-baseline interferometric observations. Therefore, we conducted complementary observations using the T-ReCS mid-infrared imager (Telesco et al., 1998; De Buizer & Fisher, 2005) that is mounted on the Gemini/South 8.2 m telescope. Employing short integration times of 0.2 s and a speckle interferometry analysis approach allow us to effectively freeze the atmospheric perturbations and to extract interferometric visibilities and phases for effective baseline lengths m that can be directly combined with our long-baseline interferometric data. The data were recorded on UT 2012 November 23 under exceptional atmospheric conditions using the T-ReCS narrowband filters Si-2 (m, m, where denotes the central wavelength of the filter and the spectral bandwidth), Si-3 (m, m), and Si-5 (m, m). Compared to the other two channels, the Si-3 data exhibit a reduced signal-to-noise ratio, reflecting the low flux of the object at this wavelength and the presence of the atmospheric ozone absorption bands. As a calibrator star, we employed HD 36167 (catalog ).
The power spectrum analysis method is described in more detail in Eisner et al. (2009). Speckle observations in the mid-infrared are rather sensitive to variations in the thermal background, which can potentially induce a bias in the absolute visibility level. In order to correct this problem, we renormalize the measured visibility profiles on the shortest spatial frequencies.
The derived 2-D visibilities show consistently an object elongation (Fig. 5) that we will further quantify in Sect. 3.3.1 using model-fitting techniques. The validity of this elongation is also confirmed by the fact that the T-ReCS data were recorded with deactivated field rotator, which would introduce a significant PA rotation in the derived 2-D visibilities for any telescope-induced artefacts.
2.6. Keck-II/NIRC2 near-infrared aperture masking
Using spatial filtering by single-mode fibers, our AMBER observations are insensitive to structures located at separations larger than mas from the central star. In order to probe larger spatial scales, we employed aperture masking observations with the Keck-II 10 m telescope and the NIRC2 instrument. Using a non-redundant 9-hole pupil mask allows us to derive high-precision interferometric phases that are well-suited to search for faint companions. The observations were conducted on 2012 January 8 and 10 with an integration time of 1 s and with the adaptive optics loop closed. The observations on 2012 January 8 were conducted under excellent atmospheric conditions using a -band (1.96–2.29 m) filter. We executed an observing sequence of four target-calibrator pairs with a total on-source integration time of 960 s. On January 10, four additional sequences were recorded using an -band (1.5-1.8 m), -band (3.43-4.13 m), and again a -band filter. The observed calibrator stars were HD 37331 (catalog ) ( band), HD 37634 (catalog ) (/ band), and HD 38406 (catalog ) (/-band).
2.7. Archival HARPS visual spectroscopy
Given the considerable uncertainties on the spectral type of V1247 Ori, we obtained HARPS high-resolution spectra from the ESO archive. The 37 exposures were reduced with the HARPS DRS pipeline v3.0 and provide a resolution . The data were recorded between 2008-11-11 and 2008-11-13 in the course of a radial velocity survey (ESO program ID 082.D-0833(A), PI: Boehm). Based on this original science objective, the data were recorded without associated telluric calibrators. Therefore, we were not able to remove atmospheric features and thus focused our analysis on the spectral regions around 380-460 nm and around the H line, which suffers only from very weak telluric contamination. The individual spectra were averaged and the continuum-level was then normalized by fitting a higher-order polynomial.
3. Results
3.1. Spectral classification
| Parameter | Unit | Value | |
|---|---|---|---|
| Effective temperature | K | 7250 | |
| Gravity | cm s-2 | 4.5 | |
| Metallicity | [M/H] | -0.5 | |
| Microturbulent velocity | km s-1 | 2 | |
| Rotation velocity | km s-1 | 60 | |
| Enhancement parameter | [/Fe] | 0 | |
| Distance | pc | ||
| Age | Myr | ||
| Mass | |||
| Stellar radius | |||
| Radial velocity | km s-1 |
Note. — For details about the individual parameters and how they have been derived, we refer the reader to Sect. 3.1. The radial velocity has been converted to the heliocentric system.
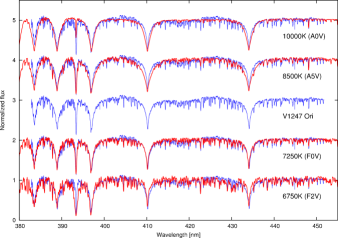
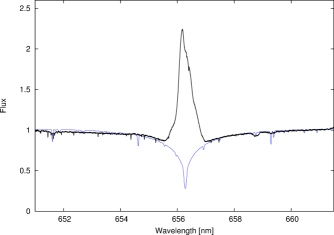
In the literature, an unusually wide range of spectral types has been assigned to V1247 Ori, ranging from F0V (Vieira et al., 2003) to A5III (Schild & Cowley, 1971). This has motivated us to re-evaluate the spectral classification by fitting the HARPS spectrum with the synthetic spectra in the library of Munari et al. (2005), which covers photospheres over a wide range of values for effective temperature , gravity , metallicity [M/H], microturbulent velocity , rotation velocity , and [/Fe] enhancement. For a detailed description of the parameters and the grid properties, we refer the reader to Munari et al. (2005). The range of possible rotation velocities is rather coarsely sampled in the original grid. Therefore, we employed the unbroadened spectra and convolved them with the line spread function for a limb-darkened rotating photosphere. Our new grid samples the rotation velocity with a resolution of 10 km s-1. We selected the best-fit model based on the -value and list the best-fit parameters in Tab. 2. These parameters correspond to a spectral type F0V (based on the table provided by Kurucz 1993), which confirms the classification by Vieira et al. (2003). Fig. 8 shows the V1247 Ori HARPS spectrum (blue curve) overplotted with the best-fit template spectrum (labeled F0V) and template spectra for stars of spectral type A0V ( K, cm s-2), A5V ( K, cm s-2), and F2V ( K, cm s-2).
As distance for V1247 Ori we adopt pc, which is the value determined by Caballero (2008) and Terrell et al. (2007) for other members of the Alnilam cluster. From the distance and the apparent V-band magnitude ( mag Caballero, 2010), we derive the absolute magntiude ( mag). Using the colour excess (E(B-V)=0.02, Vieira et al., 2003), and a bolometric correction for a F0V star (BC; assuming an age of 6.3 Myr and a mass of 1.9 ; Bressan et al. 2012), we estimate the bolometric luminosity to . The radius has then been derived to using the relation , where is the Stefan-Boltzmann constant.
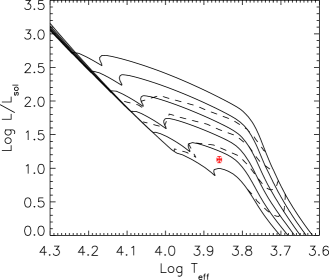
Using the pre-main-sequence evolutionary tracks from Bressan et al. (2012, PARSEC release V1.0), we estimate the mass of V1247 Ori to M☉, with an age of Myr (Fig. 9). The quoted statistical error bars have been derived assuming the aforementioned luminosity uncertainties and an uncertainty of 100 K on the effective temperature, but do not include systematic uncertainties that might be associated with the calibration of the stellar evolutionary models. The derived age is consistent with the age of the Alnilam cluster (5-10 Myr, Caballero & Solano, 2008).
3.2. Spectral energy distribution, line emission identification, and variability
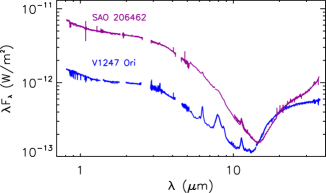
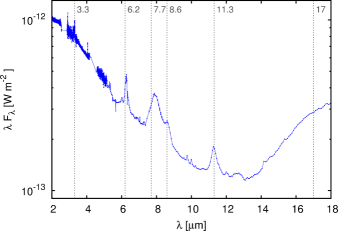
The SED of V1247 Ori shows remarkable similarities with the SED of other stars with pre-transitional disks, such as HD 135344B (catalog ) (=SAO 206462, Grady et al., 2009; Sitko et al., 2012) or HD 169142 (catalog ) (Grady et al., 2007; Panić et al., 2008; Honda et al., 2012), including a strong infrared excess emission with a significant flux depression in the 3–15 m mid-infrared wavelength regime compared to classical T Tauri disks (Fig. 10). These spectral characteristics are often interpreted as evidence for a gapped disk structure, where the near-infrared (m) emission is attributed to coming from a hot inner disk and the mid-infrared (m) emission to colder material in the outer disk.
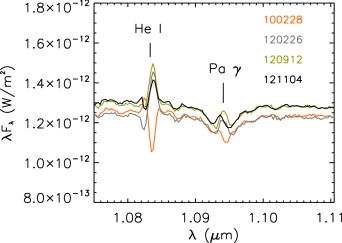
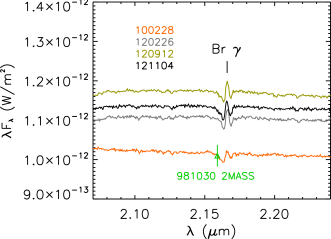
In the band, no lines corresponding to the CO overtone (, around 2.3 m) or He I (2.058 m) have been detected. However, our spectra show some extremely strong emission line components around 3.3, 6.2, 7.7, 8.6, and 11.3 m (Fig. 11), which we identify as hydrocarbon-related features (sometimes incorrectly referred to in the literature as polycyclic aromatic hydrocarbon (PAH) features, e.g. van Diedenhoven et al. 2004). We also detect accretion-tracing spectral lines, including H (Fig. 12), He I, Pa, and Br (Fig. 13), which are superposed on the underlying photospheric component. The equivalent width of H is -0.295 nm and -1.006 nm after we correct for the strong underlying photospheric absorption component (Fig. 12). The H-line profile is slightly asymmetric with a weak redshifted absorption component, showing a similar morphology as predicted by magnetospheric accretion models for disks seens closer to edge-on than face-on (Muzerolle et al., 1998).
The Br line is rather weak, but shows significant variability, which is most evident between our epoch in 2010 and the three epochs in 2012 (Fig. 13). This variability in Br seems to be correlated with the Pa and He I-line luminosity (Fig. 13, top), where He I even switches from absorption to emission between 2010 February 28 and 2012 February 26. Furthermore, there appears to be a correlation between the equivalent width of the Br line and NIR continuum infrared excess (Fig. 13, bottom).
Our multi-epoch spectro-photometric data from visual to MIR wavelengths are overplotted in Fig. 14 (and in Fig. 3 for our MIDI and BASS spectra), revealing significant variability, which seems to have the strongest amplitude (15%) in the band, with a calibration uncertainty of 5%. Given that the amplitude of the continuum variability seems to peak in the band and decreases both towards shorter and longer wavelength, we consider it most likely that the origin of the variability is associated with the inner disk, possibly with rotation-induced projection effects, as discussed in Sect. 4. Photometric and/or spectroscopic variability has also been found for other (pre-)transitional disks (e.g. Muzerolle et al., 2009; Espaillat et al., 2011; Sitko et al., 2012; Flaherty et al., 2012).
3.3. Spatially resolved constraints on the gapped disk structure
3.3.1 Geometry of the outer disk and gap region
| Geometry | FWHM | PA | |||
|---|---|---|---|---|---|
| [m] | [mas] | [mas] | [∘] | [∘] | |
| GAUSS | 8.8 | ||||
| GAUSS | 9.7 | ||||
| GAUSS | 11.7 | ||||
| RING | 8.8 | ||||
| RING | 9.7 | ||||
| RING | 11.7 |
Our T-ReCS speckle observations resolve the disk structure at mid-infrared wavelengths of 8.7, 9.7, and 11.7 m. Providing a complete two-dimensional -plane coverage to baseline lengths of m, these data are perfectly suited to constrain the geometry of the large-scale disk and to determine the disk orientation and inclination angle. A visual inspection of the six independent power spectra (Fig. 5) reveals a significant elongation along PA (corresponding to an orientation of the disk major axis along PA). In the power spectra for the Si-3 filter, this elongation pattern is superposed with another weaker signature, resulting in an approximately cross-shaped power spectrum (Fig. 5, middle row). Given that this pattern appears only the in Si-3 data set, which has the lowest SNR due to the atmospheric ozone absorption, we consider it likely that this signature is caused by instrumental artefacts, such as wind-induced vibration in the telescope. In the probed high-visibility regime (), the visibility profile is rather insensitive to the detailed brightness distribution, which allows us to derive the disk orientation and inclination using a simple elliptical Gaussian model, without taking the inner disk structure into account. The models include a photospheric flux component, although the contributions from this spatially unresolved component are practically neglible (% based on our SED decomposition).
The aim of our Gaussian model fitting is to quantify the elongation that is present in the 2-D power spectra (Fig. 5). Using a Levenberg-Marquardt -minimization algorithm, we determine the best-fit full width half maximum (FWHM), the position angle of the major axis of the elliptical Gaussian (PA), and the inclination angle (). We performed the fit for each of our wavelength bands independently and we estimate the parameter uncertainties for each wavelength band from the scatter between our two independent measurements. The determined parameters are listed in Tabble 3 and consistently show an elongation along position angle PA= with an inclination angle (i.e. closer to face-on). The Gaussian model provides a very simple and robust estimation for the elongation of the MIR emission component, but does not take the additional information provided by the MIDI data into account, which reveals the presence of a compact spatial component.
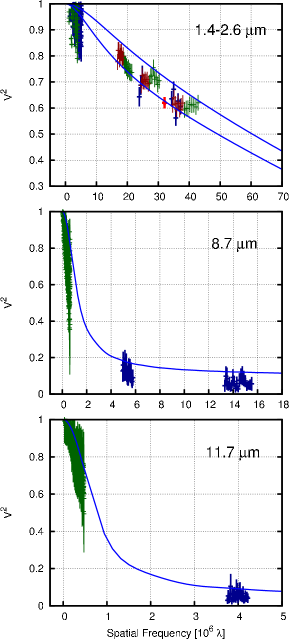
The choice for the second model geometry (elliptical ring + unresolved component) is motivated by our combined MIDI+T-ReCS data set, which shows that the visibility function at wavelengths of 8.7 m drops significantly at short baselines ( at m), but then stays rather constant at a level of from 46 m to 125 m (Fig. 15, 3rd panel from top). It is important to note that this visibility profile is substantially different from the ones observed towards classical T Tauri or Herbig Ae/Be stars (e.g. Kraus et al., 2008) and provides model-independent evidence for the presence of two spatial components, namely an extended component (which we represent with a ring geometry) and a compact component that is only marginally resolved even at hectometric baseline lengths. Denoting the flux contributions of the ring component with , the flux of the unresolved component with , the total measured visibility will be given by , where is the visibility profile of the ring component. At long baselines (where the extended component is overresolved, i.e. ), will converge towards . According to our MIDI measurements, this convergence value is , which leads us to fix in our model. The fractional width of the ring has been fixed to . The best-fit parameters are listed in Tab. 3, where we denote the best-fit ring radius with .
This two-component model yields our best estimate for the disk inclination angle () and disk position angle (PA=). The existing Keck and VLTI long-baseline interferometric observations are not able to further constrain these parameters, but provide highly complementary constraints on the detailed object geometry, as will be discussed in the following sections.
3.3.2 Geometry of the inner disk
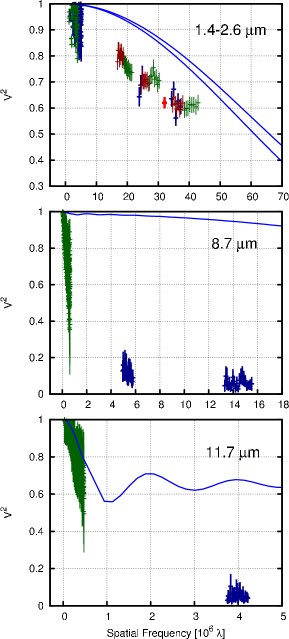
Our AMBER+ASTRA interferometric observations trace a compact emission component with a characteristic size of mas at 2 m (ring radius), assuming a ring with fraction width of 20%, as adopted, for instance, by Monnier & Millan-Gabet 2002. This is more than 80 times smaller than the extended MIR component seen by our MIDI+T-ReCS MIR observations (79 mas at 12 m). With measured squared visibilities down to , the emission is clearly resolved both in the and bands. The visibility level drops slightly towards shorter wavelengths (Fig. 2, second panel from top). However, when plotted against spatial frequency (Fig. 15, 2nd panel from top), the visibilities at all wavelengths follow the same visibility function. This indicates that the visibility drop simply reflects the increase in angular resolution towards shorter wavelengths, but not a temperature gradient in the emitting structure, nor the presence of an optically thick inner gaseous emission component, such as observed in the disks around some Herbig Ae/Be stars (Eisner et al., 2007; Kraus et al., 2008; Isella et al., 2008). We also do not find any indications for an extended NIR scattered-light halo, such as observed for Herbig Ae/Be stars like R CrA (Kraus et al., 2009a).
Unfortunately, the current -coverage of the AMBER+ASTRA observations is not sufficient to measure the inclination angle of the inner disk independently. Therefore, we assume in our following modeling that the inner disk is coplanar to the outer disk.
The characteristic size of the NIR-emitting region (ring radius mas or AU at pc) is significantly larger than the expected size of the dust sublimation radius (0.085 AU) as computed for black dust properties (cooling efficiency ; sublimation temperature 1500 K) using Eq. 12 in Dullemond & Monnier (2010), which includes back-warming effects. In Sect. 3.4.2, we suggest that this increased NIR size is due to contributions from optically thin material located at larger stellocentric radii. Alternatively, it would be possible to reconcile the measured and expected sizes by assuming a population of smaller dust grains with cooling efficiency .
The closure phases measured with AMBER are zero within the uncertainties of (Fig. 2), which is consistent with a centro-symmetric brightness distribution on scales of mas ( AU).
3.3.3 Asymmetric structures in the gap region
| Spectral | PA | ||
|---|---|---|---|
| band | [mag] | [mas] | [∘] |
Measuring closure phases with sub-degree accuracy, our NIRC2 aperture masking observations are sensitive to asymmetries in the brightness distribution on angular scales well below the diffraction limit of the 10 m Keck telescope. The data reveal non-zero phases in all three wavelength bands, with varying significance levels. In order to explore the origin of these asymmetries, we fit a star+companion model to our data, where we treat the three wavelength filters separately. The error estimation and detection limits in our code have been carefully tested and fine-tuned in various earlier studies (e.g. Kraus et al., 2011; Kraus & Ireland, 2012). The fitting results are summarized in Tab. 4, while the corresponding best-fit phase plots and -maps are shown in Fig. 7.
The -band data provides convincing evidence for the detection of a companion at a separation of ″ from the star and towards PA=. With more than , the detection is comparable to the significance level of other companion detections around transitional or pre-transitional disks with the aperture masking technique. From the brightness ratio ( mag) and the 2MASS -band magnitude ( mag), we estimate the absolute magnitude of this potential companion to mag for a distance of pc. Based on the evolutionary models from Baraffe et al. (1998), we estimate the mass to at 6 Myr.
Fitting our companion model to the and -band data yields detections at or more. However, for the following reasons, these detections are in conflict with the companion interpretation of the -band detection:
-
1.
The companion positions in the and -band best-fit model deviate significantly from the position derived from the -band data (Tab. 4).
-
2.
At the location of the -band detection, we obtain non-detections with magnitude limits of mag and mag. These upper limits place strong constraint on the color of the putative companion, yielding an unrealistic red color of mag compared to the star+inner disk system. For a companion, we would expect to detect the companion with a color of mag. Therefore, in order to reconcile the companion scenario with the color constraints, we would have to assume that the color of the companion is reddened by inner disk shadowing and/or that the phase signal in the other bands is reduced by contamination due to disk emission.
-
3.
For the -band data, we find several solutions (Fig. 7, bottom right), indicating that the companion model is not a good representation of the true object morphology.
We interpret this as strong evidence that the measured asymmetries do not trace a single point-source, but distinct asymmetric structures on different spatial scales. The model fits suggest that these asymmetric structures are located on spatial scales of 40–110 mas (Tab. 4) or 15–40 AU, i.e. within the gap region. This interpretation is in line with our disk model (Sect. 3.4.2), which predicts that the optically thin gap material contributes a significant fraction of the -, -, and -band emission (Fig. 16, top panel). Any inhomogenities in the distribution of this optically thin gap material introduces asymmetries that appear as a non-zero phase signal in aperture masking data, mimicking a companion signal. For complex disk structures, such as spiral arms, the amplitude and direction of the asymmetry changes with wavelength, as different wavelengths are sensitive to emission from different stellocentric radii. The non-zero phases measured by our aperture masking data likely trace such asymmetric structures in the disk gap. Given its limited angular resolution, our aperture masking data is not able to constrain the detailed spatial structure of these asymmetric features, although this should become feasible with future long-baseline interferometric aperture synthesis imaging observations.
3.4. Multi-wavelength interferometry + SED modeling of the disk structure
In order to constrain the disk geometry quantitatively, we combine in this section our SED and NIR+MIR interferometric data and fit it using a model of a geometrically thin dust disk. Our model assumes that the intensity at each surface element in the disk can be described as
| (1) |
where is the Planck function and is the temperature at the considered disk radius, and is the optical depth, which is related to the surface density and the dust opacity at frequency with . The radial dust temperature is computed based on the thermal balance between stellar heating and radiative cooling using the relation presented by Dullemond & Monnier (2010). This approach provides a first-order approximation of the intensity profile, sufficient for our purposes, but does not take the vertical disk structure, nor shadowing effects (e.g. Espaillat et al., 2010) into account. These effects should be constrained in future studies using a more sophisticated multi-dimensional radiative transfer and hydrodynamics simulation approach. Assuming a point-symmetric brightness distribution, the model is also not able to reproduce the asymmetries that we have detected with our aperture masking observations (Sect. 3.3.3). For the dust properties we use opacities for silicate and carbon (graphite) grains by Draine & Lee (1984) and mixtures of these grain species. We adopt the grain size distribution from Mathis et al. (1977), but tested also grains with a single grain size.
Given our earlier, model-independent indications for an inner and outer disk component (Sect. 3.3.2), we divide the disk into three regions, namely the inner disk (ID, extending from ), the gap region (), and the outer disk (OD, extending from ), where , , , and are treated as free parameters. For the inner and outer disk, we fix the surface density to an (arbitrary) very high value, ensuring that the emission is optically thick. The surface density in the gap region is treated as a free parameter with a flat surface density profile ( = const.), as motivated by hydrodynamic simulations of gaps in protoplanetary disks (e.g. Kley, 1999; Zhu et al., 2011). The model is fitted simultaneously to the SED and the interferometric data and the five aforementioned parameters are fitted using a least-square minimization process. In order to avoid local minima, we vary the initial parameters systematically on a grid. Given the heterogeneous sampling of the SED, we binned the spectroscopic and photometric data on an equidistant grid in logarithmic wavelength space. In the fitting process, the VLTI/AMBER, KI/ASTRA, Keck-II/NIRC2, VLT/NIRC2, VLTI/MIDI, and Gemini/T-ReCS data are attributed the same weight.
In addition, our model includes the stellar photosphere, which we represent with the recommended SYNTHE model for a F0V star (, K, Kurucz, 1993) We compute the flux ratio between the photospheric and circumstellar emission for each wavelength channel separately, yielding values from 45% at m, 21% at 1.9 m, to 12% at 2.5 m.
3.4.1 Inner & outer disk (ID+OD model)
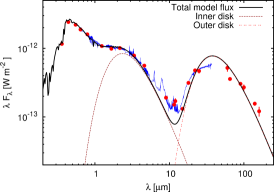
A visual inspection of the SED (Fig. 1) suggests that two simple blackbody components might be sufficient to fit the full SED. Therefore, in a first modeling attempt, we include only two optically thick emission components, without emission from inside the gap (). A standard dust mixture of 50% silicate + 50% carbon was used for this model.
The resulting best-fit is shown in Fig. 15 and can reproduce the SED at NIR and far-infrared wavelengths reasonably well, even though it underestimates the flux in the MIR regime. The corresponding parameters are listed in Tab. 5.
We find that this model results in much too high MIR visibilities, indicating that the MIR-emitting structure in the model is too compact. Improving the fit cannot be achieved by extending the inner disk (), since this would result in a conflict with the NIR visibilities. Increasing , on the other hand, changes the shape of the NIR excess and leads to an inconsistent MIR SED, suggesting that the optically thick inner disk is very narrow.
The main inadequacy of the ID+OD model is its failure to reproduce the measured low MIR visibilities, indicating that this model lacks an emission component on spatial scales at least one order of magnitude larger than the inner disk. Therefore, we investigated whether parts of the outer disk might be able to contribute extended MIR emission, for instance from a vertically extended wall located at the inner truncation radius of the outer disk. In order to reproduce the MIR visibilities, this emission has to originate from stellocentric radii AU, while temperatures K are required in order to contribute significant amounts of thermal emission in the 8 to 13 m wavelength regime. However, we were not able to find a physical scenario that would allow us to achieve such high temperatures at the required stellocentric radii of AU. For black dust properties (), the expected temperatures at 46 AU are K. This conflict cannot be resolved by adopting small grain species, such as m-sized carbon grains (), where the temperature would still be only K. Therefore, we conclude that the discrepancies of the ID+OD model cannot be improved by changing the structure of the outer disk. This conclusion is also consistent with the finding from earlier SED-based studies (e.g. D’Alessio et al., 2005; Espaillat et al., 2010) that investigated the detailed vertical structure of the outer disk wall of stars in Taurus and Ophiuchus and found that its contribution shortwards of 20 m are negligle.
3.4.2 Inner & outer disk with optically thin gap material (ID+GapMaterial+OD model)
| Parameter | ID+OD | ID+GapMaterial+OD | ||
|---|---|---|---|---|
| Inner Disk, inner radius | [AU] | 0.19 | 0.18 | |
| Inner Disk, outer radius | [AU] | 0.34 | 0.27 | |
| Outer Disk, inner radius | [AU] | 44 | 46 | |
| Outer Disk, outer radius | [AU] | 85 | 85 | |
| Dust surface density in gap | [gcm-2] | 0 | ||
| 73.5 | 3.0 | |||
| 3.8 | 1.7 | |||
| 65.6 | 2.8 |
Note. — denotes the reduced likelihood estimator for the visibility data, as defined in Kraus et al. (2009a, equation 1). is defined equivalent for the SED data and for the fit to the combined visibility and SED dataset.
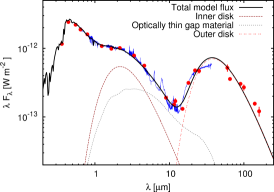
As a second scenario, we consider that the gap might not be completely depleted of material, but filled with optically thin dust. For this purpose, we vary both the surface density and the dust properties.
Our best-fit model is shown in Fig. 16 and includes carbon dust grains (Draine & Lee, 1984) with a MRN-type grain size distribution (Mathis et al., 1977). The dust mineralogy is constrained both by the absence of a 10 m silicate feature and the shape of the SED, in particular the very sharp flux minimum around m (Fig. 1). We find that small silicate grains are not compatible with our observations, since they result in a strong silicate feature. Large silicate grains, on the other hand, result in too much excess emission at wavelengths m. A carbon dust composition with an MRN grain size distribution allows us to achieve a good fit with a (Table 5).
Compared to the ID+OD model, the NIR emission contains here contributions both from the inner disk and from the optically thin dust in the gap region, which results in lower visibilities and, at the same time, a more shallow visibility profile, providing a significantly better fit to the measured and -band visibilities (second panel from top in Fig. 15 and 16). The improvement is even more significant at MIR wavelengths, where the -band flux in the ID+OD model is dominated by contributions from the inner and outer disk (resulting in much too compact emitting structures at 8.7 m and 11.7 m; third and fourth panel from top in Fig. 15), while in the ID+GapMaterial+OD model, they are dominated by optically thin material located in the gap region, resulting in a much better respresentation of the MIDI and T-ReCS visibilities (Fig. 16).
4. Discussion
Our study provides spatially resolved constraints on the structure and physical conditions in a pre-transitional disk (Fig. 17), enabling new insights on the disk clearing mechanism in these objects. We localize a narrow ring of hot material at the expected location of the dust sublimation radius, which rules out mechanisms that clear the disk in an inside-to-outside fashion, such as photoevaporation (e.g. Alexander & Armitage, 2007), magnetorotational instabilities (Chiang & Murray-Clay, 2007), or grain growth (Dullemond & Dominik, 2005; Birnstiel et al., 2012). On the other hand, the observed disk structure supports theories for dynamical disk clearing by planetary- or sub-stellar-mass companions, which might be responsible both for the gap-opening and for inducing the detected disk asymmetries. Our NIRC2 and AMBER observations rule out the presence of stellar-mass companions on scales from mas to a few arcseconds, with brightness ratios up to (corresponding to companion masses of ), but cannot rule out a very close spectroscopic companion. However, such a close stellar-mass companion would like also distort the inner disk, either by truncation or by causing asymmetries, that have not been observed by our AMBER data.
One of the main results from our study is the detection of significant amounts of optically thin material located within the disk gap. SED-based models of several transitional disks also included an optically thin component, although in those cases the component has been introduced primarily to reproduce spectral features, such as the silicate feature (e.g. TW Hya (catalog ), Calvet et al. 2002; LkCa 15 (catalog ), Espaillat et al. 2011). Such spectral features are not present in our V1247 Ori spectra and we require the optically thin component in order to reproduce the MIR continuum visibilities. We find that this component even dominates at MIR wavelengths, which is in contrast to HD 100546 (catalog ) (Benisty et al., 2010; Tatulli et al., 2011) and TW Hya (catalog ) (Ratzka et al., 2007; Akeson et al., 2011), the other transitional/pre-transitional disks that have been extensively studied with infrared interferometry before. No optically thin gap material was found in these objects, possibly indicating that TW Hya and HD 100546 are already in an later stage of gap clearing and/or grain growth than V1247 Ori. Adopting the dust opacities by Draine & Lee (1984), we could achieve no satisfactory fit with silicate dust grains, but require a carbon-dominated dust mineralogy for the optically thin material located in the disk gap region. Of course, this conclusion depends to some degree on the adopted dust properties and future studies might test also other grain species.
It remains an open question, how this carbon-overabundance has developed, but it is interesting to note that studies on the Pictoris planetary system have also revealed a carbon-rich composition of the debris material (Roberge et al., 2006). Also, carbon-rich planets have been predicted by theoretical studies (Seager et al., 2007) and indications for a carbon-rich interior have already been found for the super-earth 55 Cancri e (catalog ) (Madhusudhan et al., 2012).
Using Keck/NIRC2 aperture masking observations, we measured strong non-zero phase signals, indicating small-scale asymmetries in the brightness distribution. Similar phase signals have been observed on several other transitional and pre-transitional disks (e.g. CoKu Tau/4 (catalog ): Ireland & Kraus 2008; T Cha (catalog ); Huélamo et al. 2011; LkCa 15 (catalog ): Kraus & Ireland 2012; HD142527 (catalog ): Biller et al. 2012; FL Cha (catalog ): Cieza et al. 2013) and have often been interpreted as signatures of a close companion. Fitting the -band data, we also obtain evidence for a close companion ( detection significance; Fig. 7, middle column). However, the direction and amplitude of the asymmetries changes with wavelength, which suggests that they are not caused by a close companion. We also rule out that the asymmetries might be caused by the heated wall of an inclined centro-symmetric disk, as proposed by Cieza et al. (2013), as such asymmetries would be consistently directed along the minor axis of the disk. Instead, our observations reveal more complex, radially extended structures, whose detailed geometry is not sufficiently resolved by our aperture masking observations. We speculate that the asymmetries might be caused by spiral-arm features, similar to the ones discovered with Subaru/HiCIAO coronagraphic observations in the pre-transitional disks of HD 135344B (catalog ) (Muto et al., 2012) and HD 36112 (catalog ) (=MWC 758, Grady et al., 2013) on larger angular scales. In both cases, the asymmetries might resemble spiral density waves that are induced by orbiting sub-stellar mass companions (Goldreich & Tremaine, 1979), although alternative scenarios, such as gravitational instabilities (e.g. Durisen et al., 2007) or accretion streams onto forming planets (e.g. Zhu et al., 2012) have also been proposed.
A major open question concerns the physical cause of the deep UX Ori-like occultation events that were reported by Caballero (2010). The detected two main events were separated by about 14 months and lasted for about two weeks each. Outsides these isolated events, the photometry of V1247 Ori was very stable on a level below 0.02 mag, which suggests that the occultations were not related to photospheric activity. Caballero (2010) proposed that the photometric events might be caused by disk material passing the line-of-sight, assuming that the disk is oriented close to edge-on. At first sight, this scenario seems in contradiction to our inclination measurement of ∘ (Sect. 3.3.1), suggesting that the disks is seen closer to face-on than edge-on. However, it should be noted that this estimate has been obtained at MIR wavelengths for the outer disk regions, while the -coverage of our NIR data is still insufficient to obtain an independent estimate for the inclination angle of the inner disk. Therefore, we are not able to rule out that the inner disk might be considerably inclined or warped with respect to the outer disk. Hypothetical planets on highly inclined orbits in the inner astronomical unit (Albrecht et al., 2012) might shepard, deform, and tilt the inner disk with respect to the outer disk (Muzerolle et al., 2009), which might result in the observed occultation events. Rotation-induced projection affects of this inclined disk might also be responsible for the detected continuum variability, which peaks at NIR wavelengths and appears on time scales of several months to years (Sect. 3.2), matching the orbital period of the inner disk. Alternatively, the occultation events might be related to the asymmetric structures that we have detected on scales of 15–40 AU, for instance through a large, vertically extended disk warp that intersects the line-of-sight to the stellar photosphere sporadously. However, both for time scale arguments and hydrodynamic arguments, we consider the aforementioned scenario, which relates the occultation events with the inner disk, more likely.
5. Conclusions
We have presented coordinated near- and mid-infrared interferometric observations of a star with a pre-transitional disk, which has allowed us to investigate the disk structure of one of these intriguing objects in unprecedented detail.
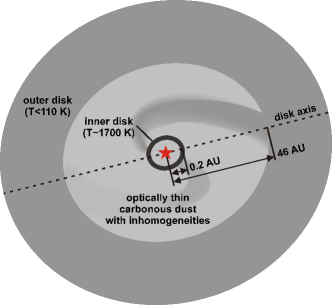
Our observations have targeted the previously sparsely studied pre-transitional disk around V1247 Ori and resolved a narrow, optically thick inner disk component located at 0.18 AU from the star, which dominates the near-infrared emission. This hot inner disk contributes less than 20% to the mid-infrared (8–13 m) regime, while the largest fraction arises from optically thin material located in the gapped disk region from to 46 AU. This strong mid-infrared continuum emission from carbonous dust grains located inside the gap region has not been predicted by the current class of SED-based disk models. Multi-wavelength interferometric observations on a larger sample of transitional and pre-transitional disks will be necessary to investigate how common this optical thin emission component occurs and whether it might be indicative of a particularly early stage of disk clearing. The organic bands (hydrocarbon features) originate from similar stellocentric radii as this optically thin material.
Our aperture masking observations reveal highly significant asymmetries in the -, -, and -band. The direction and amplitude of the asymmetries changes with wavelength, which leads us to reject a companion origin and to exclude that the asymmetries are induced by a heated disk wall, as proposed in the scenario by Cieza et al. (2013). Instead, we propose that the asymmetries are related to strong density inhomogenities in the gap region, possibly caused by the dynamical interaction of the gap material with the gap-opening body/bodies. Our results illustrate the highly dynamical and complex nature encountered in the inner gap regions and demonstrate the need for further high-angular resolution imaging studies. We would like to emphasize that the observed disk asymmetries can be easily misinterpreted as companion signals and multi-epoch, multi-wavelength studies are essential for ruling out false detections.
With a mass of , V1247 Ori is considerably more massive than other pre-transitional disks, approaching the intermediate-mass regime. Studying planet formation in such intermediate-mass systems (spectral type A or B) is particular interesting, as abundance studies suggest that the planet formation efficiency increases towards higher stellar masses (Johnson et al., 2007). Besides being more abundant than those around solar-type stars, giant planets around early-type stars appear to follow also a different major-axis distribution, with a significant deficit in the inner 1–2 AU, likely because of the different disk environments in which they formed. Multi-wavelength interferometric observations on V1247 Ori and other transitional disks now provide the exciting opportunity to study the very early evolutionary phases of such systems and to explore the impact of planet formation on the disk environment directly. Such observational evidence is essential to test planet formation theories and to link our knowledge of planet formation and disk evolution to the planetary system demographics observed in main-sequence systems.
References
- Akeson et al. (2011) Akeson, R. L., et al. 2011, ApJ, 728, 96
- Albrecht et al. (2012) Albrecht, S., et al. 2012, ApJ, 757, 18
- Alexander & Armitage (2007) Alexander, R. D., & Armitage, P. J. 2007, MNRAS, 375, 500
- Baraffe et al. (1998) Baraffe, I., Chabrier, G., Allard, F., & Hauschildt, P. H. 1998, A&A, 337, 403
- Benisty et al. (2010) Benisty, M., Tatulli, E., Ménard, F., & Swain, M. R. 2010, A&A, 511, A75
- Biller et al. (2012) Biller, B., et al. 2012, ApJ, 753, L38
- Birnstiel et al. (2012) Birnstiel, T., Andrews, S. M., & Ercolano, B. 2012, A&A, 544, A79
- Boss (2000) Boss, A. P. 2000, ApJ, 536, L101
- Bressan et al. (2012) Bressan, A., Marigo, P., Girardi, L., Salasnich, B., Dal Cero, C., Rubele, S., & Nanni, A. 2012, MNRAS, 427, 127
- Caballero (2008) Caballero, J. A. 2008, MNRAS, 383, 750
- Caballero (2010) —. 2010, A&A, 511, L9
- Caballero & Solano (2008) Caballero, J. A., & Solano, E. 2008, A&A, 485, 931
- Calvet et al. (2002) Calvet, N., D’Alessio, P., Hartmann, L., Wilner, D., Walsh, A., & Sitko, M. 2002, ApJ, 568, 1008
- Chelli et al. (2009) Chelli, A., Utrera, O. H., & Duvert, G. 2009, A&A, 502, 705
- Chiang & Murray-Clay (2007) Chiang, E., & Murray-Clay, R. 2007, Nature Physics, 3, 604
- Cieza et al. (2013) Cieza, L. A., et al. 2013, ApJ, 762, L12
- Cushing et al. (2004) Cushing, M. C., Vacca, W. D., & Rayner, J. T. 2004, PASP, 116, 362
- D’Alessio et al. (2005) D’Alessio, P., et al. 2005, ApJ, 621, 461
- De Buizer & Fisher (2005) De Buizer, J., & Fisher, R. 2005, in High Resolution Infrared Spectroscopy in Astronomy, ed. H. U. Käufl, R. Siebenmorgen, & A. Moorwood, 84–87
- Draine & Lee (1984) Draine, B. T., & Lee, H. M. 1984, ApJ, 285, 89
- Dullemond & Dominik (2005) Dullemond, C. P., & Dominik, C. 2005, A&A, 434, 971
- Dullemond & Monnier (2010) Dullemond, C. P., & Monnier, J. D. 2010, ARA&A, 48, 205
- Durisen et al. (2007) Durisen, R. H., Boss, A. P., Mayer, L., Nelson, A. F., Quinn, T., & Rice, W. K. M. 2007, Protostars and Planets V, 607
- Egan et al. (2003) Egan, M. P., et al. 2003, VizieR Online Data Catalog, 5114, 0
- Eisner et al. (2007) Eisner, J. A., Chiang, E. I., Lane, B. F., & Akeson, R. L. 2007, ApJ, 657, 347
- Eisner et al. (2009) Eisner, J. A., Monnier, J. D., Tuthill, P., & Lacour, S. 2009, ApJ, 698, L169
- Espaillat et al. (2007) Espaillat, C., Calvet, N., D’Alessio, P., Hernández, J., Qi, C., Hartmann, L., Furlan, E., & Watson, D. M. 2007, ApJ, 670, L135
- Espaillat et al. (2011) Espaillat, C., Furlan, E., D’Alessio, P., Sargent, B., Nagel, E., Calvet, N., Watson, D. M., & Muzerolle, J. 2011, ApJ, 728, 49
- Espaillat et al. (2010) Espaillat, C., et al. 2010, ApJ, 717, 441
- Flaherty et al. (2012) Flaherty, K. M., Muzerolle, J., Rieke, G., Gutermuth, R., Balog, Z., Herbst, W., Megeath, S. T., & Kun, M. 2012, ApJ, 748, 71
- Fujii et al. (2002) Fujii, T., Nakada, Y., & Parthasarathy, M. 2002, A&A, 385, 884
- Goldreich & Tremaine (1979) Goldreich, P., & Tremaine, S. 1979, ApJ, 233, 857
- Grady et al. (2007) Grady, C. A., et al. 2007, ApJ, 665, 1391
- Grady et al. (2009) —. 2009, ApJ, 699, 1822
- Grady et al. (2013) —. 2013, ApJ, 762, 48
- Guetter (1981) Guetter, H. H. 1981, AJ, 86, 1057
- Helou & Walker (1988) Helou, G., & Walker, D. W., eds. 1988, Infrared astronomical satellite (IRAS) catalogs and atlases. Volume 7: The small scale structure catalog, Vol. 7
- Honda et al. (2012) Honda, M., et al. 2012, ApJ, 752, 143
- Huélamo et al. (2011) Huélamo, N., Lacour, S., Tuthill, P., Ireland, M., Kraus, A., & Chauvin, G. 2011, A&A, 528, L7
- Ireland & Kraus (2008) Ireland, M. J., & Kraus, A. L. 2008, ApJ, 678, L59
- Isella et al. (2008) Isella, A., Tatulli, E., Natta, A., & Testi, L. 2008, A&A, 483, L13
- Ishihara et al. (2010) Ishihara, D., et al. 2010, A&A, 514, A1
- Jaffe (2004) Jaffe, W. J. 2004, in New Frontiers in Stellar Interferometry, Proceedings of SPIE Volume 5491., ed. W. A. Traub, 715–+
- Johnson et al. (2007) Johnson, J. A., Butler, R. P., Marcy, G. W., Fischer, D. A., Vogt, S. S., Wright, J. T., & Peek, K. M. G. 2007, ApJ, 670, 833
- Kishimoto et al. (2011) Kishimoto, M., Hönig, S. F., Antonucci, R., Millour, F., Tristram, K. R. W., & Weigelt, G. 2011, A&A, 536, A78
- Kley (1999) Kley, W. 1999, MNRAS, 303, 696
- Kraus & Ireland (2012) Kraus, A. L., & Ireland, M. J. 2012, ApJ, 745, 5
- Kraus et al. (2011) Kraus, A. L., Ireland, M. J., Martinache, F., & Hillenbrand, L. A. 2011, ApJ, 731, 8
- Kraus et al. (2009a) Kraus, S., Hofmann, K., Malbet, F., Meilland, A., Natta, A., Schertl, D., Stee, P., & Weigelt, G. 2009a, A&A, 508, 787
- Kraus et al. (2008) Kraus, S., Preibisch, T., & Ohnaka, K. 2008, ApJ, 676, 490
- Kraus et al. (2009b) Kraus, S., et al. 2009b, A&A, 497, 195
- Kurucz (1993) Kurucz, R. L. 1993, SYNTHE spectrum synthesis programs and line data
- Leinert et al. (2004) Leinert, C., et al. 2004, A&A, 423, 537
- Madhusudhan et al. (2012) Madhusudhan, N., Lee, K. K. M., & Mousis, O. 2012, ApJ, 759, L40
- Mathis et al. (1977) Mathis, J. S., Rumpl, W., & Nordsieck, K. H. 1977, ApJ, 217, 425
- Monnier & Millan-Gabet (2002) Monnier, J. D., & Millan-Gabet, R. 2002, ApJ, 579, 694
- Munari et al. (2005) Munari, U., Sordo, R., Castelli, F., & Zwitter, T. 2005, A&A, 442, 1127
- Muto et al. (2012) Muto, T., et al. 2012, ApJ, 748, L22
- Muzerolle et al. (1998) Muzerolle, J., Calvet, N., & Hartmann, L. 1998, ApJ, 492, 743
- Muzerolle et al. (2009) Muzerolle, J., et al. 2009, ApJ, 704, L15
- Paardekooper & Mellema (2004) Paardekooper, S.-J., & Mellema, G. 2004, A&A, 425, L9
- Panić et al. (2008) Panić, O., Hogerheijde, M. R., Wilner, D., & Qi, C. 2008, A&A, 491, 219
- Petrov et al. (2007) Petrov, R. G., et al. 2007, A&A, 464, 1
- Pollack et al. (1996) Pollack, J. B., Hubickyj, O., Bodenheimer, P., Lissauer, J. J., Podolak, M., & Greenzweig, Y. 1996, Icarus, 124, 62
- Pott et al. (2009) Pott, J.-U., et al. 2009, New Astronomy Reviews, 53, 363
- Przygodda et al. (2003) Przygodda, F., Chesneau, O., Graser, U., Leinert, C., & Morel, S. 2003, Ap&SS, 286, 85
- Quillen et al. (2004) Quillen, A. C., Blackman, E. G., Frank, A., & Varnière, P. 2004, ApJ, 612, L137
- Ratzka et al. (2007) Ratzka, T., Leinert, C., Henning, T., Bouwman, J., Dullemond, C. P., & Jaffe, W. 2007, A&A, 471, 173
- Rayner et al. (2003) Rayner, J. T., Toomey, D. W., Onaka, P. M., Denault, A. J., Stahlberger, W. E., Vacca, W. D., Cushing, M. C., & Wang, S. 2003, PASP, 115, 362
- Roberge et al. (2006) Roberge, A., Feldman, P. D., Weinberger, A. J., Deleuil, M., & Bouret, J.-C. 2006, Nature, 441, 724
- Schild & Cowley (1971) Schild, R. E., & Cowley, A. P. 1971, A&A, 14, 66
- Seager et al. (2007) Seager, S., Kuchner, M., Hier-Majumder, C. A., & Militzer, B. 2007, ApJ, 669, 1279
- Sharpless (1962) Sharpless, S. 1962, ApJ, 136, 767
- Sitko et al. (2012) Sitko, M. L., et al. 2012, ApJ, 745, 29
- Skrutskie et al. (2006) Skrutskie, M. F., et al. 2006, AJ, 131, 1163
- Strom et al. (1989) Strom, K. M., Strom, S. E., Edwards, S., Cabrit, S., & Skrutskie, M. F. 1989, AJ, 97, 1451
- Tatulli et al. (2007) Tatulli, E., et al. 2007, A&A, 464, 29
- Tatulli et al. (2011) —. 2011, A&A, 531, A1
- Telesco et al. (1998) Telesco, C. M., Pina, R. K., Hanna, K. T., Julian, J. A., Hon, D. B., & Kisko, T. M. 1998, in Society of Photo-Optical Instrumentation Engineers (SPIE) Conference Series, ed. A. M. Fowler, Vol. 3354, 534–544
- Terrell et al. (2007) Terrell, D., Munari, U., & Siviero, A. 2007, MNRAS, 374, 530
- Thamm et al. (1994) Thamm, E., Steinacker, J., & Henning, T. 1994, A&A, 287, 493
- Vacca et al. (2003) Vacca, W. D., Cushing, M. C., & Rayner, J. T. 2003, PASP, 115, 389
- van Diedenhoven et al. (2004) van Diedenhoven, B., Peeters, E., Van Kerckhoven, C., Hony, S., Hudgins, D. M., Allamandola, L. J., & Tielens, A. G. G. M. 2004, ApJ, 611, 928
- Vieira et al. (2003) Vieira, S. L. A., Corradi, W. J. B., Alencar, S. H. P., Mendes, L. T. S., Torres, C. A. O., Quast, G. R., Guimarães, M. M., & da Silva, L. 2003, AJ, 126, 2971
- Vinković et al. (2003) Vinković, D., Ivezić, Ž., Miroshnichenko, A. S., & Elitzur, M. 2003, MNRAS, 346, 1151
- Zhu et al. (2012) Zhu, Z., Nelson, R. P., Dong, R., Espaillat, C., & Hartmann, L. 2012, ApJ, 755, 6
- Zhu et al. (2011) Zhu, Z., Nelson, R. P., Hartmann, L., Espaillat, C., & Calvet, N. 2011, ApJ, 729, 47