Neutron-capture element deficiency of the Hercules dwarf spheroidal galaxy ††thanks: Based on observations carried out at the European Southern Observatory under proposal number 083.D-0688(A).
We present an assessment of the barium abundance ratios for red giant member stars in the faint Hercules dwarf spheroidal (dSph) galaxy. Our results are drawn from intermediate-resolution FLAMES/GIRAFFE spectra around the Ba II 6141.71 Å absorption line at low signal-to-noise ratios. For three brighter stars we were able to gain estimates from direct equivalent-width measurements, while for the remaining eight stars only upper limits could be obtained. These results are investigated in a statistical manner and indicate very low Ba abundances of log (Ba) 0.7 dex (3). We discuss various possible systematic biasses, first and foremost, a blend with the Fe I 6141.73 Å-line, but most of those would only lead to even lower abundances. A better match with metal-poor halo and dSph stars can only be reached by including a large uncertainty in the continuum placement. This contrasts with the high dispersions in iron and calcium (in excess of 1 dex) in this galaxy. While the latter spreads are typical of the very low luminosity, dark-matter dominated dSphs, a high level of depletion in heavy elements suggests that chemical enrichment in Hercules was governed by very massive stars, coupled with a very low star formation efficiency. While very low abundances of some heavy elements are also found in individual stars of other dwarf galaxies, this is the first time that a very low Ba abundance is found within an entire dSph over a broad metallicity range.
Key Words.:
Stars: abundances — stars: Population II — nuclear reactions, nucleosynthesis, abundances — galaxies: evolution — galaxies: dwarf — galaxies: individual: Hercules1 Introduction
Dwarf spheroidal (dSph) galaxies are low-luminosity systems with total luminosities often not exceeding those of globular clusters (e.g., Mateo 1998). Recently, even fainter systems have been found (Zucker et al. 2006a,b; Belokurov et al. 2006; Belokurov et al. 2007; Belokurov et al. 2009). These ultra-faint dSphs (UFDs) are exteremely faint and have very high mass-to-light ratios (e.g., Koch 2009; Simon et al. 2011). The UFDs are predominantly old and metal-poor systems, on average, more metal poor than their luminous counterparts, which extends the metallicity-luminosity relation toward even fainter magnitudes (Kirby et al. 2008). While long evasive (Fulbright et al. 2004) very metal-poor stars below an [Fe/H] of dex have now been uncovered in the more luminous dSphs as well as the UFDs (Kirby et al. 2008), with the currently most iron-poor star lying at [Fe/H]= dex (Tafelmeyer et al. 2010).
The UFDs were probably the formation sites of some of the first stars in the Universe (e.g., Salvadori & Ferrara; Bovill & Ricotti 2009; Gao et al. 2010; Norris et al. 2010a). Given their low stellar masses, the UFDs probably only hosted a few massive supernovae (SNe) so that they are the ideal environments to look for the imprints of individual explosions in the next generation of stars that formed out of the earliest SN material (e.g., Iwamoto et al. 2005; Lai et al 2008).
An important clue to the formation and evolution of the Galactic halo lies in the detection of anomalies in elemental abundances in a few halo field stars (e.g., Aoki et al. 2002; Ivans et al. 2003; Cohen et al. 2007) such as selective enhancements and/or depletions in the - or neutron-capture elements. The discovery of chemical oddballs in a few dSph satellites (e.g., Fulbright et al. 2004; Koch et al. 2008a; Feltzing et al. 2009) appears to indicate that accreted and disrupted UFDs were in fact important early donors to the metal-poor component of the Galactic halo. By studying the elemental abundances in more UFDs we can probe their similarity to the anomalous halo objects and assess how common such stars are in the dSphs, and investigate the predominant sources for their anomalous abundance patterns.
Koch et al. (2008, hereafter K08) studied two red giant branch (RGB) stars in the Hercules dSph galaxy in detail and found an “extraordinary level of depletion” in heavy elements. The level of depletion is reminiscent of what has previously been found for the metal-poor red giant star Dra 119 in the Draco dSph galaxy (Fulbright et al. 2004), albeit at a significantly higher metallicity. Similar abundance patterns were also measured more recently in three stars of the ultra-faint dSph galaxies Boötes I (Feltzing et al. 2009) and Leo IV (Simon et al. 2010). Both galaxies have even lower baryonic masses than Hercules. This means that we can expect to see the signatures of individual SNe, manifested in peculiar abundance patterns for the elements as well as a large star-to-star scatter in the abundance ratios (see also Carigi & Hernandez 2008; Koch et al. 2008a; Marcolini et al. 2008). K08 argued that the peculiar abundance patterns measured in the Hercules dSph galaxy, such as abnormally high Mg/Ca and Co/Cr ratios, were caused by an incomplete sampling of the initial mass function so that most likely only 1–3 massive (35 M⊙) SNe of type II enriched the galaxy’s gas.
In this work we focus on abundance measurements of the neutron-capture element barium () in the Hercules dSph galaxy (Belokurov et al. 2007). At mag, Hercules is one of the brighter UFDs. Hercules is a typical, metal-poor, old stellar population (12 Gyr) that has experienced little to no star formation in the past 12 Gyr (Sand et al. 2009; Musella et al. 2012; but cf. Brown et al. 2012). Narrow-band photometry (Adén et al. 2009a) and medium- to high-resolution spectroscopy (K08; Adén et al. 2009a; Adén et al. 2011 [hereafter A11]) have uncovered a broad range in “metallicity” in this galaxy with a full range in [Fe/H] from to dex, indicative of the presence of significant amounts of dark matter (Koch et al. 2012a)111In fact, its mass-to-light ratio is very high (300), implying a stellar mass of only a few times 104 M⊙ (Martin et al. 2008; see also Strigari et al. 2008; Adén et al. 2009b)..
This paper is organized as follows: In §2 we briefly recapitulate details on the stellar sample and the data set that we base our study on. In §3 we describe our estimates of the Ba abundance in the Hercules stars including a comprehensive discussion of possible biases of our measurements. The results are presented in §4 and are compared with the literature in §5 before we discuss these in the light of Hercules’ chemical enrichment history in §6.
2 Data and sample parameters
Adén et al. (2011) obtained spectra of 20 RGB stars selected from the comprehensive list of confirmed member stars of Adén et al. (2009a) that was compiled using the HR13 grating of the Fibre Large Array Multi Element Spectrograph (FLAMES; Pasquini et al. 2002) at the Very Large Telescope (VLT). This setting provides a wavelength coverage of 6100–6400 Å at a resolving power of R=20000. We refer to A11 for details on the observation and reduction strategy for this data set. Typical signal-to-noise (S/N) ratios for the entire sample in the magnitude range of V=18.7–20.3 mag are reported as 8–35 per pixel, while the abundance analysis of A11 was restricted to the 11 brighter targets (V20 mag) with S/N ratios in excess of 12.
In summary, A11 derived the atmospheric parameters of their RGB targets from a combination of Stömgren photometry and excitation equilibrium (), old, metal-poor isochrones (log ), and using empirical relations between gravity and microturbulence (). The resulting element abundance ratios for iron and calcium were then derived by means of an equivalent-width (EW) analysis, complemented by the fitting of synthetic spectra for the lower-S/N cases. In the following, we will proceed by adopting the stellar parameters as well as the Fe and Ca abundances of A11.
3 Barium abundance measurements
Throughout our analysis we used the Kurucz atmosphere grid222http://kurucz.harvard.edu, operating in local thermodynamic equilibrium (LTE), without convective overshoot, and using the -enhanced opacity distributions AODFNEW (Castelli & Kurucz 2003)333http://wwwuser.oat.ts.astro.it/castelli. The latter is justified by the findings of K08 that the abundances of important electron donors (Mg, O) are highly elevated to above 0.8 dex (Sect. 3.6.3), while the other -elements cover a broad range, with, e.g., [Ca/Fe] spanning 0.3 to 0.3 dex (K08; A11). Stellar abundances for the absorption lines in question were then computed using the abfind and synth drivers of the 2010 version of the synthesis program MOOG (Sneden 1973).
We note that A11 used spherical MARCS model atmospheres (Gustafsson et al. 2008) in their derivation of stellar parameters and [Fe/H] and [Ca/H], while the present work uses Kurucz model atmospheres (in following, e.g., K08). Heiter & Eriksson (2006) showed that significant differences can occur in derived elemental abundances for evolved giants, such as those in the Hercules dSph galaxy. However, we note that the differences in derived abundances, e.g., for Fe i and Fe ii are small when the EWs are small (less than 50 mÅ). Because we are exclusively studying metal-poor stars, where the EWs are small, the effect should be much weaker than the uncertainties caused, e.g., by continuum setting and S/N. Heiter & Eriksson (2006) did not include lines from Ba ii in their study. That our results are robust with respect to the usage of plane parallel or spherical model atmospheres is also corroborated by the investigation in Koch & McWilliam (2008). These authors showed that switching from the spherical MARCS model atmospheres to the plane-parallel model atmospheres in the Kurucz grid does not incur systematic changes in excess of 0.03 dex (for Fe i and Fe ii lines) and we do not expect any systematic effects on the limits that we will place on the [Ba/Fe] abundance ratios in the following.
Finally, in all steps in the analysis we account for hyperfine splitting of the Ba line. We used the same data for the hyperfine structure as in McWilliam (1998). We note that the effect of the hyperfine structure on the derived Ba abundance is consistent with zero. This is in line with laboratory work, which shows that the shifts of the main isotopes are small and hence the line is essentially Gaussian in spectra of moderate resolution (Karlsson, priv. comm. and Karlsson & Litzén 1999; Bensby et al. 2005). We adopt the solar abundance scale of Asplund et al. (2009), with log (Ba)=2.17.
3.1 Equivalent-width measurements of the Ba line
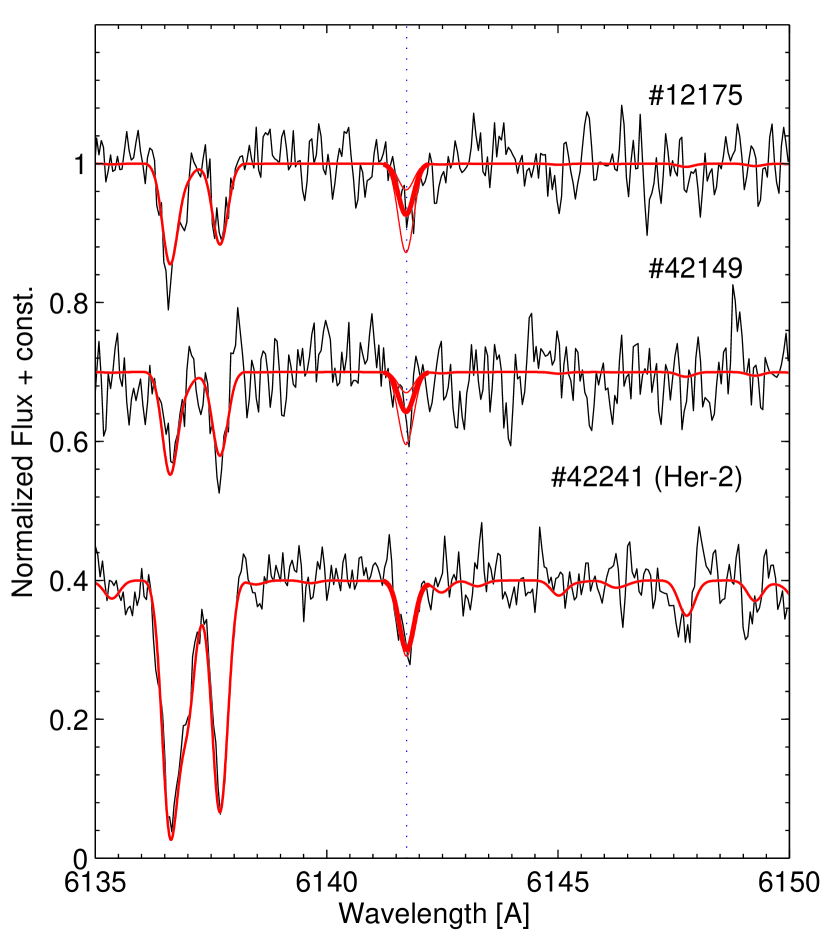
The S/N ratios in the three brightest stars, at , allowed us to attempt a direct measurement of the EW of the Ba ii line at 6141 Å – the only neutron-capture absorption feature that falls within the covered wavelength range and that would still be strong enough to be measured in metal-poor stars such as the red giant stars in the Hercules dSph galaxy. In practice, the EWs were measured by adopting a Gaussian line profile using IRAF’s splot task. Measurement uncertainties on the EWs were assigned based on the S/N and a generous allowance for the placement of the continuum. Figure 1 shows the respective region in the spectra of the three giant stars. Table 1 lists the resulting EWs.
| EW | log (Ba)b𝑏bb𝑏bCorrected for the Fe blend (Sect. 3.3). | |||||||
|---|---|---|---|---|---|---|---|---|
| IDa𝑎aa𝑎aIDs, [Fe/H], and [Ca/H] from Adén et al. (2009a, 2011). | [Fe/H]a𝑎aa𝑎aIDs, [Fe/H], and [Ca/H] from Adén et al. (2009a, 2011). | [Ca/H]a𝑎aa𝑎aIDs, [Fe/H], and [Ca/H] from Adén et al. (2009a, 2011). | [mÅ] | EW | Synth | 1 limitd𝑑dd𝑑dValues in parentheses give the limit derived when accounting for an error in continuum placement (Sect. 3.5.1). | 2 limitd𝑑dd𝑑dValues in parentheses give the limit derived when accounting for an error in continuum placement (Sect. 3.5.1). | 3 limitd𝑑dd𝑑dValues in parentheses give the limit derived when accounting for an error in continuum placement (Sect. 3.5.1). |
| 12175 | 3.17 | 2.89 | 5010 | 1.97 | 2.70 (1.97) | 2.45 (1.93) | 2.23 (1.88) | |
| 12729 | 2.35 | … | … | … | … | 1.65 (0.55) | 1.17 (0.32) | 0.70 (0.01) |
| 40789 | 2.88 | 3.06 | … | … | … | 2.12 (1.31) | 1.75 (1.23) | 1.49 (1.10) |
| 40993 | 2.38 | 2.68 | … | … | … | 2.12 (1.33) | 1.75 (1.26) | 1.51 (1.14) |
| 41460 | 3.10 | 2.78 | … | … | … | 2.08 (1.34) | 1.70 (1.23) | 1.42 (1.07) |
| 41743 | 2.42 | 2.51 | … | … | … | 2.14 (1.53) | 1.76 (1.42) | 1.50 (1.27) |
| 42096 | 2.60 | 2.40 | … | … | … | 2.26 (1.20) | 1.87 (1.14) | 1.63 (1.07) |
| 42149 | 2.95 | 3.08 | 2215 | 1.95 | 2.49 (1.70) | 2.20 (1.66) | 1.99 (1.61) | |
| 42241c𝑐cc𝑐cThis is Her-2 (K08). | 2.03 | 2.28 | 5010 | 2.64 | 2.68 (2.12) | 2.52 (2.09) | 2.37 (2.04) | |
| 42324 | 2.70 | 2.60 | … | … | … | 1.88 (0.88) | 1.48 (0.76) | 1.18 (0.58) |
| 42795 | 3.17 | 3.11 | … | … | … | 2.24 (1.38) | 1.89 (1.32) | 1.64 (1.23) |
3.2 Upper limits on equivalent widths for low spectra
For the remaining spectra, no Ba ii lines could be detected above the spectral noise. For these stars we chose to determine upper limits on the EWs and used them to derive upper limits on the Ba abundances. To this end, we followed the formalism of Cayrel (1988) to obtain a 1-error on the EW. This error can be propagated to an detection limit for log (Ba). In practice, EW is a function of the r.m.s. variation of the continuum (measured in immediately adjacent continuum regions), the (Gaussian) full width at half maximum (FWHM) of the line, and the pixel scale. The FWHM was estimated as 382 mÅ from an S/N-weighted mean FWHM of other, stronger lines near the Ba II 6141 Å feature, and the Ba line itself in the three brighter targets. Table 1 lists these upper limits555The quoted values include a downward correction to account for the blend with a nearby Fe line; see Sect. 3.3. for the 1, 2, and 3 detectabilities. Conversely, this procedure allows us to assess the significance of the actual line detections in the brighter stars as 7.6 (#12175), 2.8 (#42149), and 10.2 (#42241).
3.3 A blending Fe i line at 6141.730 Å
The Ba ii line at 6141.713 Å is blended with an Fe i line at 6141.730 Å. This needs to be accounted for when determining log (Ba). To this end, we computed synthetic spectra for each star, using its derived stellar parameters and measured [Fe/H] abundance. One synthesis was computed using only the Ba ii line and the second synthesis also included the Fe i line. The difference in the EWs measured from these two synthetic spectra yields an indication of the level on contamination by the Fe i line (e.g., Dobrovolskas et al. 2012). On average, we found a difference of 7% in measured EWs, with a maximum of 26% for the most metal-rich star, #42441 (Her-2). This leads to [Ba/Fe] limits (3) being lower by 0.03 dex on average. For #42441 the effect is stronger, 0.15 dex. As #42441 is the most metal-rich star in our sample and the strength of the Fe i line is driven by the metallicity, this means that the effect is weaker in all other stars. This is also verified by the spectral syntheses in Sect. 3.4.
The situation is similar for the three detections and EW measurements of the blended line: For stars #12175, #42149, and #42241 the effect on [Ba/Fe] is 0.02, 0.05, and 0.21 dex respectively and therefore comparable to the measurement uncertainties on our EWs (Table 1). Thus, for the majority of the stars, in- or excluding the Fe blend does not significantly alter the values for the detection limit, with the possible exception of the most metal-rich target (#42241), which we address in more detail in the next section. Moreover, the resulting decrease would rather strengthen our conclusion of a very low Ba-level in this galaxy (Sect. 4).
3.3.1 Influence of errors on the Fe-abundance
An error on the Fe abundance we assume for the model atmospheres will also affect the influence that the Fe-blend will exert on our estimate of log (Ba). Lowering [Fe/H] will diminish the blending Fe-line, resulting in an increase in the derived Ba abundance, and vice versa. To assess this source of uncertainty, we quantitatively propagated an Fe-error by re-running the above procedures for a grid of Fe-abundances, covering 0.4 dex around the fiducial values.
#42241: For the most metal-rich star the contamination will be strongest and this exercise can thus provide an upper limit to the variation of the derived log (Ba) with [Fe/H]. As a result, an Fe abundance lower by 0.3 dex translates into Ba-abundances higher by 0.27 dex, yielding an underestimate of [Ba/Fe] by 0.57 dex. Conversely, an increase in Fe by 0.3 dex means that the measured EW of the feature will be entirely due to iron with only negligible contribution from Ba; an error in Fe of 0.2 lowers log (Ba) by 0.34 dex.
A11 estimated statistical errors on [Fe/H] of typically 0.15 dex, which is in line with the excellent agreement of stellar parameters, metallicities, and/or iron abundances between different studies, based on various indicators666Amongst these measurements are [Fe/H]Stromgren= (Adén et al. 2009a); [Fe/H]CaT= (K08); [Fe/H]I= (K08); [Fe/H]I= (A11), yielding an error-weighted mean of dex. , which strengthens the reliability of our measurement techniques. We can translate this into an error on log (Ba) of dex and on [Ba/Fe] of dex.
#12175: In addition, we tested the influence of varying Fe for the most metal-poor star, to which the Fe-blend contributes only negligibly. As expected, even such large uncertainties on Fe of 0.4 dex do not change the measured log (Ba) by more than 0.02 dex.
We conclude that an error in Fe only affects the measurements at the metal-rich tail of our sample distribution, without notable influence on our claim of a low, overall Ba-abundance. In the figures below that show our results, we indicate the error ellipse for #42241 to illustrate this order-of-magnitude effect; as shown above, the error ellipses on the more metal-poor stars based on this source of uncertainty are negligible and are not shown.
3.4 Ba abundances from spectral synthesis
We successfully determined Ba abundances using spectral synthesis for the three brightest stars. For the remainder of the stars only upper limits could be derived. The synthesis takes the blending Fe i line into account (see Sect. 3.3).
The three brightest stars:
The Ba ii line in the two more metal-poor stars (of the three brightest stars), #12175 and #42149, is well matched by the syntheses and yielded best-fit (in a least-squares sense) abundances that differ from the EW measurement by and 0.08 dex, respectively. As the -procedures indicate, a typical uncertainty of 0.4 dex on [Ba/Fe] can be reached in the fits so that the above difference between EW-based values and the synthesized spectra are well within the measurement errors (see also Table 1). The best-fit spectra are shown in Fig. 1 and the resulting Ba-abundance is listed in the column labeled “Synth” in Table 1. In particular, the Fe lines between 6136 and 6138 Å are well reproduced.
The synthesis of the spectrum from star #42241 (Her-2), however, yields a very low [Ba/Fe] = . This lies well below the value implied by the EW measurement (it is one dex lower). This cannot be fully explained by the Fe-blend because the correction for the blend is only 0.21 dex (Sect. 3.3), nor by the statistical measurement uncertainty on the EW, which can only account for 0.15 dex. However, as the synthetic spectrum and the synthesis with log (Ba)0.4 dex of this object show, a change in Ba abundance has hardly any influence on the depth and shape of the line. Thus it appears that the blending Fe i is the dominant source for the observed absorption feature. As a result, the distribution saturates toward low Ba-abundances. This was also confirmed by our test in Sect. 3.3.1.
Fainter stars:
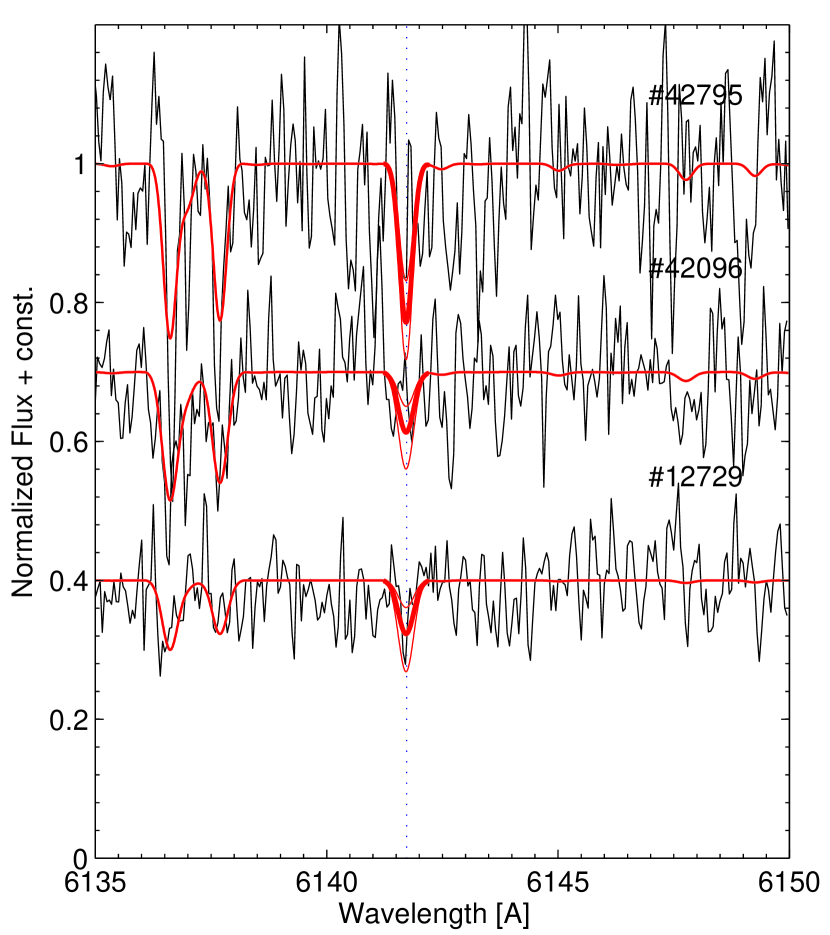
We also overplotted synthetic spectra on the noisy spectra for the fainter stars, from which only upper limits could be gleaned, to judge the reliability of our method to derive the detection limits. Three examples are shown in Fig. 2. As above, the Fe lines blueward of the Ba ii line are satisfactorily matched, while the synthesis of the Ba ii line itself indicates that our 3 limits are in fact good measures of the upper detection limit in these spectra.
3.5 Systematics
3.5.1 Continuum placement
Originally, Cayrel’s (1988) formula was devised for high-S/N spectra under the assumption that instrumental effects were corrected for, that the signal was photon-noise limited, and neglecting errors due to inaccurate sky subtraction, all of which are likely to be optimistic for our present, low-S/N spectra777In fact, the title of the respective proceedings volume was “The Impact of Very High S/N Spectroscopy on Stellar Physics” (Cayrel de Strobel & Spite 1988).). In fact, Cayrel states errors in continuum placement of 0.5%, while our spectra are at a level of 3–8% .
When measuring EWs, we already accounted for this by allowing for a generous range in EW, estimated by eye, of 20% and even 68% for the weakest of the three detections (Table 1). For the upper limits from the noisier spectra we again followed Cayrel (1988) and calculated an error on the expected EW. The respective uncertainty in the placement was determined from the immediate continuum adjacent to the Ba-line. We then added the resulting limit in quadrature to the previously determined n-detection limits that only accounted for the noise characteristics of the line (see also Bohlin et al. 1983). These revised upper limits are listed (in parentheses) in Table 1.
Naturally, these limits are higher than those derived without accounting for the continuum placement; for instance, the difference amounts to 0.44 dex on average for the case of 3-detections. As the continuum region around the Ba line is essentially free of other blends in metal-poor stars (except for the Fe line discussed above), any such errors would in fact be mainly due to the (spline1-) normalization employed by A11. However, since we handled the region around the Ba line with care, we consider the upper limits that additionally include the continuum error as conservative high estimates.
3.5.2 NLTE, ionization, and level of significance
We did not correct our results for departures from LTE: The computations of Andrievsky et al. (2009) indicate that all parameter changes ((Ba), [Fe/H], log ) conspire to yield NLTE corrections no larger than 0.1 dex. The Ba ii line at 6141 Å used in the present work was, however, not included in their calculations. Following Short & Hauschildt (2006), we estimated the downward NLTE corrections for the unsaturated Ba II line at 6141 Å, at [Ba/H] as observed in our stars (Table 1), to be on the order of 0.06 dex, which even lowers our upper limits. Likewise, Dobrovolskas et al. (2012) found the same order of magnitude effect, albeit at higher metallicities ([Fe/H]=1.6 dex).
To account for the same dependencies on ionization equilibrium and to remove sensitivities to the electron densities of the atmospheres (Seect. 3.6.2), one would strictly need to normalize the abundance ratio of Ba II relative to the iron abundance from ionized species, i.e., [Ba II/Fe II]. However, the spectral range of HR13 does not contain any Fe II lines that are strong enough to be reliably measured in the metal-poor red giant stars in the Hercules dSph galaxy. Accordingly, A11 did not list any [Fe II/H] ratios and we solely quote [Ba II/Fe I] for the three stars with actual measurements rather than upper limits. K08 derived an average ionization imbalance of log (Fe I)log (Fe II)= dex. If this is representative of the entire Hercules RGB sample, our [Ba/Fe] abundance ratios should be shifted upward by this constant amount, leaving the conclusions of a low Ba-level unaffected.
An important concern for this study is the choice of – the level of significance in the detection limits. Therefore, we computed log (Ba) for , which are listed in Table 1. Fig. 3 shows the element ratios of [Ba/H] and [Ba/Fe] for the cases of 2 and 3. In the following we continue by adopting the 3 values as a statistically sound detection limit.
3.5.3 Uncertainties on stellar parameters
In computing upper limits we are dealing only with the noise characteristics of the spectra and thus with random errors. While it may seem unusual to quote systematic uncertainties on the statistical detection limits, these can give us a deeper insight into the actual level of depletion of chemical elements in the Hercules stars. Therefore we performed a standard error analysis in which we separately varied each stellar parameter in the atmospheres by their typical uncertainties, as estimated by A11, and re-computed the detection limits as before. In this way, we can state an “upper limit on the upper limits”, i.e., the highest () detection limit assuming that all stellar parameters were significantly in error. We carried this out for star #42241, as an example of a measurement based on an actual EW detection, and for #42795, the most metal-poor star in the sample (Table 1). Table 2 lists these limits for the 2 and 3 cases upon varying the stellar parameters.
| #42241 | #42795 | ||
|---|---|---|---|
| Parameter | log (Ba) (EW) | log (Ba) (2) | log (Ba) (3) |
| Teff + 100 K | 1.70 | ||
| Teff 100 K | 1.66 | ||
| log + 0.35 dex | 1.83 | ||
| log 0.35 dex | 1.56 | ||
| + 0.2 km s-1 | 1.66 | ||
| 0.2 km s-1 | 1.72 | ||
| M/H + 0.2 dex | 1.75 | ||
| M/H 0.2 dex | 1.63 | ||
| /Fe = 0 | 1.78 | ||
Changes in gravity lead to the largest uncertainties for star #42241, with log (Ba) = 0.13 dex. Summing all contributions in quadrature, we obtain a total systematic uncertainty on the Ba abundance of this star of 0.16 dex, which is comparable to the random error based on the EW measurement uncertainty.
For star #42975, a comparison of Table 2 with the default results in Table 1 shows that, again, the surface gravity plays the dominant role in the Ba abundance determinations. The combined systematic uncertainty in this case amounts to 0.13 dex for both 2 and 3. We can rephrase this such that, only if all the errors on the stellar parameters were to conspire to raise the values for log (Ba), we would obtain upper limits that were 0.13 dex higher at the maximum. This does not affect our conclusions of an overall low Ba level in the Hercules dSph galaxy.
3.5.4 Opacity distribution functions
For either level of significance considered above, switching between -enhanced and solar-scaled opacity distributions does not have a noticeable effect on the Ba abundances or the limits thereof (see also Sect. 3.6.2). Thus there is no apparent, systematic effect on the abundance limits due to the large spread in the -elements in Hercules, as represented by Ca (A11).
Koch et al. (2008) found that their two stars had highly elevated [Mg/Fe] and [O/Fe] ratios of up to 0.8 and 1.1 dex, which lie significantly higher than the standard -enhancement of 0.4 dex assumed in this work. However, at the overall low iron abundances of the Hercules stars below dex, the dominant source of electrons is the ionization of hydrogen, which certainly holds for the most metal-poor stars at [Fe/H] dex (cf. Koch & McWilliam 2008).
Secondly, in the most metal-rich target of the sample, we find a slope of log (Ba) / /Fe] of 0.23 (Table 2), which means that extrapolating the transition from solar to -enhanced models to the observed extreme O/Fe abundance of this star, #42241, would yield a Ba abundance higher by 0.16 dex. Similarly, for our test on the most metal-poor sample star we obtain a negligible increase in log (Ba) of 0.02 dex, provided it had the same strong level of -enhancement as the two stars measured by K08.
4 Results
Figure 3 shows our results (after accounting for the Fe-blend). We show the Ba abundances obtained from the EW measurements and upper detection limits for the 2 and 3 cases. We also include, for comparison, Galactic stars from the compilation of Venn et al. (2004; and references therein) and Milky Way dSph satellites including the more luminous dSphs (Shetrone et al. 2001, 2003, 2009; Fulbright et al. 2004; Sadakane et al. 2004; Geisler et al. 2005; Aoki et al. 2009; Cohen & Huang 2009; Frebel et al. 2010a; Letarte et al. 2010; Tafelmeyer et al. 2010; Lemasle et al. 2012; Venn et al. 2012; and Starkenburg et al. 2012) and the most recent measurements in a few ultrafaint dSphs (K08; Feltzing et al. 2009; Frebel et al. 2010b; Norris et al. 2010b; Simon et al. 2010; and Gilmore et al. 2013).
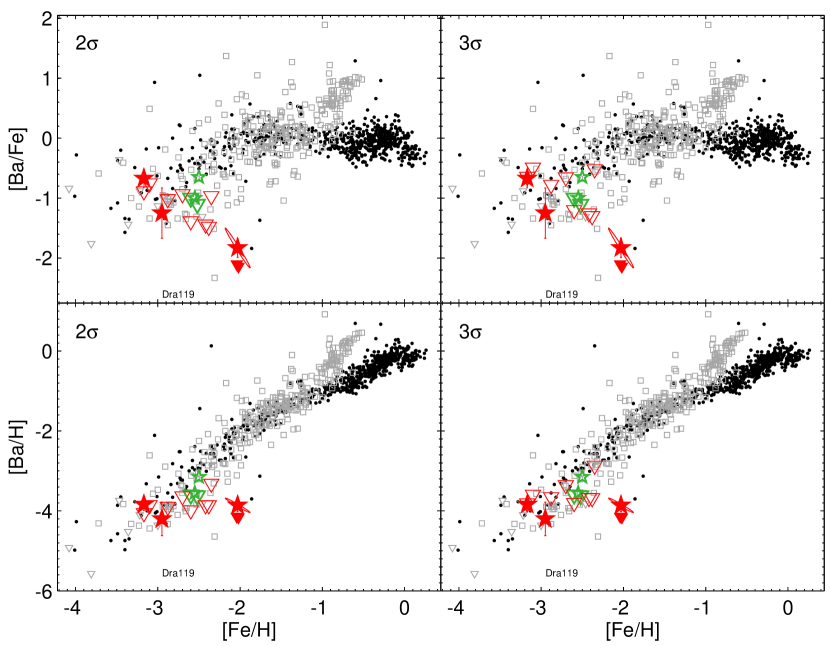
The Ba abundances and limits are very low, at a mean [Ba/H] of 3.97 from the three EW measurements, and [Ba/H] (2), (3), respectively. Thus, the Hercules dSph galaxy appears strongly depleted in Ba and, including the non-detection of Sr and other generally strong features in the red giant spectra of K08, we infer that Hercules is overall deficient in neutron-capture elements. The values measured here overlap with metal-poor halo stars at similar metallicities and about three dozens of dSph and UFD stars, but keeping in mind that our values are mostly upper limits, it is likely that the Hercules UFD shows an even stronger depletion than these metal-poor environments.
Intriguingly, the low Ba abundances persist over the full range of metallicity in the Hercules dSph galaxy. Therefore, Ba is essentially (almost constantly) low and the only reason for the decline in [Ba/Fe] towards higher [Fe/H], seen in the top panels of Fig. 3, is the onset of the Fe contributions, either from low-level Fe production in SNe Ia or in smaller amounts from massive stars, but coupled with an inhomogeneous mixing. In fact, the broad spread in iron (with a full range in [Fe/H] of 1.14 dex; A11) is typical of the low luminosity, dark-matter dominated dSphs (Koch 2009; Adén et al. 2009; Koch et al. 2012a). Taken at face value, the peak-to-peak variation in [Ba/H] across the full range in Fe is a mere 0.94 dex (3) – hardly an enrichment worth mentioning.
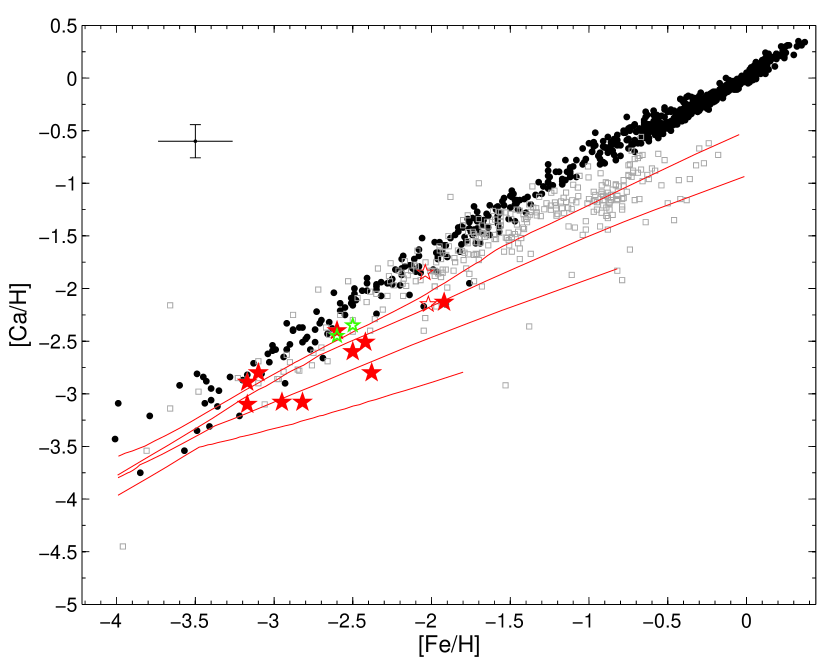
For a fair comparison, we reproduce the plots in Fig. 4, where the upper limits from our spectra (red triangles) are those after including a conservative error on the continuum placement.
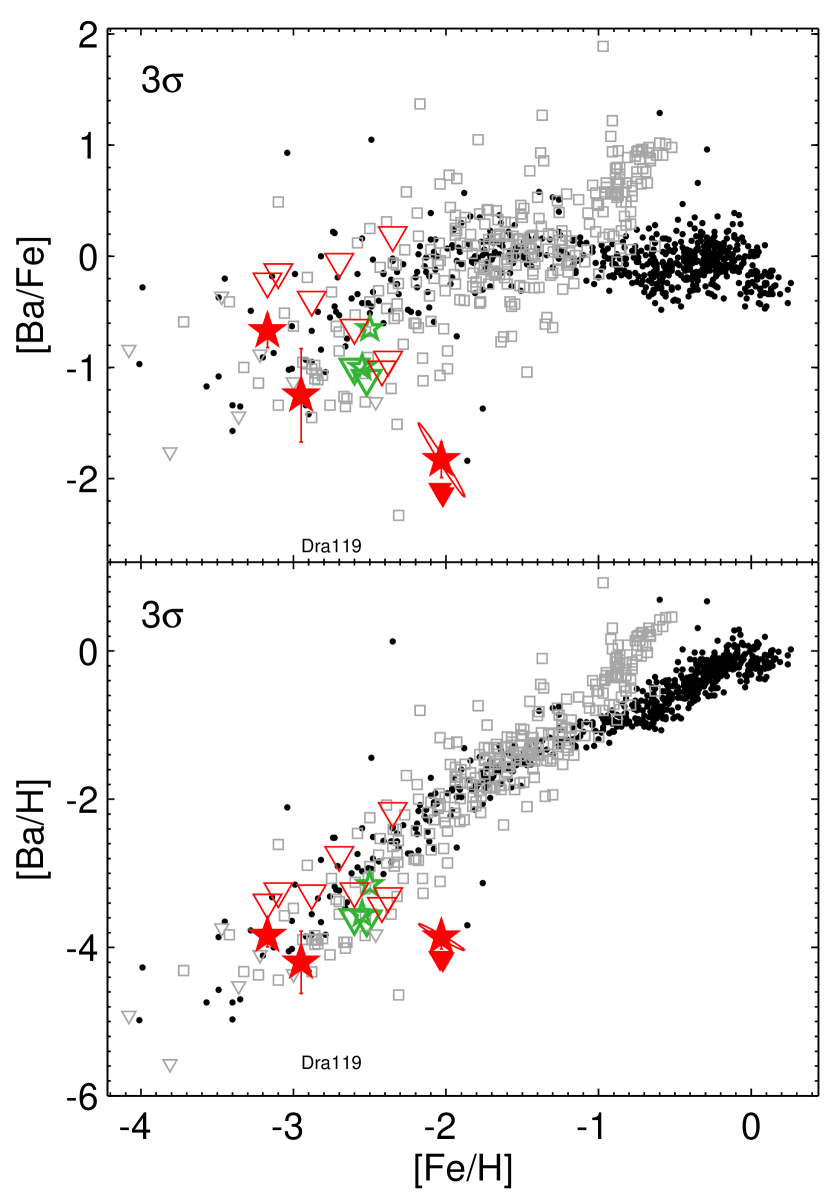
An increase in the upper limits due to an additional, large account of continuum placement errors would bring the upper limits in better accord with metal-poor halo and dSph stars (Fig. 4). However, the most metal-rich star, #42241 / Her-2, remains a puzzle in that it is strongly depleted in Ba, no matter how conservatively we construct its error budget. Its strong deficiency in [Ba/H] drives the impression of the overall, low Ba-abundance we see in this galaxy.
5 Comparison with the literature
Table 3 provides a comparison between our results and results from the literature.
| #42241 | #41460 | #42149 | #42795 | ||||||||
|---|---|---|---|---|---|---|---|---|---|---|---|
| K08 | A11/TW | A11/TW | F12 | A11/TW | F12 | A11/TW | F12 | ||||
| ID | Her-2 | 42241 | 41460 | 466011 | 42149 | 400664 | 42795 | 400508 | |||
| Fe I/H | 2.02 | 2.03 | 3.10 | 2.55 | 2.95 | 2.50 | 3.17 | 2.60 | |||
| Fe II/H | 1.78 | … | … | … | … | … | … | … | |||
| Ca/H | 3.15 | 2.28 | 2.78 | … | 3.08 | 2.35 | 3.11 | 2.45 | |||
| Ca/Fe | 0.13 | 0.25 | 0.32 | … | 0.13 | 0.15 | 0.06 | 0.15 | |||
| Ba/Ha𝑎aa𝑎aValues from this work are quoted as 3-limits. | 3.15 | ||||||||||
| Ba/Feb𝑏bb𝑏bRelative to Fe I, except for the values from K08. | 0.65 | ||||||||||
At first glance it may appear counterintuitive that the actual EW detections in the present work lie above the upper limits placed by K08 (shown as red solid triangles in Fig. 3). However, one should bear in mind that the spectral range (at a resolving power similar to the one of the FLAMES spectra in this work) of K08 also permitted the use of the Ba II 6496.91 Å line, which is inaccessible on the limited spectral coverage of HR13. Furthermore, K08 adopted a 2 detection limit to state their Ba-abundance results.
François et al. (2012) reported on detections of Ba in two red giants in the Hercules dSph galaxy, yielding [Ba/Fe] dex, and also upper limits on the same order of magnitude for two other stars. Three of their stars overlap with our sample. Their Ca abundances agree very well with the data of A11 to within the errors. However, the iron abundances by François et al. (2012) are higher by 0.5 dex on average then A11’s measurements. While these authors remarked that they “did not find extreme abundances in our Hercules stars as the one found by Koch et al. (2008)”, their values for [Ba/H] agree with the present study. Thus the [Ba/H] abundances we measure are lower by 0.420.30 dex than the values shown by François et al. (2012). Reasons for any discrepancies can be sought in the different instruments and, hence, resolutions of both studies. In particular, the VLT/X-shooter (Vernet et al. 2011) spectra of François et al. (2012) have lower resolutions (8000–12000) than the present FLAMES data (). Moreover, it may not be a statistically sound measure to compare upper limits from different sources in a one-to-one fashion.
6 Discussion
Unfortunately, our knowledge of the chemical fingerprints of the enrichment from a few or even single SNe are based on very few stars in dSphs and UFDs (only two stars in Hercules, three in Leo IV and Boo I, and the extreme Dra 119 in the Draco dSph), and a handful of extremely metal-poor halo stars with [Fe/H] around 5 to dex (e.g., Aoki et al. 2006; Cohen et al. 2008). In the present paper we aim to expand our knowledge on the enrichment patterns and chemical enrichment histories of dSph galaxies by providing more data on the neutron-capture element Ba in the Hercules UFD.
6.1 Enrichment patterns from SN in dSph galaxies
As the number of detailed abundance analyses of dSph galaxies studied using high-resolution spectra has grown, the number of stars with “anomalous” abundance patterns has also increased. Fulbright et al. (2004) found the first such star – Dra 119 (indicated in Fig. 3). Also this star is strongly depleted in process elements. More recently, another star with unusual abundance patterns, S1020549, was found in the Sculptor dSph galaxy (Frebel et al. 2010). Also this star is low in process elements. Other studies have found unusual [Mg/Ca] ratios in the UFDs, e.g., in Boo I (Feltzing et al. 2009).
Typically, the interpretation of the observed abundance patterns in these few unusual and metal-poor stars are matched to the predictions of theoretical yields to estimate how many SNe were involved in the enrichment of the Interstellar Medium (ISM) that that particular star or stars formed from. Figure 3 shows the Ba abundances for many stars, including Dra 119. This star is peculiar in that it is depleted in Sr and Ba by at least two decades (Fulbright et al. 2004). The majority of other heavy elements (Z30) are systematically lower by three to four times compared with halo stars of similar metallicity. Since the light element patterns in Dra 119 are consistent with enrichment from a massive (20 M⊙) SN II event the conclusion, perforce, is that massive, metal-poor SNeII do not contribute to the -process in proto-dSphs/UFDs 999Conversely, the most likely mass range for SNe II to host the -process lies around 8–10 M⊙ (e.g., Qian & Wasserburg 2007).. Thus even if the light elements are consistent with a massive101010A general concern in dealing with the the earliest chemical enrichment histories and the ensuing nucleosynthesis by massive stars is the question of “how massive is massive?”. High-mass SNe models (e.g., employing prompt enrichment and accounting for pair-instability SNe) in the range of M⊙ failed to reproduce many (light, Fe-peak, and neutron-capture) elements in Dra 119 by more than an order of magnitude and recent simulations in fact rather support “ordinary massive” first stars of a few tens M⊙ (e.g., Hosokawa et al. 2011, 2012). , single progenitor, the neutron-capture elements appear to tell a different story.
S1020549 in Sculptor has a Ba abundance as low as that of Dra 119, albeit its metallicity is lower than that of Dra 119 by one dex (Frebel et al. 2010). It may appear tempting to compare these two objects by considering Dra 119 to have experienced enrichment channels similar to S1020549 with an additional, later contribution of iron. However, the notably high Mg abundance in Dra 119 seems to preclude this analogy. Furthermore, the Scl dSph galaxy is more luminous by 2.2 mag, thus providing a rather different environment than the Draco dSph galaxy and, on the relevant, small scales, invoking different chemical enrichment histories.
One star in Leo IV is significantly underabundant in the -capture elements Ba and Sr, similar to what was found in other UFDs. Simon et al. (2010) argued that the chemical evolution of these environments was universal and consistent with predictions for a population III SN explosion.
However, in none of the dSphs and UFDs discussed above was it found that these low levels of, e.g., Ba were traced across their full metallicity ranges. However, this is now the case for the Hercules UFD, where we see low Ba across the entire broad range of metallicities (Fig. 3). As indicated above, the Hercules stars share a common locus with some 36 stars in the low-metallicity ([Fe/H] dex), low-Ba ([Ba/H] dex) regime. Out of these, 25 are distributed over six of the more luminous dSphs, while 11 stars found in four of the UFDs (Boo I, Com, Leo IV, and UMa II) show similar levels of depletions. In particular, one star in the Com UFD is similarly depleted in Ba as #42241 (Her-2), at [Fe/H] = . Thus all the UFDs with heavy element abundances published to date host at least one and often a few stars with a significant lack of the -capture elements.
Less is known about seriously depleted stars in the Milky Way. One example is provided by the mildly metal-poor halo star BD+80∘ 245 (Carney et al. 1997), which resembles the most metal-rich Hercules star, #42241, in the [Ba/H]-vs-[Fe/H] plane. While it shows [Ba/Fe] (and [Eu/Fe]) ratios lower by 1 dex than other halo stars at similar metallicities, its significantly subsolar -element abundances render it not fully comparable with the stars discussed above, all of which appear to have normal levels of the lighter elements. This perhaps implies that different enrichment mechanisms might be at play (Ivans et al. 2003), possibly the mixing of SNe II ejecta with contributions from some SNe Ia material.
6.2 Hercules’ chemical enrichment history
As discussed above, strong depletion of heavy elements is also found in individual stars of other UFDs. The current study suggests for the first time, however, that a very low Ba abundance is found within an entire dSph, systematically over a broad range in metallicity. How can we then account for a spread in iron whilst there is no accompanying spread in the heavy element barium?
The metallicity distribution function (MDF) for the Hercules dSph galaxy is truly metal poor. The most metal-rich stars have [Fe/H] of dex and extend down below 3 dex (Adén et al. 2009, 2011, 2013 [submitted]). This makes it perhaps one of the most metal-poor systems known and thus an interesting laboratory for testing our understanding of galactic chemical evolution. In fact, based on the overall low metallicities, A11 suggested that star formation in Hercules ceased early after the galaxy formed.
Moreover, there are reliable determinations of [Ca/Fe] for some 15 stars in the Hercules dSph galaxy (K08; A11; François et al. 2012). These show the typical trend with a flat part at the lowest [Fe/H] followed by a knee and an “early” (i.e., relatively metal-poor) downturn toward increasing [Fe/H] (e.g., Fig. 10 in A11; see also Fig. 5). The canonical interpretation is that of a somewhat extended star formation history with contribution from SNe II as well as from SNe Ia. However, the star formation rate must have been weak for SNe Ia to be able to contribute at such low metallicities. In this context, Koch et al. (2012b) argued that chemical evolution models (similar to those of Lanfranchi & Matteucci 2004) with a low star formation efficiency around 0.01 – 0.001 Gyr-1 match the observed trends in [Ca/Fe] reasonably well (see also Fig. 5).
Based on a comprehensive abundance analysis of two RGB stars in the Hercules dSph galaxy, K08 found that these stars possibly formed from gas that had only been enriched by one or a few massive SNe events (see also Simon et al. 2010). This scenario can now be tested against the broad range in both Fe as well as in Ca – can a single SN account for the entire Fe, Ca, and Ba we measure in Her?
We adopted the low luminosity and the stellar mass derived for the Hercules dSph galaxy by Martin et al. (2008). The stellar mass is very low at 4–7 M⊙. Additionally, we adopted the MDF from A11. With this information its possible to derive that we can expect Hercules to contain a few times 0.1 M⊙ of Fe111111The actual value depends on the chosen IMF of Martin et al. (2008) and the use of A11’s spectroscopic or photometric MDF. In practice, M(Fe) ranges from 0.076–0.28 M⊙.. Similarly, using the [Ca/H] distribution of A11, Hercules contains a total of 0.005–0.01 M⊙ in Ca. Drawing Ba abundances from our observed upper limits, log (Ba), translates into a total Ba-content of at most a few times M⊙. Comparison with the yields of, e.g., Heger & Woosley (2010) shows that these amounts of Fe and Ca can already be produced by 1–3 SNe II of 20 M⊙, accompanied by little to no Ba. This does not include the dilution of any such ejecta with the gas content of the early Hercules, however, and the accompanying question of the pre-enrichment of the early ISM121212For instance, Tassis et al. (2012) argued that hypothesis that the UFDs were pre-enriched by a first generation of stars implies that essentially all heavy elements observed in systems with M M⊙ (such as Her) have been produced by the Pop III stars. is beyond the scope of the present data and paper.
In Fig. 6 we compare our measurements with the same chemical evolution models, following Lanfranchi & Matteucci (2004), as introduced, for Ca, in Fig. 5 above.
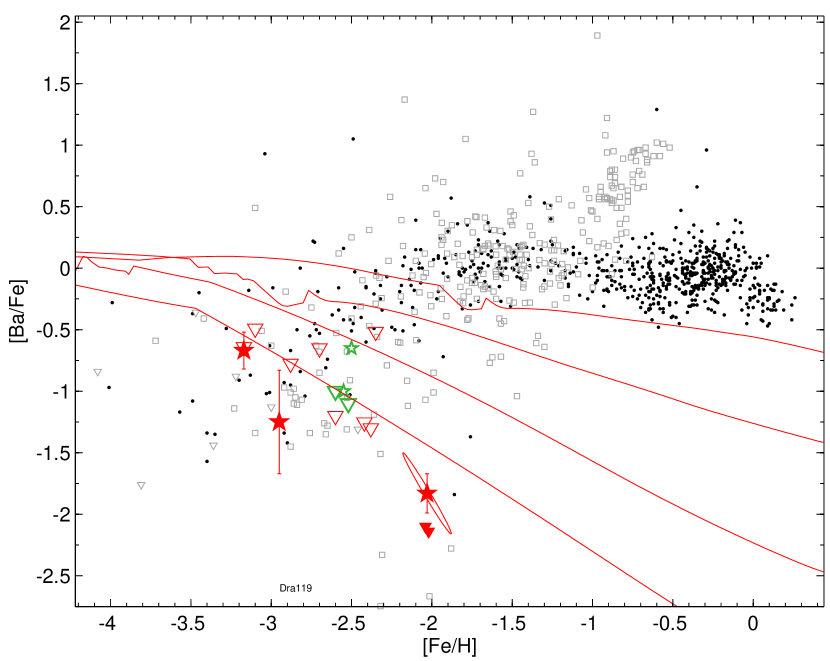
Contrary to the Galactic halo trend, the predicted [Ba/Fe] ratio in the Hercules UFD is decreasing with [Fe/H] – as is indeed observed. The reason is that the models for Hercules assume an extremely low star formation rate and that star formation was extended in time. Ba is produced in part from massive stars as an -process element (Cescutti et al. 2006) and by the -process in stars with masses between 1.5–3 M⊙ with life times of 400 Myr and longer. In this scenario the massive stars in the Hercules dSph galaxy contribute at very low [Fe/H], very modestly, to both Ba and Fe. When the Type Ia SNe start restoring the bulk of Fe, the Fe abundance in the ISM is still very low because of the low star formation efficiency and the [Ba/Fe] ratio start to decrease, as it happens in the Milky Way at much higher metallicity. Thus the trend seen in Hercules appears as a natural consequence of the time-delay model coupled with a very low star forming rate. This conclusion remains valid even when using the high upper limits of Fig. 4, which resulted from large continuum uncertainties.
However, our results might imply that the “constant” [Ba/H] in Fig. 3, or the decline in [Ba/Fe] with increasing metallicity, respectively, could be solely driven by the most metal-rich stars in the samples (Her-3, Her-2/#42441), which is found both in the results from K08 and in the present study. We cannot exclude the possibility that these “outliers” are too metal-rich analogs of the remaining, more metal-poor sample, which could have received an extra boost in Fe by a nearby massive SNe event that had formed from pre-enriched gas.
7 Summary
We have obtained direct measurements and upper limits for the heavy element abundances of the Hercules UFD as traced by the -process element barium. Similar to other faint dSphs and halo field stars of similar metallicity, Hercules shows low levels of Ba (see also Roederer 2013), but this depletion has now been traced over its full metallicity range.
Without doubt, the Hercules dSph galaxy suffered from a low star-formation efficiency. Ultimate tests for chemical evolution involving sets of yields, an IMF, and Hercules’ star formation history, accounting for enrichment by SNe II and SNe Ia and AGB (if any) are clearly warranted, but are inevitably limited by the currently sparse chemical abundance information at present. Measuring Mg in a large stellar sample and placing limits on more -capture elements, preferably Sr (Roederer 2013), is crucial for a deeper insight into Hercules’ enrichment history. Unfortunately, the spectral range of the HR13 spectra available to us for this study did not permit us to measure Mg so that we cannot judge whether the remainder of our sample also has elevated [Mg/Ca] ratios, as found in Her-2 and Her-3 of K08, which would be indicative of the occurrence of only a few massive SNe events. Clearly, a definite reconstruction of the small-scale chemical enrichment history of this (and other) UFD needs to await the next generation of telescopes and spectrographs to obtain clear measurements of heavy elements above the noise. Specifically, deeper studies of the Ba abundance itself would benefit from targeting other, intrinsically stronger Ba-lines at 5853 and 6494 Å, and the strong resonance doublet lines at 4554 and 4934 Å.
Acknowledgements.
AK acknowledges the Deutsche Forschungsgemeinschaft for funding from Emmy-Noether grant Ko 4161/1. We thank P. François for sharing his results before publication and a very helpful referee report. A. McWilliam, I.U. Roederer, H.-G. Ludwig, R.P. Church, T. Brown, and A. Frebel are thanked for helpful discussions.References
- Adén et al. (2009) Adén, D., Feltzing, S., Koch, A., et al. 2009a, A&A, 506, 1147
- Adén et al. (2009) Adén, D., Wilkinson, M. I., Read, J. I., et al. 2009b, ApJ, 706, L150
- Adén et al. (2011) Adén, D., Eriksson, K., Feltzing, S., Grebel, E. K., Koch, A., & Wilkinson, M. I. 2011, A&A, 525, A153 (A11)
- Andrievsky et al. (2009) Andrievsky, S. M., Spite, M., Korotin, S. A., et al. 2009, A&A, 494, 1083
- Aoki et al. (2002) Aoki, W., Norris, J. E., Ryan, S. G., Beers, T. C., & Ando, H. 2002, ApJ, 576, L141
- Aoki et al. (2006) Aoki, W., Frebel, A., Christlieb, N., et al. 2006, ApJ, 639, 897
- Aoki et al. (2009) Aoki, W., et al. 2009, A&A, 502, 569
- Asplund et al. (2009) Asplund, M., Grevesse, N., Sauval, A. J., & Scott, P. 2009, ARA&A, 47, 481
- Belokurov et al. (2007) Belokurov, V., Zucker, D. B., Evans, N. W., et al. 2007, ApJ, 654, 897
- Bensby et al. (2005) Bensby, T., Feltzing, S., Lundström, I., & Ilyin, I. 2005, A&A, 433, 185
- Bohlin et al. (1983) Bohlin, R. C., Jenkins, E. B., Spitzer, L., Jr., et al. 1983, ApJS, 51, 277
- Bovill & Ricotti (2009) Bovill, M. S., & Ricotti, M. 2009, ApJ, 693, 1859
- Brown et al. (2012) Brown, T. M., Tumlinson, J., Geha, M., et al. 2012, ApJ, 753, L21
- Carigi & Hernandez (2008) Carigi, L., & Hernandez, X. 2008, MNRAS, 390, 582
- Carney et al. (1997) Carney, B. W., Wright, J. S., Sneden, C., et al. 1997, AJ, 114, 363
- Castelli & Kurucz (2003) Castelli, F., & Kurucz, R. L. 2003, Modelling of Stellar Atmospheres, 210, 20P
- Cayrel (1988) Cayrel, R. 1988, The Impact of Very High S/N Spectroscopy on Stellar Physics, 132, 345
- Cescutti et al. (2006) Cescutti, G., François, P., Matteucci, F., Cayrel, R., & Spite, M. 2006, A&A, 448, 557
- Cohen et al. (2007) Cohen, J. G., McWilliam, A., Christlieb, N., et al. 2007, ApJ, 659, L161
- Cohen et al. (2008) Cohen, J. G., Christlieb, N., McWilliam, A., et al. 2008, ApJ, 672, 320
- Cohen & Huang (2009) Cohen, J. G., & Huang, W. 2009, ApJ, 701, 1053
- Dobrovolskas et al. (2012) Dobrovolskas, V., Kučinskas, A., Andrievsky, S. M., et al. 2012, A&A, 540, A128
- Feltzing et al. (2009) Feltzing, S., Eriksson, K., Kleyna, J., & Wilkinson, M. I. 2009, A&A, 508, L1
- François et al. (2012) François, P., Monaco, L., Villanova, S., et al. 2012, American Institute of Physics Conference Series, 1484, 460
- Frebel et al. (2010) Frebel, A., Kirby, E. N., & Simon, J. D. 2010a, Nature, 464, 72
- Frebel et al. (2010) Frebel, A., Simon, J. D., Geha, M., & Willman, B. 2010b, ApJ, 708, 560
- Fulbright et al. (2004) Fulbright, J. P., Rich, R. M., & Castro, S. 2004, ApJ, 612, 447
- Gao et al. (2010) Gao, L., Theuns, T., Frenk, C. S., et al. 2010, MNRAS, 403, 1283
- Geisler et al. (2005) Geisler, D., Smith, V. V., Wallerstein, G., Gonzalez, G., & Charbonnel, C. 2005, AJ, 129, 1428
- Gilmore et al. (2013) Gilmore, G., Norris, J. E., Monaco, L., et al. 2013, ApJ, 763, 61
- Gustafsson et al. (2008) Gustafsson, B., Edvardsson, B., Eriksson, K., Jørgensen, U. G., Nordlund, Å., & Plez, B. 2008, A&A, 486, 951
- Heiter & Eriksson (2006) Heiter, U., & Eriksson, K. 2006, A&A, 452, 1039
- Hosokawa et al. (2011) Hosokawa, T., Omukai, K., Yoshida, N., & Yorke, H. W. 2011, Science, 334, 1250
- Hosokawa et al. (2012) Hosokawa, T., Omukai, K., Yoshida, N., & Yorke, H.W. 2012, American Institute of Physics Conference Series, 1480, 91
- Ivans et al. (2003) Ivans, I. I., Sneden, C., James, C. R., et al. 2003, ApJ, 592, 906
- Iwamoto et al. (2005) Iwamoto, N., Umeda, H., Tominaga, N., Nomoto, K., & Maeda, K. 2005, Science, 309, 451
- IKarlsson & Litzen (1999) Karlsson, H., & Litzén, U. 1999, Physica Scripta, 60, 321
- Kleyna et al. (2002) Kleyna, J., Wilkinson, M. I., Evans, N. W., Gilmore, G., & Frayn, C. 2002, MNRAS, 330, 792
- Koch & McWilliam (2008) Koch, A., & McWilliam, A. 2008, AJ, 135, 1551
- Koch et al. (2008) Koch, A., Grebel, E. K., Gilmore, G. F., et al. 2008a, AJ, 135, 1580
- Koch et al. (2008) Koch, A., McWilliam, A., Grebel, E. K., Zucker, D. B., & Belokurov, V. 2008b, ApJ, 688, L13 (K08)
- Koch (2009) Koch, A. 2009, Astronomische Nachrichten, 330, 675
- Koch et al. (2012) Koch, A., Lépine, S., & Çalışkan, Ş. 2012a, Assembling the Puzzle of the Milky Way, C. Reylé; A. Robin; M. Schultheis (eds.); EPJ Web of Conferences, 19, 3002
- Koch et al. (2012) Koch, A., Matteucci, F., & Feltzing, S. 2012b, American Institute of Physics Conference Series, 1480, 190
- Lai et al. (2008) Lai, D. K., Bolte, M., Johnson, J. A., et al. 2008, ApJ, 681, 1524
- Lanfranchi & Matteucci (2004) Lanfranchi, G. A., & Matteucci, F. 2004, MNRAS, 351, 1338
- Lemasle et al. (2012) Lemasle, B., Hill, V., Tolstoy, E., et al. 2012, A&A, 538, A100
- Letarte et al. (2010) Letarte, B., Hill, V., Tolstoy, E., et al. 2010, A&A, 523, A17
- Marcolini et al. (2008) Marcolini, A., D’Ercole, A., Battaglia, G., & Gibson, B. K. 2008, MNRAS, 386, 2173
- Martin et al. (2008) Martin, N. F., de Jong, J. T. A., & Rix, H.-W. 2008, ApJ, 684, 1075
- Mateo (1998) Mateo, M. L. 1998, ARA&A, 36, 435
- McWilliam (1998) McWilliam, A. 1998, AJ, 115, 1640
- Musella et al. (2012) Musella, I., Ripepi, V., Marconi, M., et al. 2012, ApJ, 756, 121
- Norris et al. (2010) Norris, J. E., Wyse, R. F. G., Gilmore, G., et al. 2010a, ApJ, 723, 1632
- Norris et al. (2010) Norris, J. E., Yong, D., Gilmore, G., & Wyse, R. F. G. 2010b, ApJ, 711, 350
- Pasquini et al. (2002) Pasquini, L., et al. 2002, The Messenger, 110, 1
- Qian & Wasserburg (2007) Qian, Y.-Z., & Wasserburg, G. J. 2007, Phys. Rep, 442, 237
- Roederer et al. (2010) Roederer, I. U., Cowan, J. J., Karakas, A. I., et al. 2010, ApJ, 724, 975
- Roederer (2013) Roederer, I. U. 2013, AJ, 145, 26
- Sadakane et al. (2004) Sadakane, K., Arimoto, N., Ikuta, C., Aoki, W., Jablonka, P., & Tajitsu, A. 2004, PASJ, 56, 1041
- Salvadori & Ferrara (2009) Salvadori, S., & Ferrara, A. 2009, MNRAS, 395, L6
- Sand et al. (2009) Sand, D. J., Olszewski, E. W., Willman, B., et al. 2009, ApJ, 704, 898
- Shetrone et al. (2001) Shetrone, M. D., Côté, P., & Sargent, W. L. W. 2001, ApJ, 548, 592
- Shetrone et al. (2003) Shetrone, M., Venn, K. A., Tolstoy, E., Primas, F., Hill, V., & Kaufer, A. 2003, AJ, 125, 684
- Shetrone et al. (2009) Shetrone, M. D., Siegel, M. H., Cook, D. O., & Bosler, T. 2009, AJ, 137, 62
- Short & Hauschildt (2006) Short, C. I., & Hauschildt, P. H. 2006, ApJ, 641, 494
- Simmerer et al. (2004) Simmerer, J., Sneden, C., Cowan, J. J., et al. 2004, ApJ, 617, 1091
- Simon et al. (2010) Simon, J. D., Frebel, A., McWilliam, A., Kirby, E. N., & Thompson, I. B. 2010, ApJ, 716, 446
- Sneden (1973) Sneden, C. 1973, ApJ, 184, 839
- Strigari et al. (2008) Strigari, L. E., Bullock, J. S., Kaplinghat, M., et al. 2008, Nature, 454, 1096
- Starkenburg et al. (2013) Starkenburg, E., Hill, V., Tolstoy, E., et al. 2013, A&A, 549, A88
- Tafelmeyer et al. (2010) Tafelmeyer, M., Jablonka, P., Hill, V., et al. 2010, A&A, 524, A58
- Tassis et al. (2012) Tassis, K., Gnedin, N. Y., & Kravtsov, A. V. 2012, ApJ, 745, 68
- Venn et al. (2004) Venn, K. A., Irwin, M., Shetrone, M. D., Tout, C. A., Hill, V., & Tolstoy, E. 2004, AJ, 128, 1177
- Venn et al. (2012) Venn, K. A., Shetrone, M. D., Irwin, M. J., et al. 2012, ApJ, 751, 102
- Vernet et al. (2011) Vernet, J., Dekker, H., D’Odorico, S., et al. 2011, A&A, 536, A105