A near-infrared catalogue of the Galactic novae in the VVV survey area††thanks: Based on observations taken within the ESO VISTA Public Survey VVV, Programme ID 179.B-2002
Abstract
Context. Near-infrared data of Classical Novae contain useful information about the ejected gas mass and the thermal emission by dust formed during eruption, and provide independent methods to classify the objects according to the colour of their progenitors, and the fading rate and features seen after eruption. The VISTA Variables in the Vía Láctea survey (VVV) is a near-IR ESO Public Survey mapping the Milky Way bulge and southern plane. Data taken during covered the entire area in the bands plus some epochs in -band of the ongoing VVV variability campaign.
Aims. We used the VVV data to create a near-IR catalogue of the known Galactic novae in the 562 sq. deg. area covered by VVV. We also compiled the information about novae from the variability tables of the VVV variability campaign.
Methods. We used the novae list provided by VSX/AAVSO catalogue to search for all objects within the VVV area. From the 140 novae, we were able to retrieve the colours of 93 objects. We also checked in the ongoing VVV variability campaign for the light-curves of novae that erupted in the last years.
Results. The VVV near-IR catalogue of novae contains photometry of 93 objects completed as of December 2012. VVV allows to monitor objects within up to mag range. VVV images can also be used to discover and study novae by searching for the expanding shell. Since objects are seen at different distances and reddening levels, the colour-magnitude and colour-colour diagrams show the novae spread in magnitude as well as in colour. Dereddened colours and reddening-free indices were used with caution and cannot be a good approach in all cases since the distance and spectral features prevent more conclusive results for some extreme objects. Light-curves for some recent novae are presented.
Conclusions. Thanks to its high spatial resolution in the near-IR, and large -range, the VVV survey can be a major contributor for the search and study of novae in the most crowded and high-extinction regions of the Milky Way. The VVV survey area contains of all known novae in the Galaxy.
Key Words.:
Stars: novae, cataclysmic variables – Galaxy: stellar content – Catalogs – Surveys1 Introduction
Cataclysmic variable stars (CVs) are close binary systems composed by a late-type star which transfers material to a more massive white dwarf (WD) companion. The typical mass transfer rates in CVs are M⊙ yr-1, and the progressive accretion of hydrogen-rich material from the secondary star onto the hot surface of the WD can lead to a thermonuclear runaway, in which the accreted material is expelled from the system. This phenomenon is a so called nova eruption (e.g., Frank et al. 2002; Warner 2003).
During a nova eruption the object suddenly rises in brightness, becoming typically 8-15 magnitudes brighter than its progenitor. The recurrence between nova outbursts is expected to be years, and depends on the mass of the white dwarf and the mass transfer rate. The systems are classified as Classical Novae when just one nova eruption was recorded. However, this is strongly biased by ancient records, which are limited to a few thousand years. Systems with two or more registered nova eruptions are classified as Recurrent Novae, in general associated with a high-mass transfer rate system onto a primary star with the mass close to the Chandrasekhar limit (Warner 2003).
Since novae are usually found in eruption, the novae classification is in general based on the features seen during this phase, such as the fading (speed class) rate after the nova eruption (e.g., Gaposchkin 1957) and the spectral differences (e.g., Williams 1992).
More recently, alternative classifications are proposed based either on the Galactic component, with disk and bulge novae (e.g., della Valle & Livio 1998), or using automated selection and classification based on optical photometry (Darnley et al. 2004).
The infrared light can also contain the thermal emission by dust formed during the shell ejection. Models for thermonuclear runway predict the presence of material from the white dwarf in the ejecta, thus its spectroscopic analysis allows to distinguish between CO and ONe white dwarfs (Shafter et al. 2011). The importance of observing Galactic novae in the IR spectral region was fully understood when it was realized that they can represent a significant contributor to the interestellar medium (at least on local scales) of highly processed material, thus playing an active role in the chemical evolution of the Galaxy. Furthermore, IR observations provide independent methods for determining the ejected gas mass, a key parameter of every thermonuclear runaway model (Mason et al. 1998).
IR data can also help in the determination both of the global Galactic nova rate and the separate Galactic bulge and disk nova rates. Current Galactic nova samples, obtained mostly from optical surveys, are biased towards regions of lower optical extinction and therefore are incomplete within both the bulge and disk towards the Galactic plane. Previous determinations of the Galactic nova rate therefore vary by more than an order of magnitude, from 11 to 260 yr-1 (Shafter 1997). The nova rate in M31 is better constrained from optical studies (e.g., Darnley et al. 2006) but it remains unclear whether the rates within both galaxies are consistent with fixed bulge and disk nova rates per unit galactic luminosity. Again this uncertainty is due mostly to the poorly constrained knowledge of the Galactic rate. A large scale near-infrared time domain survey can allow novae to be identified throughout the Galactic bulge and disk and therefore facilitate a more complete determination of the nova rate within each stellar population.
The VISTA Variables in the Vía Láctea is a ESO Public near-IR survey scanning the Milky Way (MW) bulge and southern plane, in five near-IR bands (), plus a variability campaign of about 100 epochs in the -band spanning over many years (Minniti et al. 2010). VVV is about four magnitudes deeper than previous IR surveys, and thanks to its higher spatial resolution in the near-IR, enables deep observations in the most crowded and high-extinction regions of the Milky Way (e.g., Saito et al. 2012a).
Here we present a catalogue with the colours of 93 novae in the VVV area. We discuss the colour properties and features seen in the near-IR. We also present the first results from the VVV variability campaign, including light-curves for some novae. VVV can be a major contributor for the discovery and study of novae in the innermost regions of the Galaxy, objects that are beyond detection in the current novae searches.

2 Observations
VVV is an ESO Public Survey observing the MW bulge and inner southern plane in the near-IR with the VISTA Telescope located at Cerro Paranal Observatory in Chile (Minniti et al. 2010, and references therein). VVV observes an area of about 562 deg2, within and in the bulge, and within and in the plane (see Fig. 1). The whole bulge and disk areas were fully observed in five near-IR passbands () during 2010–2011, while a variability campaign in the band is ongoing, with 100 pointings planned over many years (Saito et al. 2012a).
Photometric catalogues for the VVV observations are provided by the Cambridge Astronomical Survey Unit (CASU)111http://casu.ast.cam.ac.uk/vistasp/. The catalogues contain the positions, fluxes, and some shape measurements obtained from different apertures, with a flag indicating the most probable morphological classification. The VVV data are in the natural VISTA Vegamag system, with the photometric calibration in performed using the VISTA magnitudes of unsaturated 2MASS stars present in the images. The single-band CASU catalogues for each tile were matched, creating a catalogue of more than 173 million sources in the VVV bulge area (Saito et al. 2012b), and about 148 million sources in the disk. A similar procedure was adopted to match the -band catalogues from the variability campaign in order to create variability tables for selected fields.
Different observing strategies between the bulge and disk area, and effects caused by crowding and extinction cause both the limiting magnitude and saturation to vary along the VVV area (Saito et al. 2012a, b). For instance, the -band limiting magnitude on the outer bulge is about 18.5 mag, while in the Galactic center the limit is mag (see Fig. 2). The saturation limit varies in a shorter range. The observations for a given field were taken in the same “observational block” (OB) which guarantees quasi-simultaneous observations in the three bands (there is a time gap of only s between each band). On the other hand, due to multiple scheduling constraints on the side of the VISTA telescope operations, there is a little control on the cadence of the -band variability data within a given season, with the number of epochs planned in a given year being observed together with the other VISTA surveys according with the surveys requirements on the weather and visibility, for instance.
3 The VVV Novae Catalogue
Our novae list was taken from The International Variable Star Index (VSX), provided by the American Association of Variable Star Observers222http://www.aavso.org/vsx/index.php (AAVSO). In this catalogue there are about 400 known novae in the Galaxy, 140 of them lie within the VVV area. Fig. 1 shows their spatial distribution, with most objects concentrated towards the Galactic bulge. We note that the information about some novae are from historical records or amateur astronomers, with the coordinates in general taken from observations while the objects were in eruption. Thus, in order to certify the coordinates with enough accuracy during the quiescent state, we checked for all objects in the SIMBAD database333simbad.u-strasbg.fr/simbad/. Finally, we defined as our coordinates the ICRS J2000 RA and DEC taken from SIMBAD, which were used as entries in our search for the VVV photometry and composite colour images.
| Nova | Other | Nova | RA | DEC | RA (VVV) | DEC (VVV) | Dist. | Note | ||||
|---|---|---|---|---|---|---|---|---|---|---|---|---|
| (Year) | Designation | Type | [hh:mm:ss.ss] | [dd:mm:ss.s] | [hh:mm:ss.ss] | [dd:mm:ss.ss] | [] | [mag] | [mag] | [mag] | [mag] | |
| Sgr 1893 | V5557 Sgr | N | 18:01:43.15 | 35:39:27.8 | 18:01:43.14 | 35:39:28.95 | 1.155 | 17.5280.076 | 16.9590.093 | 16.9430.154 | 0.070 | MS |
| Sgr 1897 | LQ Sgr | NA | 18:28:28.91 | 27:55:19.2 | — | — | ST | |||||
| Sgr 1899 | V1016 Sgr | NA | 18:19:57.63 | 25:11:14.6 | 18:19:57.63 | 25:11:14.52 | 0.089 | 11.3290.010 | 10.7490.010 | 10.4930.010 | 0.113 | |
| Sco 1901 | V0382 Sco | NA | 17:51:56.13 | 35:25:05.4 | — | — | ND | |||||
| Sgr 1901 | V1014 Sgr | NB | 18:06:45.70 | 27:26:15.0 | — | — | ND | |||||
| Sgr 1905 | V1015 Sgr | NA | 18:09:02.00 | 32:28:32.0 | 18:09:02.06 | 32:28:30.84 | 1.407 | 17.2500.063 | 17.1470.102 | 16.9350.154 | 0.112 | MS: |
| Cir 1906 | AR Cir | NB | 14:48:09.53 | 60:00:27.5 | 14:48:09.52 | 60:00:27.69 | 0.204 | 12.2110.010 | 12.7010.010 | 12.4390.010 | — | |
| Sco 1906 | V0711 Sco | NB | 17:54:06.16 | 34:21:15.5 | 17:54:06.16 | 34:21:15.55 | 0.070 | 13.9670.010 | 13.3280.010 | 13.1030.010 | 0.171 | |
| Sgr 1910 | V0999 Sgr | NB | 18:00:05.59 | 27:33:14.0 | — | — | ND | |||||
| Sgr 1914c | V1012 Sgr | NA | 18:06:14.00 | 31:44:27.0 | 18:06:14.10 | — | ND | |||||
| Sgr 1917 | BS Sgr | NB: | 18:26:46.72 | 27:08:19.9 | 18:26:46.72 | 27:08:19.84 | 0.061 | 12.7950.010 | 12.2860.010 | 12.1200.010 | 0.087 | |
| Sgr 1919 | V1017 Sgr | NA+UG | 18:32:04.17 | 29:23:12.6 | — | — | ND | |||||
| Sco 1922 | V0707 Sco | N | 17:48:26.38 | 36:37:54.9 | — | — | ND | |||||
| Sgr 1924 | FL Sgr | NA | 18:00:30.20 | 34:36:13.0 | 18:00:30.27 | 34:36:11.99 | 1.353 | 17.7100.159 | 17.5530.242 | 17.2390.260 | 0.111 | MS: |
| Sgr 1926 | FM Sgr | NA | 18:17:18.10 | 23:38:27.0 | 18:17:18.05 | 23:38:27.30 | 0.787 | 16.8190.082 | 16.4810.115 | 16.3730.144 | 0.187 | MS |
| Sgr 1926a | KY Sgr | NA | 18:01:21.02 | 26:24:40.0 | 18:01:21.02 | 26:24:39.95 | 0.073 | 11.8040.010 | 11.5390.010 | 10.9000.010 | 0.551 | |
| Sco 1928 | KP Sco | NA | 17:44:16.47 | 35:43:23.6 | — | — | ND | |||||
| Sgr 1928 | V1583 Sgr | NA | 18:15:26.30 | 23:23:18.0 | 18:15:26.27 | 23:23:18.95 | 1.020 | 16.9980.094 | 16.6370.129 | 16.4450.151 | 0.277 | MS: |
| Sgr 1930 | V0441 Sgr | NA | 18:22:08.09 | 25:28:53.7 | — | — | ND | |||||
| Cen 1931 | MT Cen | NA | 11:44:00.80 | 60:33:39.5 | 11:44:00.80 | 60:33:39.55 | 0.050 | 15.6070.010 | 14.8920.010 | 14.6810.010 | — | |
| Sgr 1932 | V1905 Sgr | NA | 18:33:42.10 | 25:20:42.0 | — | — | ND | |||||
| Sgr 1933 | V0737 Sgr | N | 18:07:08.66 | 28:44:52.3 | 18:07:08.71 | 28:44:52.24 | 0.621 | 15.4830.036 | 14.9590.037 | 14.7960.041 | 0.167 | MS |
| Cru 1935 | AP Cru | NA/DQ | 12:31:20.45 | 64:26:25.2 | 12:31:20.44 | 64:26:25.23 | 0.083 | 15.8520.011 | 15.2290.011 | 14.8780.015 | — | |
| Sco 1935 | V0744 Sco | N: | 17:53:18.08 | 31:13:35.1 | 17:53:18.17 | 31:13:35.37 | 1.210 | 17.0980.201 | 16.3060.189 | 15.6480.135 | 0.385 | MS: |
| Sgr 1936 | V0732 Sgr | NA | 17:56:07.51 | 27:22:16.1 | 17:56:07.51 | 27:22:16.36 | 0.261 | 13.3910.010 | 12.0200.010 | 11.2750.010 | 0.922 | |
| Sgr 1936b | V0726 Sgr | NA | 18:19:33.69 | 26:53:19.6 | 18:19:33.73 | 26:53:19.66 | 0.591 | 16.4840.048 | 15.7480.045 | 15.6210.059 | 0.143 | |
| Sgr 1936c | V0630 Sgr | NA | 18:08:48.25 | 34:20:21.4 | 18:08:48.39 | 34:20:21.70 | 1.723 | 17.5570.051 | 17.5280.109 | 16.6820.106 | 0.064 | : |
| Sgr 1936d | V0990 Sgr | NA | 17:57:19.00 | 28:19:07.0 | — | — | ND | |||||
| Sgr 1937 | V0787 Sgr | NA | 18:00:02.20 | 30:30:31.0 | 18:00:02.18 | 30:30:30.22 | 0.821 | 15.4150.054 | 14.8220.052 | 14.8060.067 | 0.243 | MS |
| Oph 1940 | V0553 Oph | NA | 17:42:53.50 | 24:51:26.2 | 17:42:53.46 | 24:51:25.45 | 0.951 | 16.4800.093 | 15.7560.102 | 15.5280.118 | 0.488 | MS |
| Sco 1941 | V0697 Sco | NA/DQ | 17:51:21.83 | 37:24:55.2 | 17:51:21.91 | 37:24:56.91 | 1.934 | 16.8700.047 | 16.5470.068 | 16.5370.109 | 0.131 | : |
| Sgr 1943 | V1148 Sgr | N | 18:09:05.85 | 25:59:08.0 | 18:09:05.85 | 25:59:08.06 | 0.065 | 13.3080.010 | 13.1030.010 | 12.9760.010 | 0.285 | |
| Sco 1944 | V0696 Sco | NA | 17:53:11.56 | 35:50:14.4 | 17:53:11.55 | 35:50:14.41 | 0.109 | 14.5770.010 | 14.2590.010 | 14.1870.016 | 0.116 | |
| Sgr 1944 | V0927 Sgr | NA | 18:07:42.70 | 33:21:17.0 | 18:07:42.72 | 33:21:17.77 | 0.805 | 16.8460.042 | 16.3040.049 | 16.2700.082 | 0.065 | MS |
| Sgr 1945a | V1149 Sgr | N | 18:18:30.40 | 28:17:17.0 | 18:18:30.37 | 28:17:18.35 | 1.389 | 17.6260.102 | 17.2230.127 | 17.0980.191 | 0.116 | MS: |
| Sgr 1945b | V1431 Sgr | N: | 18:03:29.61 | 29:59:54.6 | 18:03:29.55 | 29:59:54.84 | 0.852 | 12.6920.010 | 11.9750.010 | 11.7290.010 | 0.144 | |
| Sgr 1947a | V0928 Sgr | N | 18:18:59.30 | 28:06:00.0 | — | — | ND | |||||
| Sgr 1948 | V1150 Sgr | N | 18:18:55.40 | 24:05:32.0 | — | — | ND | |||||
| Sco 1949 | V0902 Sco | N: | 17:26:08.30 | 39:04:05.0 | — | — | ND | |||||
| Oph 1950 | V2110 Oph | NC | 17:43:33.32 | 22:45:37.0 | 17:43:33.32 | 22:45:36.95 | 0.074 | 11.6470.010 | 11.5370.010 | 11.1600.010 | 0.336 | ST |
| Nova | Other | Nova | RA | DEC | RA (VVV) | DEC (VVV) | Dist. | Note | ||||
|---|---|---|---|---|---|---|---|---|---|---|---|---|
| (Year) | Designation | Type | [hh:mm:ss.ss] | [dd:mm:ss.s] | [hh:mm:ss.ss] | [dd:mm:ss.ss] | [] | [mag] | [mag] | [mag] | [mag] | |
| Sco 1950a | V0719 Sco | NA | 17:45:43.90 | 34:00:55.0 | 17:45:43.85 | 34:00:55.41 | 0.724 | 16.1790.070 | 15.4420.067 | 15.2160.068 | 0.328 | MS: |
| Sco 1950b | V0720 Sco | NA | 17:51:58.00 | 35:23:22.0 | — | — | ND | |||||
| Sco 1950c | V0721 Sco | N | 17:42:29.10 | 34:40:41.5 | 17:42:29.10 | 34:40:41.60 | 0.103 | 13.5870.010 | 13.2410.010 | 13.0910.012 | 0.314 | |
| Sgr 1951a | V1172 Sgr | N | 17:50:23.66 | 20:40:29.9 | 17:50:23.65 | 20:40:29.88 | 0.114 | 12.4600.010 | 11.4840.010 | 11.0300.010 | 0.454 | |
| Sgr 1951b | V2415 Sgr | N: | 17:53:12.00 | 29:34:25.0 | 17:53:11.99 | 29:34:24.39 | 0.629 | 17.0530.293 | 16.4780.329 | 15.8640.242 | 0.371 | |
| Sco 1952 | — | n | 17:47:38.00 | 33:11:55.0 | — | — | ND | |||||
| Sco 1952a | V0722 Sco | NA | 17:48:37.00 | 34:57:50.0 | 17:48:36.88 | 34:57:50.78 | 1.679 | 15.6070.034 | 15.0110.033 | 14.8230.037 | 0.201 | MS: |
| Sco 1952b | V0723 Sco | NA | 17:50:05.20 | 35:23:58.0 | 17:50:05.32 | 35:23:56.79 | 1.939 | 15.4220.028 | 14.7800.029 | 14.5910.030 | 0.191 | MS: |
| Sgr 1952a | V1175 Sgr | NA | 18:14:17.00 | 31:07:08.0 | 18:14:17.01 | 31:07:08.42 | 0.432 | 17.6140.097 | 17.2200.120 | 17.0800.178 | 0.072 | |
| Sgr 1952b | V1174 Sgr | N | 18:01:37.00 | 28:44:24.0 | 18:01:37.07 | 28:44:22.94 | 1.439 | 14.0210.015 | 13.3070.013 | 13.0530.013 | 0.220 | : |
| Sgr 1953 | NSV 10158 | N: | 18:05:12.00 | 29:54:24.0 | — | — | ND | |||||
| Oph 1954 | V0908 Oph | N | 17:28:41.00 | 27:45:24.0 | — | — | ND | |||||
| Sco 1954 | NSV 9808 | N: | 17:53:40.00 | 30:45:32.0 | 17:53:40.08 | 30:45:31.48 | 1.177 | 15.2880.056 | 14.5160.056 | 14.2610.057 | 0.391 | : |
| Sgr 1954a | V1274 Sgr | NB | 17:48:55.00 | 17:51:55.0 | — | — | ND | |||||
| Sgr 1954b | V1275 Sgr | NA | 17:59:06.35 | 36:18:40.8 | 17:59:06.34 | 36:18:40.80 | 0.169 | 14.2250.010 | 13.6940.010 | 13.5620.010 | 0.134 | |
| Sgr 1955 | V1572 Sgr | N | 18:05:37.00 | 31:37:42.0 | 18:05:36.87 | 31:37:43.02 | 1.894 | 16.5060.053 | 16.0530.064 | 16.1160.106 | 0.162 | : |
| Oph 1957 | V0972 Oph | NB | 17:34:43.81 | 28:10:35.8 | 17:34:43.87 | 28:10:36.34 | 0.927 | 17.4500.229 | 16.8210.287 | 16.3060.262 | 0.560 | |
| Sgr 1960 | V1944 Sgr | N | 18:00:36.90 | 27:17:13.0 | 18:00:36.98 | 27:17:13.70 | 1.320 | 14.5500.027 | 13.7430.025 | 13.5100.026 | 0.268 | MS: |
| Oph 1961 | V1012 Oph | N | 17:41:34.38 | 23:23:33.1 | 17:41:34.43 | 23:23:32.34 | 1.063 | 17.2840.149 | 16.7220.167 | 16.8180.249 | 0.315 | : |
| Sgr 1963 | NSV 9828 | N: | 17:54:43.00 | 28:41:41.0 | — | — | ND | |||||
| Sco 1964 | V0825 Sco | N | 17:49:53.65 | 33:32:13.7 | 17:49:53.73 | 33:32:13.13 | 1.194 | 16.2590.076 | 15.7660.096 | 15.5610.101 | 0.298 | : |
| Sgr 1968 | V4027 Sgr | NB | 18:02:29.21 | 28:45:19.9 | 18:02:29.18 | 28:45:21.23 | 1.403 | 13.5820.010 | 12.9540.010 | 12.7280.010 | 0.174 | : |
| Sgr 1974 | V3888 Sgr | NA | 17:48:41.07 | 18:45:37.0 | — | — | ND | |||||
| Sgr 1975 | V3889 Sgr | NA | 17:58:21.32 | 28:21:52.7 | 17:58:21.46 | 28:21:53.20 | 1.927 | 15.0350.042 | 14.1410.036 | 13.8920.037 | 0.279 | MS: |
| Sgr 1977 | V4021 Sgr | NA | 18:38:14.26 | 23:22:47.0 | — | — | ND | |||||
| Sgr 1978 | V4049 Sgr | N | 18:20:38.06 | 27:56:26.0 | 18:20:37.99 | 27:56:24.59 | 1.673 | 16.4600.036 | 16.1630.050 | 16.0000.073 | 0.113 | : |
| Sgr 1980 | V4065 Sgr | NA | 18:19:38.20 | 24:43:55.9 | 18:19:38.22 | 24:43:55.87 | 0.260 | 10.8290.010 | 10.0520.010 | 9.7280.010 | 0.144 | ST |
| Sgr 1982 | V4077 Sgr | N | 18:34:39.41 | 26:26:02.9 | — | — | ND | |||||
| Nor 1983 | V0341 Nor | NA | 16:13:44.40 | 53:19:08.0 | 16:13:44.23 | 53:19:07.13 | 1.754 | 18.1290.133 | 17.6030.153 | 17.3490.181 | — | : |
| Oph 1983 | V0794 Oph | NB | 17:38:49.25 | 22:50:48.9 | 17:38:49.25 | 22:50:49.00 | 0.114 | 14.0310.010 | 13.3610.010 | 13.1110.010 | 0.289 | |
| Sgr 1983 | V4121 Sgr | N | 18:07:54.77 | 28:49:26.8 | 18:07:54.90 | 28:49:26.45 | 1.769 | 15.9800.057 | 15.6950.072 | 15.4610.074 | 0.177 | MS: |
| Sgr 1984 | V4092 Sgr | NA | 17:53:41.99 | 29:02:08.4 | 17:53:41.91 | 29:02:08.73 | 1.099 | 14.6180.035 | 13.7820.033 | 13.5790.034 | 0.374 | MS: |
| Sco 1985 | V0960 Sco | N | 17:56:34.14 | 31:49:36.3 | 17:56:34.17 | 31:49:35.55 | 0.830 | 15.2160.037 | 14.4120.033 | 14.1490.034 | 0.274 | MS |
| Sgr 1986 | V4579 Sgr | NB | 18:03:37.89 | 28:00:08.9 | 18:03:37.90 | 28:00:08.65 | 0.296 | 13.7780.012 | 13.4730.015 | 13.3360.017 | 0.209 | |
| Sgr 1987 | V4135 Sgr | N | 17:59:45.08 | 32:16:20.8 | — | — | ND | |||||
| Sco 1989b | V0977 Sco | N | 17:51:50.25 | 32:31:58.0 | 17:51:50.35 | 32:31:57.59 | 1.389 | 14.0240.012 | 13.2500.011 | 12.9880.012 | 0.327 | : |
| Cen 1991 | V0868 Cen | NA | 13:50:10.60 | 63:08:52.0 | 13:50:10.69 | 63:08:51.94 | 0.619 | 17.5130.032 | 16.8380.041 | 16.4070.064 | — | |
| Oph 1991b | V2290 Oph | NA | 17:43:05.50 | 20:07:00.0 | 17:43:05.47 | 20:07:00.59 | 0.734 | 16.9510.057 | 16.5070.082 | 16.2090.100 | 0.206 | |
| Sgr 1991 | V4160 Sgr | NA | 18:14:13.83 | 32:12:28.5 | — | — | ND | |||||
| Sco 1992 | V0992 Sco | NA | 17:07:17.44 | 43:15:22.0 | 17:07:17.45 | 43:15:21.86 | 0.199 | 15.4550.010 | 14.9810.014 | 14.6910.019 | — |
| Nova | Other | Nova | RA | DEC | RA (VVV) | DEC (VVV) | Dist. | Note | ||||
|---|---|---|---|---|---|---|---|---|---|---|---|---|
| (Year) | Designation | Type | [hh:mm:ss.ss] | [dd:mm:ss.s] | [hh:mm:ss.ss] | [dd:mm:ss.ss] | [] | [mag] | [mag] | [mag] | [mag] | |
| Sgr 1992a | V4157 Sgr | NA | 18:09:34.90 | 25:51:58.0 | 18:09:34.81 | 25:51:56.55 | 1.900 | 15.8200.045 | 15.3550.053 | 15.0950.057 | 0.238 | MS: |
| Sgr 1992b | V4169 Sgr | NA | 18:23:26.94 | 28:21:59.7 | — | — | ND | |||||
| Sgr 1992c | V4171 Sgr | NA | 18:23:41.34 | 22:59:28.7 | — | — | ND | |||||
| Sgr 1993 | V4327 Sgr | NA | 18:12:49.82 | 29:29:04.9 | 18:12:49.70 | 29:29:04.38 | 1.613 | 16.9600.085 | 16.5600.112 | 16.3520.136 | 0.100 | : |
| Cru 1996 | CP Cru | N+E | 12:10:31.39 | 61:45:09.5 | 12:10:31.36 | 61:45:09.75 | 0.315 | 16.6170.016 | 15.9770.016 | 15.4920.021 | — | |
| Sco 1997 | V1141 Sco | NA | 17:54:11.33 | 30:02:53.0 | 17:54:11.37 | 30:02:51.51 | 1.600 | 16.2720.136 | 15.9430.192 | 15.7390.204 | 0.258 | MS: |
| Sco 1998 | V1142 Sco | NA | 17:55:24.99 | 31:01:41.5 | — | — | ND | |||||
| Sgr 1998 | V4633 Sgr | NA | 18:21:40.49 | 27:31:37.3 | — | — | ND | |||||
| Sgr 1999 | V4444 Sgr | NA | 18:07:36.20 | 27:20:13.2 | 18:07:36.18 | 27:20:13.92 | 0.787 | 16.3230.094 | 15.6900.091 | 15.4060.089 | 0.211 | |
| Sgr 2000 | V4642 Sgr | NA | 17:55:09.84 | 19:46:01.0 | 17:55:09.89 | 19:46:00.34 | 0.976 | 17.3430.117 | 16.8120.145 | 16.5300.170 | 0.378 | |
| Sco 2001 | V1178 Sco | NA | 17:57:06.98 | 32:23:05.0 | 17:57:06.92 | 32:23:05.32 | 0.801 | 14.8380.019 | 14.1120.016 | 13.7880.017 | 0.261 | MS |
| Sgr 2001 | V4643 Sgr | NA | 17:54:40.46 | 26:14:15.2 | 17:54:40.47 | 26:14:14.30 | 0.499 | 12.8190.001 | 12.2120.010 | 12.7330.010 | 1.880 | |
| Sgr 2001b | V4739 Sgr | NA | 18:24:46.04 | 30:00:41.1 | 18:24:46.11 | 30:00:39.45 | 1.929 | 16.6540.029 | 16.1450.038 | 15.9670.065 | 0.077 | MS: |
| Sgr 2001c | V4740 Sgr | NA | 18:11:45.82 | 30:30:49.9 | 18:11:45.71 | 30:30:50.14 | 1.377 | 18.1030.239 | 17.6150.257 | 17.1260.249 | 0.101 | MS: |
| Sgr 2002 | V4741 Sgr | NA | 17:59:59.63 | 30:53:20.5 | — | — | ND | |||||
| Sgr 2002b | V4742 Sgr | NA | 18:02:21.86 | 25:20:32.2 | — | — | ND | |||||
| Sgr 2002d | V4744 Sgr | NA | 17:47:21.74 | 23:28:23.1 | 17:47:21.79 | 23:28:24.49 | 1.544 | 17.0660.140 | 16.2590.129 | 16.0830.150 | 0.313 | MS: |
| Sgr 2003b | V5113 Sgr | NA | 18:10:10.42 | 27:45:35.2 | — | — | ND | |||||
| Oph 2004 | V2574 Oph | NA | 17:38:45.49 | 23:28:18.5 | 17:38:45.52 | 23:28:18.55 | 0.415 | 15.8250.028 | 15.4960.040 | 15.1600.046 | 0.354 | MS |
| Sco 2004 | V1186 Sco | NA | 17:12:51.21 | 30:56:37.2 | 17:12:51.24 | 30:56:37.56 | 0.509 | 14.6220.010 | 14.2420.013 | 13.9120.015 | 0.218 | |
| Sco 2004b | V1187 Sco | NA | 17:29:18.81 | 31:46:01.5 | 17:29:18.84 | 31:46:01.35 | 0.363 | 14.5450.010 | 14.0470.013 | 13.7080.018 | 0.727 | |
| Sgr 2004 | V5114 Sgr | NA | 18:19:32.29 | 28:36:35.7 | 18:19:32.38 | 28:36:36.57 | 1.502 | 16.3020.031 | 15.9870.043 | 15.9320.069 | 0.136 | : |
| Cen 2005 | V1047 Cen | N | 13:20:49.74 | 62:37:50.5 | 13:20:49.79 | 62:37:50.63 | 0.387 | 14.3730.010 | 13.6640.010 | 12.8410.010 | — | |
| Nor 2005 | V0382 Nor | NA | 16:19:44.74 | 51:34:53.1 | 16:19:44.79 | 51:34:52.09 | 1.124 | 16.5540.028 | 16.1010.039 | 15.5740.049 | — | |
| Sco 2005 | V1188 Sco | NA | 17:44:21.59 | 34:16:35.7 | 17:44:21.58 | 34:16:33.87 | 1.836 | 17.2390.174 | 16.5890.180 | 16.4410.193 | 0.322 | MS: |
| Sgr 2005a | V5115 Sgr | NA | 18:16:59.04 | 25:56:38.8 | — | — | ND | |||||
| Sgr 2005b | V5116 Sgr | NA | 18:17:50.77 | 30:26:31.2 | 18:17:50.75 | 30:26:31.86 | 0.708 | 17.5350.088 | 16.2630.050 | 16.1630.081 | 0.084 | |
| Oph 2006 | V2575 Oph | N | 17:33:13.06 | 24:21:07.1 | 17:33:13.05 | 24:21:07.05 | 0.132 | 17.1170.072 | 16.5200.091 | 15.9980.098 | 0.488 | |
| Sgr 2006 | V5117 Sgr | NA | 17:58:52.61 | 36:47:35.1 | 17:58:52.57 | 36:47:34.33 | 0.883 | 17.5720.068 | 17.0920.090 | 17.0520.154 | 0.098 | MS: |
| Oph 2007 | V2615 Oph | NA | 17:42:44.00 | 23:40:35.1 | 17:42:44.00 | 23:40:35.16 | 0.059 | 16.6890.088 | 16.4040.127 | 16.0560.131 | 0.359 | |
| Nor 2007 | V0390 Nor | NA | 16:32:11.51 | 45:09:13.4 | — | — | ND | |||||
| Oph 2008a | V2670 Oph | NA | 17:39:50.94 | 23:50:01.0 | 17:39:50.92 | 23:50:00.88 | 0.274 | 13.4420.010 | 13.0810.010 | 12.1810.010 | 0.356 | |
| Oph 2008b | V2671 Oph | N | 17:33:29.67 | 27:01:16.4 | — | — | ND | |||||
| Sgr 2008 | V5579 Sgr | NA | 18:05:58.88 | 27:13:56.0 | 18:05:58.89 | 27:13:55.91 | 0.129 | 14.4900.018 | 13.8730.018 | 12.5410.010 | 0.237 | |
| Sgr 2008b | V5580 Sgr | N | 18:22:01.39 | 28:02:39.8 | 18:22:01.48 | 28:02:39.73 | 1.153 | 15.9880.024 | 15.6500.033 | 15.3940.048 | 0.129 | : |
| Oph 2009 | V2672 Oph | NA | 17:38:19.72 | 26:44:13.7 | — | — | ND | |||||
| Sgr 2009a | V5581 Sgr | N: | 17:44:08.44 | 26:05:48.7 | 17:44:08.46 | 26:05:47.78 | 0.948 | 11.4480.010 | 11.4450.010 | 10.6870.010 | 0.595 | ST |
| Sgr 2009b | V5582 Sgr | N | 17:45:05.40 | 20:03:21.5 | 17:45:05.42 | 20:03:21.43 | 0.263 | 14.4930.010 | 14.1590.010 | 13.1740.010 | 0.184 | |
| Sgr 2009c | V5583 Sgr | NA | 18:07:07.67 | 33:46:33.9 | 18:07:07.68 | 33:46:34.48 | 0.605 | 16.0600.021 | 15.9180.035 | 15.3910.037 | 0.107 | |
| Oph 2010 | V2673 Oph | NA | 17:39:40.90 | 21:39:50.5 | — | — | ND |
| Nova | Other | Nova | RA | DEC | RA (VVV) | DEC (VVV) | Dist. | Note | ||||
|---|---|---|---|---|---|---|---|---|---|---|---|---|
| (Year) | Designation | Type | [hh:mm:ss.ss] | [dd:mm:ss.s] | [hh:mm:ss.ss] | [dd:mm:ss.ss] | [] | [mag] | [mag] | [mag] | [mag] | |
| Oph 2010b | V2674 Oph | NA | 17:26:32.19 | 28:49:36.3 | — | — | ND | |||||
| Sgr 2010 | V5585 Sgr | NA | 18:07:26.95 | 29:00:43.6 | 18:07:26.95 | 29:00:43.59 | 0.016 | 11.9210.010 | 11.9060.010 | 11.2500.010 | 0.170 | |
| Sgr 2010b∗ | V5586 Sgr | N | 17:53:03.00 | 28:12:19.0 | 17:53:02.98 | 28:12:18.84 | 0.339 | 7.7640.010 | — | 10.6090.010 | 0.724 | ST |
| Sgr 2011 | V5587 Sgr | NA | 17:47:46.33 | 23:35:13.1 | — | — | ND | |||||
| Sgr 2011b | V5588 Sgr | NA | 18:10:21.35 | 23:05:30.6 | — | — | ND | |||||
| Cen 2012b∗∗ | TCP J14250600-5845360 | N: | 14:25:06.00 | 58:45:36.0 | — | — | ND | |||||
| Oph 2012b | PNV J17395600-2447420 | N | 17:39:56.00 | 24:47:42.0 | — | — | ND | |||||
| Sco 2012 | MOA 2012 BLG-320 | NB: | 17:50:53.90 | 32:37:20.5 | — | — | ND | |||||
| Sgr 2012∗∗ | PNV J17452791-2305213 | N: | 17:45:28.03 | 23:05:22.8 | 17:45:28.02 | 23:05:22.72 | 0.125 | 15.8130.035 | 15.4210.047 | 15.1780.056 | 0.274 | |
| Sgr 2012c | PNV J17522579-2126215 | NA | 17:52:25.79 | 21:26:21.5 | — | — | ND | |||||
| Sgr 2012d | PNV J18202726-2744263 | N | 18:20:27.26 | 27:44:26.3 | — | — | ND | |||||
| OGLE-2012-NOVA-01 | N | 17:56:49.39 | 27:13:28.2 | 17:56:49.50 | 27:13:28.59 | 1.518 | 17.4390.12 | 17.4400.366 | 17.0180.455 | 0.726 | : | |
| V1213 Cen | NA | 13:31:15.80 | 63:57:39.0 | 13:31:15.74 | 63:57:38.41 | 0.717 | 13.8550.01 | 13.6640.010 | 12.8030.010 | — | MS | |
| PN G002.6+01.7 | n: | 17:45:08.60 | 25:44:01.0 | 17:45:08.54 | 25:44:01.99 | 1.288 | 14.8880.02 | 13.8590.022 | 13.4650.024 | 0.531 | : | |
| V0733 Sco | N: | 17:39:42.88 | 35:52:38.4 | 17:39:43.00 | 35:52:38.62 | 1.523 | 14.5050.01 | 13.6670.010 | 13.3700.011 | 0.416 | : | |
| GR Sgr | NA: | 18:22:58.50 | 25:34:47.3 | 18:22:58.52 | 25:34:47.28 | 0.217 | 15.0710.01 | 14.6930.017 | 14.5060.023 | 0.143 | ||
| AT Sgr | NA | 18:03:30.87 | 26:28:28.5 | 18:03:31.00 | 26:28:28.74 | 1.815 | 17.2180.17 | 16.9230.271 | 16.3250.225 | 0.432 | MS: | |
| V2859 Sco | NA | 17:50:36.09 | 30:01:46.6 | — | — | ND | ||||||
| [KW2003] 105 | n: | 18:01:56.24 | 27:22:55.6 | 18:01:56.25 | 27:22:56.16 | 0.590 | 15.2500.030 | 14.9550.050 | 14.6560.054 | 0.327 | ||
| V0729 Sco | N: | 17:22:02.66 | 32:05:48.8 | — | — | ND |
We defined as a valid match all cases where a source was found within 1 arcsec from the position given by the catalogue. This value is agreement with the median values of the VVV image quality in the first season (, respectively to and observations) and the typical astrometric accuracy of the photometric catalogues (; Saito et al. 2012a). A complementary visual inspection of the images was performed for all novae candidates, in order to certify the presence (or absence) of a target in the given position. In some cases the source was rejected because of the presence of a faint object in a closer position to the coordinate, seen during the visual inspection of the images, but beyond the detection limit of the CASU aperture photometry, used to build the VVV photometric catalogues (see Section 2). In other cases multiple sources are seen in a similar close distance from the entry coordinates. In this procedure we secured the information for 55 novae within arcsec from the catalogue position, being 27 of them within the VIRCAM pixel scale of 034 pixel-1. A complementary search included also objects matching the position given by the catalogue within 2 arcsec. By this procedure we retrieved the photometry of another 37 objects. These are all fainter than mag and were classified as doubtful sources. We note that due to the source confusion in the most crowded regions of Galactic plane and bulge, a search based only on the coordinates does not guarantee that in all cases the source found in a closer position to the coordinates is in fact the nova remnant. Thus these should be seen as candidate near-IR counterparts for the novae remnant.
Therefore, from the 140 novae within the VVV area, we are able to provide the colours of 93 objects: 55 classified as valid matches (27 within the pixel scale), and 37 as doubtful sources. The other objects are beyond our detection limit (progenitors in quiescence with mag), or with coordinates not sufficiently accurate to allow us to identify the target in the field. Table 1 presents the photometry of all novae detected in the VVV area while in the Appendix we provide the composite finding charts for all objects.
Since the VVV observations were performed during 2010–2011, we are also able to provide the information about the progenitors of the most recent novae, as well as the fading curve after the nova eruption (see Section 5). Interestingly, the observations of Nova Sgr 2010b were secured while the object was in eruption (Saito & Minniti 2012a). Complementary information, including the timings of the VVV colour and variability campaign observations for all novae erupted in this century, is presented in Table 2.
| Nova | Other | Eruption | VVV | First -band epoch | Note |
|---|---|---|---|---|---|
| Designation | Date | Observation | (variability campaign) | ||
| Sco 2001 | V1178 Sco | 2001 | 2010 08 10 | 2010 09 12 | Remnant |
| Sgr 2001 | V4643 Sgr | 2001 | 2010 04 09 | 2011 08 06 | Remnant |
| Sgr 2001b | V4739 Sgr | 2001 | 2010 08 14 | 2010 10 15 | Remnant |
| Sgr 2001c | V4740 Sgr | 2001 | 2010 08 15 | 2011 08 05 | Remnant |
| Sgr 2002 | V4741 Sgr | 2002 | 2010 08 10 | 2010 09 12 | Remnant |
| Sgr 2002b | V4742 Sgr | 2002 | 2010 03 28 | 2010 03 30 | Remnant |
| Sgr 2002d | V4744 Sgr | 2002 | 2010 03 18 | 2010 09 29 | Remnant |
| Sgr 2003b | V5113 Sgr | 2003 | 2010 03 28 | 2010 08 26 | Remnant |
| Oph 2004 | V2574 Oph | 2004 | 2010 03 30 | 2010 04 10 | Remnant |
| Sco 2004 | V1186 Sco | 2004 | 2010 08 03 | 2010 08 26 | Remnant |
| Sco 2004b | V1187 Sco | 2004 | 2010 08 03 | 2010 08 26 | Remnant |
| Sgr 2004 | V5114 Sgr | 2004 | 2010 08 15 | 2010 10 24 | Remnant |
| Cen 2005 | V1047 Cen | 2005 | 2010 03 07 | 2010 03 29 | Remnant |
| Nor 2005 | V0382 Nor | 2005 | 2010 03 06 | 2010 03 06 | Remnant |
| Sco 2005 | V1188 Sco | 2005 | 2010 10 01 | 2011 07 27 | Remnant |
| Sgr 2005a | V5115 Sgr | 2005 | 2010 03 28 | 2010 03 30 | Remnant |
| Sgr 2005b | V5116 Sgr | 2005 | 2010 08 15 | 2010 10 15 | Remnant |
| Oph 2006 | V2575 Oph | 2006 | 2010 03 30 | 2010 04 09 | Remnant |
| Sgr 2006 | V5117 Sgr | 2006 | 2010 04 23 | 2010 10 25 | Remnant |
| Oph 2007 | V2615 Oph | 2007 | 2010 03 17 | 2011 06 12 | Remnant |
| Nor 2007 | V0390 Nor | 2007 | 2010 03 16 | 2010 08 15 | Remnant |
| Oph 2008a | V2670 Oph | 2008 | 2010 03 17 | 2011 06 12 | Remnant |
| Oph 2008b | V2671 Oph | 2008 | 2011 05 07 | 2011 06 13 | Remnant |
| Sgr 2008 | V5579 Sgr | 2008 | 2010 04 12 | 2011 08 05 | Remnant |
| Sgr 2008b | V5580 Sgr | 2008 | 2010 04 08 | 2010 08 27 | Remnant |
| Oph 2009 | V2672 Oph | 2009 | 2010 04 13 | 2011 06 13 | Remnant |
| Sgr 2009a | V5581 Sgr | 2009 | 2010 03 30 | 2010 03 30 | Remnant |
| Sgr 2009b | V5582 Sgr | 2009 | 2010 04 10 | 2011 06 14 | Remnant |
| Sgr 2009c | V5583 Sgr | 2009 | 2010 04 23 | 2010 08 18 | Remnant |
| Oph 2010 | V2673 Oph | 2010 01 15 a | 2010 04 10 | 2011 06 14 | Remnant |
| Sgr 2010 | V5585 Sgr | 2010 01 20 b | 2010 04 23 | 2010 08 26 | Remnant |
| Oph 2010b | V2674 Oph | 2010 02 18 c | 2011 05 09 | 2011 07 26 | Remnant |
| Sgr 2010b | V5586 Sgr | 2010 04 23.782 d | 2010 04 23.2457 () | 2010 09 12 | During eruption |
| 2010 04 23.2479 () | |||||
| 2010 04 23.2501 () | |||||
| Sgr 2011 | V5587 Sgr | 2011 01 25 e | 2010 03 18 | 2010 09 29 | Progenitor |
| Sgr 2011b | V5588 Sgr | 2011 04 07 f | 2010 04 21 | 2010 10 06 | Progenitor |
| Cen 2012b | TCP J14250600-5845360 | 2012 04 05 g | 2010 03 27 | 2010 03 09 | Progenitor |
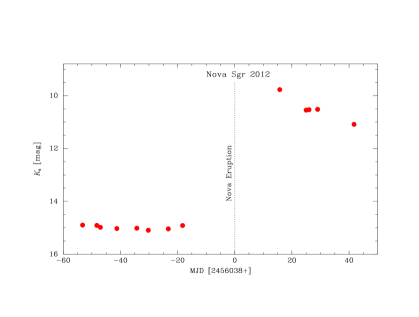
| Sgr 2012 | PNV J17452791-2305213 | 2012 04 21 h | 2010 03 18 | 2010 09 29 | Progenitor |
| Oph 2012b | PNV J17395600-2447420 | 2012 05 19 i | 2010 04 13 | 2011 06 12 | Progenitor |
| Sco 2012 | MOA 2012 BLG-320 | 2012 05 22 j | 2010 08 29 | 2010 09 25 | Progenitor |
| Sgr 2012c | PNV J17522579-2126215 | 2012 06 26 k | 2010 03 25 | 2010 09 29 | Progenitor |
| Sgr 2012d | PNV J18202726-2744263 | 2012 07 12 l | 2010 04 08 | 2010 08 27 | Progenitor |
| OGLE-2012-NOVA-01 | 2012 05 02 m | 2010 03 28 | 2010 08 26 | Progenitor |
a Nakano et al. (2010a), b Nishiyama et al. (2010), c Nakano et al. (2010b), d Kiyota et al. (2010), e Nakano et al. (2011), g Nishiyama et al. (2011), g Green (2012a), h Green (2012b), i Walter & Buil (2012), j Waagen (2012), k Yamaoka & Itagaki (2012), l Nishimura & Nakano (2012), and m Kozlowski et al. (2012).
4 The near-IR Colours
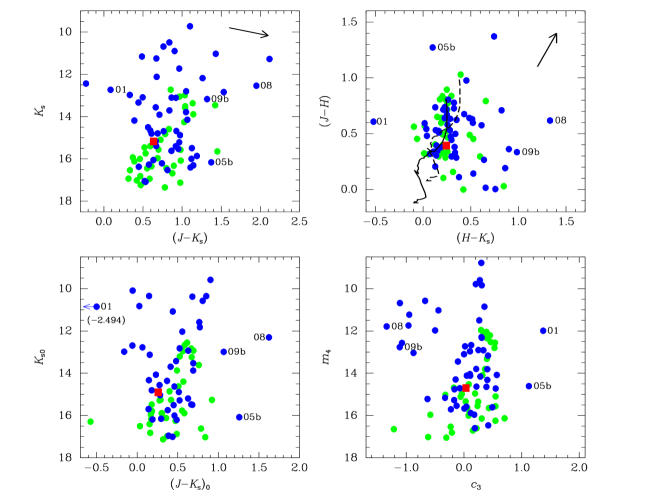
Figure 3 shows in the top panels the colour-magnitude diagram (CMD) and the colour-colour diagram (CCD) for all novae in the VVV area. We used different symbols to denote the objects classified as valid matches and the doubtful ones, as described in the previous Section. The reddening vector associated with an extinction of , based on the relative extinctions of the VISTA filters, and assuming the Cardelli et al. (1989) extinction law, is also shown.
The Galactic novae range in magnitude and colour, with all objects appearing red, with (the only exception is Nova Cir 1906, with ). Interestingly, a large fraction of novae are beyond detection in previous near-IR surveys (e.g., 2MASS, DENIS; Skrutskie et al. 2006; Epchtein et al. 1994), thus we are now reporting their IR-colours for the first time in an homogeneous data set. We note that the novae are spread across the whole VVV area (see Fig. 1), and therefore are affected by different extinction. For instance, in the bulge area where most novae are located, reddening spans from at to closer to the Galactic centre (e.g., Gonzalez et al. 2012).
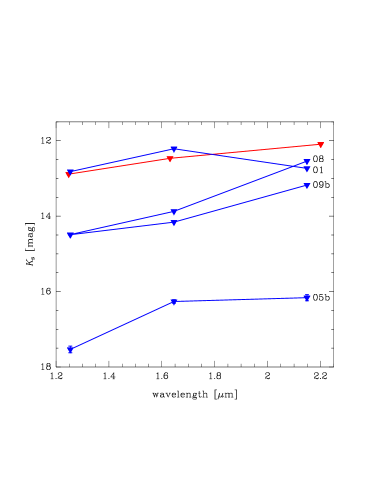
In the CCD the objects are seen more concentrated at low values of , but spread along by more than 1 mag. The colours of main sequence stars (with spectral type from B0 to M4, adapted from Ducati et al. 2001) are presented in the CMD in the case of mag (no extinction) an applying the median value of extinction among our targets of mag (corresponding to mag). The comparison reveals that part of our sources coincide in colour with the main sequence stars and therefore suggests that some of our novae candidates can be actually old field stars, which match a position close to the novae coordinates, and suffer from reddening at different levels. Individual values of for all bulge novae are listed in Table 1. Although the Ducati et al. (2001) data are in the system, it is sufficiently close to the VISTA system that is useful for the comparison. Four objects are seen with the most extreme colours: Nova Sgr 2001 and Nova Sgr 2005b, with the largest but low ; and Nova Sgr 2008 and Nova Sgr 2009b, showing the largest values at relatively low values of . The complementary spectral energy distributions (SED) for these selected objects are shown in Fig. 4. While Nova Sgr 2001 and Nova Sgr 2005b show a maximum close to the -band, the SED of Nova Sgr 2008 and Nova Sgr 2009b reveal a monotonic increase in flux towards longer wavelengths.
In order to minimize the reddening effects we calculated the dereddened , , and , colours for the bulge novae, using the maps of Gonzalez et al. (2012), the relative extinctions of the VISTA filters, and assuming the Cardelli et al. (1989) extinction law. A dereddened CMD is presented in the bottom-left panel of Fig. 3. Since the Gonzalez et al. (2012) maps do not cover the disk area we prefer to exclude from the plot the few novae located in this region, instead of using a different prescription for the extinction in the disk, which does not guarantee a good agreement with the procedure used in the bulge area (e.g., Saito et al. 2012a). We also note that the reddening law is known to change close to in the Galactic center (e.g., Nishiyama et al. 2009), but in our sample just one object (Nova Sgr 2001) belongs to this region.
A set of reddening-free indices provided by Catelan et al. (2011), based on the extinction law of Rieke & Lebofsky (1985) for the VISTA filters was also computed. The pseudo-magnitude and the pseudo-colour are defined as
| (1) |
| (2) |
The CMD is shown in the bottom-right panel of Fig. 3. We note the indices shown in the equations depend on the effective wavelengths of each filter, assumed to be a flat distribution here, which is certainly different from the near-IR spectra of novae. Refined indices based on actual near-IR spectra covering different luminosity classes and spectral types are currently being computed, and quantitative tests in the case of actual near-IR spectra of novae will also be carried out in the future.
One important aspect seen in all panels of Fig. 3 is the absence of a clear-cut correlations or trends, even using dereddened colours and reddening-free indices, the resulting distributions do not appear to have straightforward interpretations. The differences in colour arise mostly because () the objects are seen at different distances and positions in the Galaxy, and thus can suffer from extinction and reddening at different levels, compared to the 2D reddening maps of (Gonzalez et al. 2012) and () the spectral energy distribution in the near-IR can be affected by emission lines and thermal emission by a dust shell produced during eruption. The latter are time-dependent and valid mostly for recent novae. Depending on the evolution of the dust shells created in the outbursts, a variety of emission lines are seen in early post-outburst near-IR spectra. Moreover, for older novae the peak emission from the dust shells is shifted to longer wavelengths (e.g., Venturini et al. 2002; Banerjee & Ashok 2012).
Four objects seen with the extreme colours on the plots of Fig. 3 are discussed in more detail in the following, namely Nova Sgr 2001, Nova Sgr 2005b, Nova Sgr 2008 and Nova Sgr 2009b.
Ashok et al. (2006) classified Nova Sgr 2001 as a “NA” fast novae, with absence of dust formation after the eruption. Its near-IR spectrum evolves significantly from the early decline stage (March 2001) to the coronal phase (August 2001, Ashok et al. 2006). Nova Sgr 2001 is the innermost known nova in the Galaxy, with coordinates deg, with an extinction of mag according to the maps of Gonzalez et al. (2012) using Nishiyama et al. (2009) extinction law, equivalent to mag.
Our data taken during the quiescent phase (on April 2010) show the remnant of Nova Sgr 2001 as a relatively blue object, with the maximum intensity in the near-IR around the-band (see Fig. 4). However, data taken with UKIRT on March 2012 show Nova Sgr 2001 with a flatter SED in the near-IR, with the maximum intensity towards longer wavelengths (Varricatt et al. 2012).
Ashok et al. (2006) estimated a distance to the object of kpc. Thus, since our calculations using Gonzalez et al. (2012) maps assume the total extinction in the line of sight, it could not be a good approach to estimate the reddening for nearby objects, overestimating the corrections. In this case, three-dimensional extinction maps are necessary, in order to estimate the relative extinction at given distance (e.g., Chen et al. 2013). On the other hand, the colour seems to be dominated by the -band (by construction, see Equation 2), thus the presence of features such as emission lines or simply the slope of the SED contribute to shift the value of the pseudo-color from a relatively small to a relatively large value, depending on whether the emission peaks around the -band or not. This explains why Nova Sgr 2001 and Nova Sgr 2005b, whose spectra do peak around (Fig. 4), have large positive values, whereas the remaining novae, whose spectra monotonically increase towards longer wavelengths, have – on the contrary – large negative values.
Nova Sgr 2005b is similar in color with Nova Sgr 2001. Its remnant is a Supersoft X-ray variable source, presenting an orbital period of hr (Dobrotka et al. 2008; Sala et al. 2008, 2010), which puts the object on the edge of the hr CVs period gap (e.g., Warner 2003). The object is located beyond the bulge, with deg and a distance of kpc estimated by Sala et al. (2008). Nova Sgr 2005b lies in the lower part of the CMDs, with and . The presence of such distant objects in our data demonstrates our capability to monitor even the most distant novae in the Galaxy.
In the other extreme are Nova Sgr 2008 and 2009b. Nova Sgr 2008 was discovered in eruption on 2008 April 18 (Nakano et al. 2008). It is a nearby fast Fe II nova, located at deg at distance of kpc (Russell et al. 2008; Raj et al. 2011). The very red colors even in are related to the presence of dust. Spectra taken in the late stages after the eruption indicate dust formation during the nova remnant’s development (Raj et al. 2011). Nova Sgr 2009b (Sun & Gao 2009) is located in a low-extinction region with deg and mag. There are no entries in the literature estimating its distance or classifying the nova remnant. However, by comparing their colours, one can infer that Nova Sgr 2009b was similar to the Nova Sgr 2008 remnant. In this case, Nova Sgr 2009b could be surrounded by dust, expelled from the system after the eruption.
5 The VVV variability campaign on Novae
The IR photometric monitoring of several novae outbursts has allowed already in the 1990’s to distinguish between two fundamentally different types of objects, usually referred to as CO and ONe novae. While the first seems to arise from thermonuclear runaway on a relatively low-mass WD and tends to form considerable amounts of dust at later stages, the latter turn out to be associated with massive (1.2 ) WD that have outbursts which exhibit a coronal line emission phase with little or no dust production.
Particularly useful in identifying extreme CO and ONe novae are the -band light curves: because of the thermal emission from dust during the condensation phase, CO Novae reach an emission peak within a few months from the optical maximum, declining exponentially thereafter as consequence of the decreasing density of the shell owing to expansion (emblematic is the case of NQ Vul; Sato et al. 1978). ONe novae, on the contrary, decline rapidly shortly after the optical maximum and then have a positive change in the slope rate (e.g., V1974 Cyg; Woodward et al. 1997) because of the increasing contribution of several IR forbidden emission lines (e.g., [Ca VIII] 2.32 m, [Si VII] 2.47 m), whose intensity strengthens during the coronal phase acting thus as effective coolant of the ejecta (e.g., as in QU Vul; Greenhouse et al. 1988).
The VVV Survey, for the first time, will provide well-sampled light curves in the -band for about Galactic novae that exploded in the last 150 years in the Galactic bulge and in the southern part of the Galactic disk. At the time of writing, the VVV variability campaign is ongoing, and in the next few years until the completion of the survey (2016 or later), we would be able to finally build a coherent picture of nova IR behavior, at quiescence, as well as to discover new novae in highly-extincted regions that are missed in the optical.
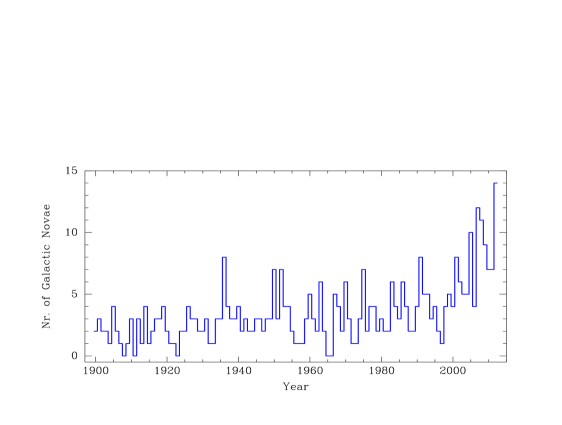
There are about 400 known novae in the Milky Way, but the comparison with the nova rate in nearby galaxies shows that a number of novae are lost every year in the Galaxy. While the historical records show a rate below a dozen nova discovered per year in the MW (see Fig. 5), several results point to a nova rate spanning between yr-1, or even higher reaching up to yr-1 (Liller & Mayer 1987; Liller 1993; della Valle & Livio 1994; Shafter 1997; Shafter & Irby 2001).
Not coincidentally, the spatial distribution of novae in the bulge and southern plane shows a “zone of avoidance”(see Fig. 1), with just a few objects belonging to the high-extinction regions of the Galaxy. This arises because the current searches for novae are performed with small-aperture telescopes in the optical. The VVV Survey combines deep and high-spatial resolution observations in the near-infrared, allowing one to search for novae even in the most crowded and high extinction regions of our Galaxy. Very illustrative is the recent discovery of VVV-NOV-001, the first Nova candidate from the VVV data, located in a high extinction region in the inner bulge with deg and mag (Saito et al. 2012c).
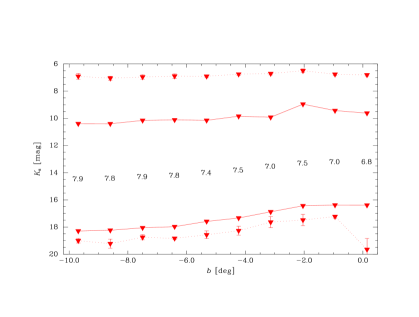
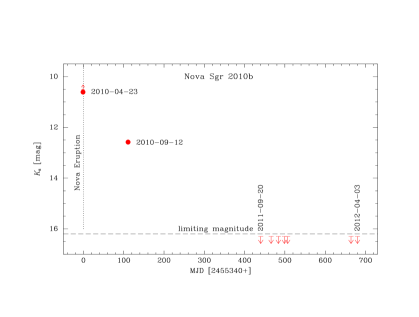
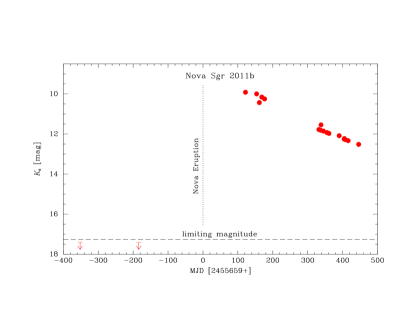
Fig. 2 shows the magnitude range covered by VVV at different levels of crowding in the bulge. Even in the most problematic case which is close to the Galactic center, the VVV observations allow us to monitor over a range in magnitudes spanning from mag, reaching even mag when using data taken below 5- accuracy and saturated sources. As of this writing, we are able to provide light curves with a few points for some objects, which demonstrates our capability to monitor novae at all phases depending on the magnitude in each case. Figs. 6, 7 and 8 show VVV light curves of Nova Sgr 2010b (Saito & Minniti 2012a), 2011 and 2012 (Saito & Minniti 2012b), respectively.
These -band light curves at quiescence will allow us to study any kind of orbital effects which could be related to the influence on the secondary star by the accreting WD, and when combined with the IR colors will also help quantify (via modeling of ellipsoidal variations of the secondary) fundamental parameters of the nova system, such as spectral type of the secondary, mass ratios, orbital periods and inclinations (Mason et al. 1998).
6 Perspectives on the search for novae using the VVV images
There is a well-known discrepancy on the actual amount of mass ejected in a CN outburst as predicted by theory and numerical simulations on one side, and as derived from infrared and radio observations on the other side - being the latter systematically higher by up to a factor 10 (Shaviv 2002; Shaviv & Dotan 2012).
Even if there are strong caveats on the methods and assumptions used for determining the mass of the ejecta (e.g., Shara et al. 2010), the analysis of the most recent observational material seems in fact to suggest for the ejecta of classical novae a lower mass and higher velocities (M☉ and up to 6000 km s-1, respectively, as in the extreme case of LMC1991 – Schwarz et al. 2001) than thought before. Identifying where such a discrepancy stems from would have dramatic consequences on our understanding of the nova phenomenon, e.g., by clarifying its role in the chemical evolution of the galaxy.
By supposing expansion velocities of the nova remnants larger than 1000 km s-1, it is reasonable to expect that at least the closest/fastest novae produce nebular remnants that eventually may be spatially resolved even from ground-based telescopes. Imaging such remnants allows the investigation of fundamental correlations between the properties of the central binary, the evolution of the outburst and the ejecta shaping mechanism, and also provides a direct measure of the distance to the nova by combining the angular expansion rate with spectroscopically derived expansion velocities, i.e., the so-called expansion parallax method (Baade 1940; Martin 1989).
While the infrared imagery has several advantages over the optical one (e.g., the extinction – which is often poorly known for novae – is conveniently reduced), up to now only a handful of nova remnants have been searched (and even fewer spatially resolved) in this spectral region, compared to more than 40 nova remnants resolved in the optical and 10 in the radio.
Thanks to the large sky area covered and to the higher spatial resolution than previous IR surveys (such as 2MASS and DENIS), VVV is in unique position to perform for the first time a systematic search for remnants of classical novae that exploded in the last decades within the inner, highly-extincted regions of the MW. Even assuming a representative distance to a nova of 4 kpc (about half-way to the Galactic center) and a very conservative expansion velocity of 1000 km s-1, VVV is in fact potentially able to spatially resolve the corresponding nebular remnants after 40 years from the outburst, taking into account the VIRCAM pixel scale (034 pixel-1) and a nebula angular size of 2”. No resolved novae shells have yet been detected in the VVV imaging data. In a forthcoming phase of the survey a search for novae using imaging will be conducted on the deep, stacked -band images, using more focused image analysis such as point spread function (PSF) subtraction or difference image analysis (DIA, e.g., Saito et al. 2012a).
7 Conclusions
We presented a near-IR catalogue of novae within the VVV area covering the MW bulge and southern Galactic plane area. From the 140 objects found in the VSX/AAVSO catalogue, we reported the colours of 93 objects. The rest were beyond detection or heavily blended sources. Colour-magnitude and colour-colour diagrams were presented, as well as CMDs using dereddened colours and reddening-free indices. These should be used with caution since in the case of nearby objects the dereddened colours can overestimate the corrections, by assuming the total extinction in the line of sight. Likewise, reddening-free near-IR indices specifically devised for the study of novae would also be of considerable interest, given their different spectral shapes compared with those typically assumed in the computation of these indices.
Thanks to its higher spatial resolution in the near-IR, and large -range covered by the observations, the VVV survey can be a major contributor for the search and study of novae in the Galaxy, mainly in the most crowded and high-extinction regions of the MW, beyond the capabilities of the current searches for novae in optical wavelengths.
VVV can produce well-sampled light curves covering many years for Galactic novae belonging both to the bulge and the southern part of the disk, even for objects during or fading after eruption. The recent report of VVV-NOV-001, the first nova candidate from the VVV data discovered in the inner bulge, is an illustrative example. Surely, the first of many more to come. The possibility to search for novae using the VVV imaging is accordingly a very promising path to unveiling the heretofore hidden population of heavily obscured novae.
Acknowledgements.
We gratefully acknowledge use of data from the ESO Public Survey programme ID 179.B-2002 taken with the VISTA telescope, data products from the Cambridge Astronomical Survey Unit, and funding from the FONDAP Center for Astrophysics 15010003, the BASAL CATA Center for Astrophysics and Associated Technologies PFB-06, the FONDECYT from CONICYT, and the Ministry for the Economy, Development, and Tourism’s Programa Iniciativa Científica Milenio through grant P07-021-F, awarded to The Milky Way Millennium Nucleus. Support for R.A. is provided by Proyecto GEMINI CONICYT 32100022 and via a Postdoctoral Fellowship by the School of Engineering at Pontificia Universidad Católica de Chile. M.C. and I.D. acknowledge funding from Proyecto FONDECYT Regular 1110326. J.B. acknowledges funding from Proyecto FONDECYT Regular 1120601. R.K. acknowledges partial support from FONDECYT through grant n. 1130140. This research has made use of the International Variable Star Index (VSX) database, operated at AAVSO, Cambridge, Massachusetts, USA.References
- Ashok et al. (2006) Ashok, N. M., Banerjee, D. P. K., Varricatt, W. P., & Kamath, U. S. 2006, MNRAS, 368, 592
- Baade (1940) Baade, W. 1940, PASP, 52, 386
- Banerjee & Ashok (2012) Banerjee, D. P. K., & Ashok, N. M. 2012, Bulletin of the Astronomical Society of India, 40, 243
- Cardelli et al. (1989) Cardelli, J. A., Clayton, G. C., & Mathis, J. S. 1989, ApJ, 345, 245
- Catelan et al. (2011) Catelan, M., Minniti, D., Lucas, P. W., et al. 2011, RR Lyrae Stars, Metal-Poor Stars, and the Galaxy, 145
- Chen et al. (2013) Chen, B. Q., Schultheis, M., Jiang, B. W., et al. 2013, A&A, 550, A42
- Darnley et al. (2004) Darnley, M. J., Bode, M. F., Kerins, E., et al. 2004, MNRAS, 353, 571
- Darnley et al. (2006) Darnley, M. J., Bode, M. F., Kerins, E., et al. 2006, MNRAS, 369, 257
- della Valle & Livio (1994) della Valle, M., & Livio, M. 1994, A&A, 286, 786
- della Valle & Livio (1998) della Valle, M., & Livio, M. 1998, ApJ, 506, 818
- Dobrotka et al. (2008) Dobrotka, A., Retter, A., & Liu, A. 2008, A&A, 478, 815
- Ducati et al. (2001) Ducati, J. R., Bevilacqua, C. M., Rembold, S. B., & Ribeiro, D. 2001, ApJ, 558, 309
- Epchtein et al. (1994) Epchtein, N., de Batz, B., Copet, E., et al. 1994, Ap&SS, 217, 3
- Frank et al. (2002) Frank, J., King, A., & Raine, D. J. 2002, Accretion Power in Astrophysics, by Juhan Frank and Andrew King and Derek Raine, pp. 398. ISBN 0521620538. Cambridge, UK: Cambridge University Press, February 2002.,
- Gaposchkin (1957) Gaposchkin, C. H. P. 1957, Amsterdam, North-Holland Pub. Co.; New York, Interscience Publishers, 1957.,
- Green (2012a) Green, D. W. E. 2012, Central Bureau Electronic Telegrams, 3073, 1
- Green (2012b) Green, D. W. E. 2012, Central Bureau Electronic Telegrams, 3089, 1
- Greenhouse et al. (1988) Greenhouse, M. A., Grasdalen, G. L., Hayward, T. L., Gehrz, R. D., & Jones, T. J. 1988, AJ, 95, 172
- Gonzalez et al. (2012) Gonzalez, O. A., Rejkuba, M., Zoccali, M., et al. 2012, A&A, 543, A13
- Liller & Mayer (1987) Liller, W., & Mayer, B. 1987, PASP, 99, 606
- Liller (1993) Liller, W. 1993, Rev. Mexicana Astron. Astrofis., 26, 41
- Martin (1989) Martin, P. G. 1989, Classical Novae, 73
- Mason et al. (1998) Mason, C. G., Gehrz, R. D., Woodward, C. E., et al. 1998, ApJ, 494, 783
- Minniti et al. (2010) Minniti, D., Lucas, P. W., Emerson, J. P., et al. 2010, New A, 15, 433
- Nakano et al. (2008) Nakano, S., Nishiyama, K., & Kabashima, F. 2008, Central Bureau Electronic Telegrams, 1342, 1
- Nakano et al. (2010a) Nakano, S., Nishimura, H., Itagaki, K., et al. 2010, IAU Circ., 9111, 2
- Nakano et al. (2010b) Nakano, S., Nishimura, H., Kiyota, S., et al. 2010, IAU Circ., 9119, 1
- Nakano et al. (2011) Nakano, S., Nishimura, H., Kiyota, S., & Yusa, T. 2011, IAU Circ., 9196, 1
- Nishimura & Nakano (2012) Nishimura, H., & Nakano, S. 2012, Central Bureau Electronic Telegrams, 3166, 1
- Nishiyama et al. (2009) Nishiyama, S., Tamura, M., Hatano, H., et al. 2009, ApJ, 696, 1407
- Nishiyama et al. (2010) Nishiyama, K., Kabashima, F., Liller, W., Yusa, T., & Maehara, H. 2010, IAU Circ., 9140, 1
- Nishiyama et al. (2011) Nishiyama, K., Kabashima, F., Maehara, H., & Kiyota, S. 2011, IAU Circ., 9203, 1
- Kiyota et al. (2010) Kiyota, S., Vollmann, W., Koberger, H., et al. 2010, IAU Circ., 9112, 1
- Kozlowski et al. (2012) Kozlowski, S., Poleski, R., Udalski, A., et al. 2012, The Astronomer’s Telegram, 4323, 1
- Raj et al. (2011) Raj, A., Ashok, N. M., & Banerjee, D. P. K. 2011, MNRAS, 415, 3455
- Rieke & Lebofsky (1985) Rieke, G. H., & Lebofsky, M. J. 1985, ApJ, 288, 618
- Russell et al. (2008) Russell, R. W., Rudy, R. J., Lynch, D. K., et al. 2008, IAU Circ., 8948, 1
- Saito et al. (2012a) Saito, R. K., Hempel, M., Minniti, D., et al. 2012, A&A, 537, A107
- Saito et al. (2012b) Saito, R. K., Minniti, D., Dias, B., et al. 2012, A&A, 544, A147
- Saito et al. (2012c) Saito, R. K., Minniti, D., Angeloni, R., & Catelan, M. 2012, The Astronomer’s Telegram, 4426, 1
- Saito & Minniti (2012a) Saito, R. K., & Minniti, D. 2012, The Astronomer’s Telegram, 4353, 1
- Saito & Minniti (2012b) Saito, R. K., & Minniti, D. 2012, The Astronomer’s Telegram, 4372, 1
- Sala et al. (2008) Sala, G., Hernanz, M., Ferri, C., & Greiner, J. 2008, ApJ, 675, L93
- Sala et al. (2010) Sala, G., Hernanz, M., Ferri, C., & Greiner, J. 2010, Astronomische Nachrichten, 331, 201
- Sato et al. (1978) Sato, S., Kawara, K., Kobayashi, Y., et al. 1978, PASJ, 30, 419
- Schwarz et al. (2001) Schwarz, G. J., Shore, S. N., Starrfield, S., et al. 2001, MNRAS, 320, 103
- Shafter (1997) Shafter, A. W. 1997, ApJ, 487, 226
- Shafter & Irby (2001) Shafter, A. W., & Irby, B. K. 2001, ApJ, 563, 749
- Shafter et al. (2011) Shafter, A. W., Bode, M. F., Darnley, M. J., et al. 2011, ApJ, 727, 50
- Shara et al. (2010) Shara, M. M., Yaron, O., Prialnik, D., & Kovetz, A. 2010, ApJ, 712, L143
- Shaviv (2002) Shaviv, N. J. 2002, Classical Nova Explosions, 637, 259
- Shaviv & Dotan (2012) Shaviv, N. J., & Dotan, C. 2012, Mem. Soc. Astron. Italiana, 83, 792
- Skrutskie et al. (2006) Skrutskie, M. F., et al. 2006, AJ, 131, 1163
- Sun & Gao (2009) Sun, G., & Gao, X. 2009, IAU Circ., 9049, 1
- Udalski et al. (1993) Udalski, A., Szymanski, M., Kaluzny, J., Kubiak, M., & Mateo, M. 1993, Acta Astron., 43, 69
- Varricatt et al. (2012) Varricatt, W. P., Banerjee, D. P. K., & Ashok, N. M. 2012, The Astronomer’s Telegram, 4405, 1
- Venturini et al. (2002) Venturini, C. C., Rudy, R. J., Lynch, D. K., Mazuk, S., & Puetter, R. C. 2002, AJ, 124, 3009
- Waagen (2012) Waagen, E. O. 2012, AAVSO Alert Notice, 461, 1
- Walter & Buil (2012) Walter, F. M., & Buil, C. 2012, Central Bureau Electronic Telegrams, 3124, 1
- Warner (2003) Warner, B. 2003, Cataclysmic Variable Stars, by Brian Warner, pp. 592. ISBN 052154209X. Cambridge, UK: Cambridge University Press, September 2003.,
- Williams (1992) Williams, R. E. 1992, AJ, 104, 725
- Woodward et al. (1997) Woodward, C. E., Gehrz, R. D., Jones, T. J., Lawrence, G. F., & Skrutskie, M. F. 1997, ApJ, 477, 817
- Yamaoka & Itagaki (2012) Yamaoka, H., & Itagaki, K. 2012, Central Bureau Electronic Telegrams, 3156, 1
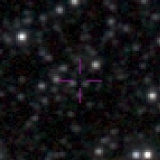
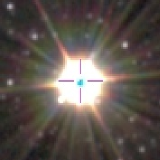
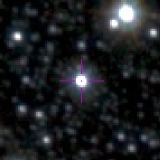
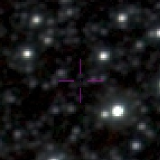
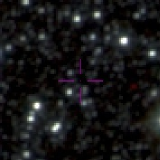
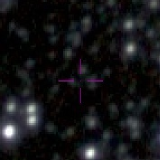
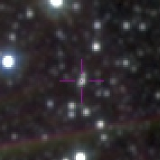
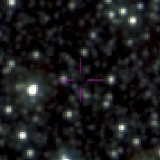
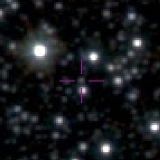
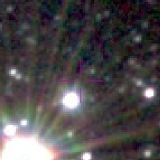
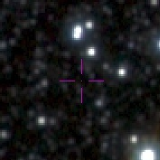
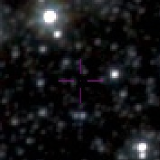
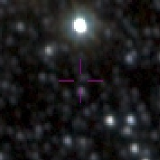
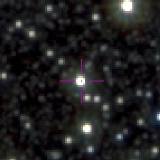
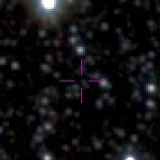
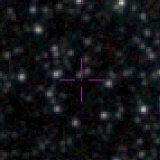
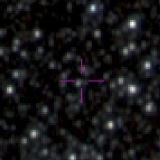
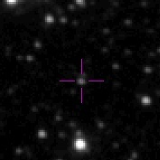
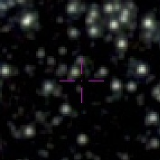
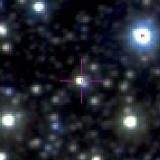
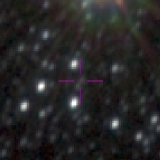
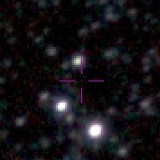
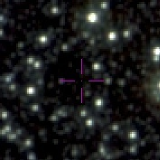
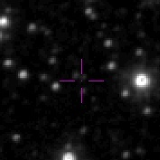
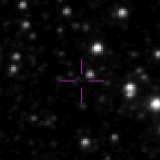
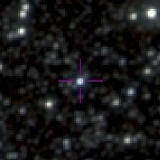
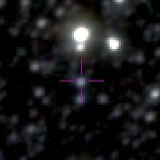
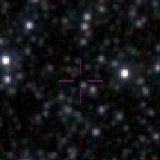
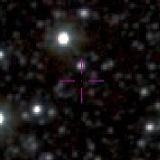
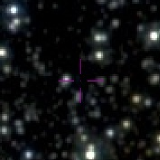
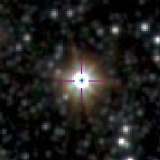
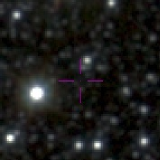
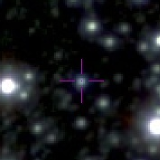
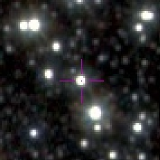
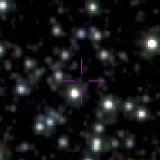
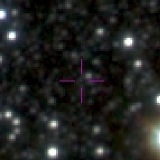
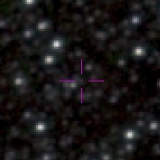
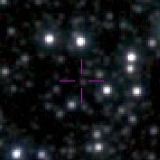
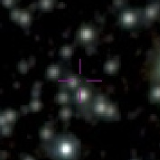
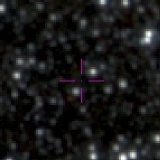
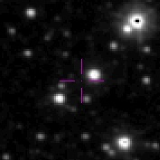
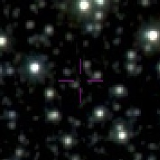
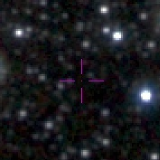
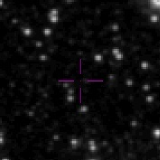
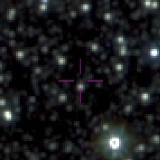
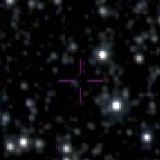
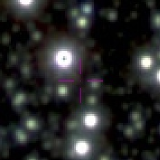
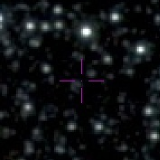
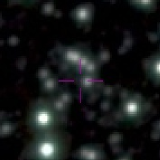
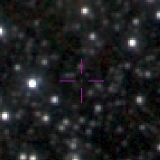
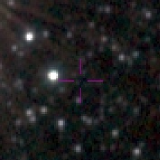
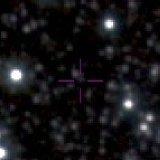
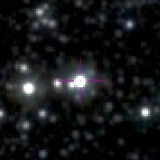
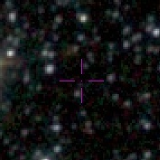
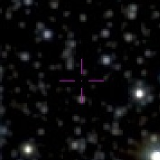
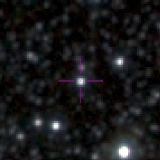
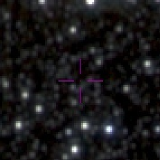
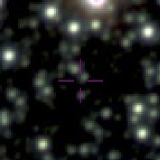
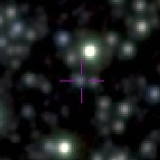
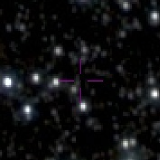
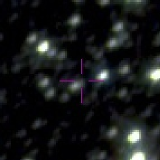
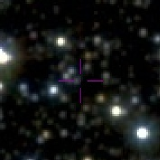
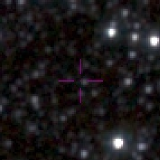
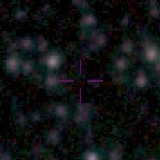
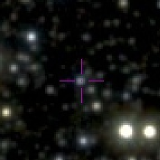
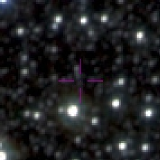
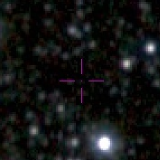
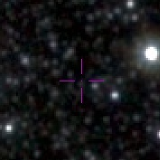
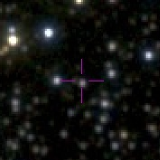
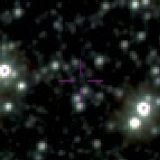
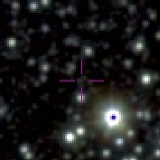
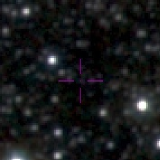
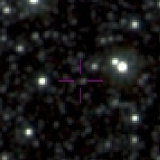
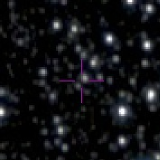
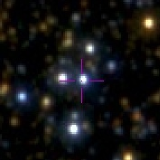
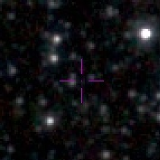
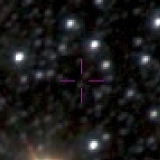
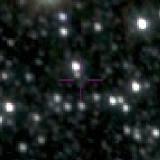
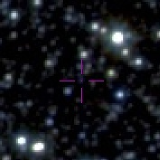
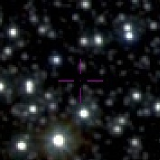
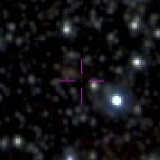
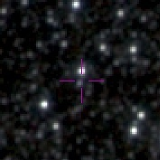
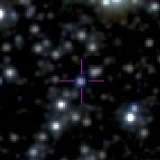
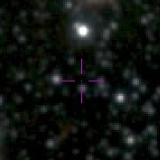
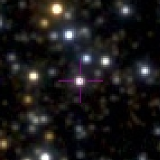
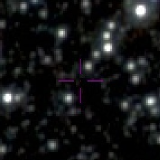
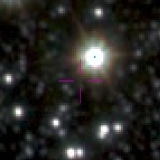
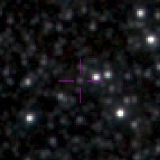
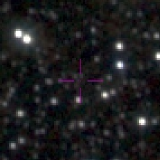
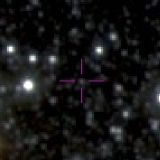
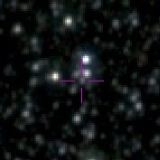
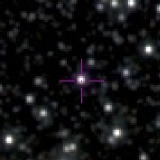
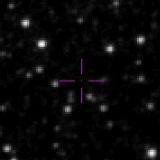
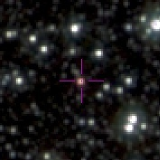
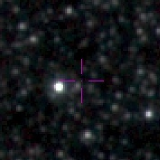
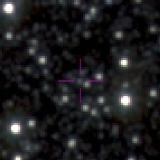
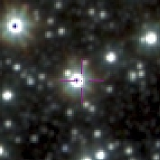
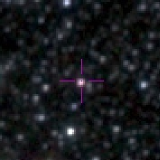
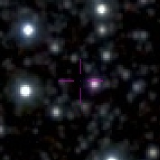
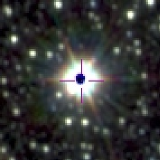
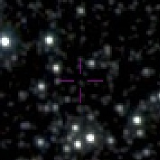
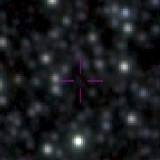
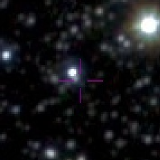
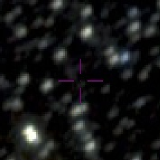
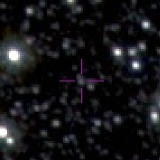
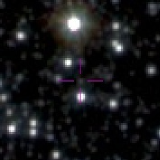
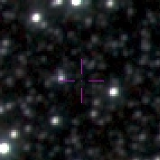
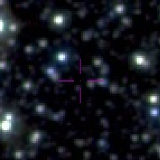
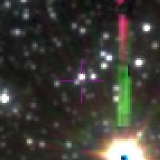
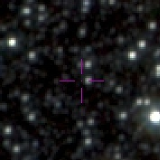
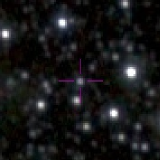
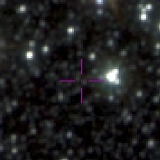
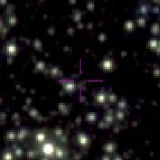
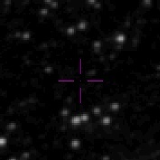
Appendix A VVV Novae finding charts
In this section we present the finding charts for all Novae in the VVV Survey area, listed in Table 1. In most cases the charts are composite images, unless when explicitly marked as a -band image. All charts are in size, oriented in Galactic coordinates, with the positive Galactic longitude pointing up. A cross marks the coordinates given by the catalogue and helps one to check the notes we adopted in Table 1.