Identifying low-dimensional dynamics in Type-I edge-localised-mode processes in JET plasmas
Abstract
Edge localised mode (ELM) measurements from reproducibly similar plasmas in the Joint European Torus (JET) tokamak, which differ only in their gas puffing rate, are analysed in terms of the pattern in the sequence of inter-ELM time intervals. It is found that the category of ELM defined empirically as Type I - typically more regular, less frequent, and having larger amplitude than other ELM types - embraces substantially different ELMing processes. By quantifying the structure in the sequence of inter-ELM time intervals using delay time plots, we reveal transitions between distinct phase space dynamics, implying transitions between distinct underlying physical processes. The control parameter for these transitions between these different ELMing processes is the gas puffing rate.
I INTRODUCTION
Enhanced confinement operating regimes (H-mode) in magnetically confined plasmas are accompanied by pulses of energy and particle release known as edge localised modes (ELMs) Keilhacker et al. (1984); Erckmann et al. (1993); Zohm (1996); Loarte et al. (2003); Kamiya et al. (2007); Hawryluk et al. (2009). At steady state, a magnetically confined tokamak plasma comprises a family of nested magnetic flux surfaces in a smooth, or laminar state. ELMing constitutes a relaxation process, for the edge region of H-mode plasmas, which encompasses an initial trigger for linear MHD instability evolving into a fully nonlinear detached state, such that structures propagate to the first wall where they generate recombination radiation. In parallel, local temperature and pressure gradients evolve rapidly. The onset of ELMing accompanies a sharp transition in the global state of the tokamak plasma, and changes in observed ELM character reflect changes in externally applied drive such as gas puffing and heating. Control, mitigation and prediction of the occurrence of large Type I ELMs are central challenges for magnetic confinement fusion plasma physics. There are many active experimental campaigns in this area Evans et al. (2006); Liang et al. (2007); Kirk et al. (2012), particularly in support of the future ITER tokamak, for which the consequences of uncontrolled Type I ELMs may be unacceptable Loarte et al. (2003); Hawryluk et al. (2009). While successful theories for some component elements of the ELMing process have been constructed, there is currently no comprehensive first principles model that incorporates all of the physical effects that are known to contribute to the ELMing process. ELM categorisation is primarily phenomenological Zohm (1996); Loarte et al. (2003); Kamiya et al. (2007), furthermore it is not always easy to discriminate in real time between Type I and, say, Type III ELMing. Hitherto only a few papers Degeling et al. (2001); Greenhough et al. (2003) have addressed measured ELM sequences as the pulsed outputs of a nonlinear system, a field where generic analysis techniques are well developed and potential links to ELMing have long been apparent Itoh et al. (1991). Characterisation of ELMing processes by applying dynamical systems theory to the data offers a fresh avenue to understanding, prediction and control, and may help identify some of the key properties that models for Type I ELMing must embody. Here we take the first steps.
D. Ruelle and F. TakensRuelle and Takens (1971) initiated a classical scenario for the transition from ordered to disordered flow in fluids with increasing driving control parameterNewhouse et al. (1978); Trefethen et al. (1993). This has been observed in Rayleigh-Bénard convection in fluids Bodenschatz et al. (2000); Ahlers (1974); Gollub and Swinney (1975); Gollub and Benson (1980); Libchaber et al. (1983), and in drift wave turbulence Klinger et al. (1997) and flute instabilities in plasmas Brochard et al. (2006). Oscillatory behaviour arises either if there is a constant of the motion, or if there is a limit cycle onto which the system dynamics is attracted in the presence of damping or dissipation. In the present case, where the system is the plasma undergoing the ELMing process, the nature and number of the relevant phase space co-ordinates is not known from first principles. Progress towards their identification can nevertheless be made by applying techniques of dynamical systems analysis to visualize changes in the topology of the phase space. A convenient method is that of ‘delay plots’, that is, to plot the successive time intervals between crossings of a surface of section in the phase spaceMatsoukis et al. (2000); Devine and Chapman (1996); Schreiber and Schmitz (2000).
In this article we report the application of delay plots to the measured time intervals or waiting times between successive ELMs. We consider ELM sequences from six similar plasmas in the JET tokamak, including JET plasma where the H-mode closely approaches an ITER operating regime with respect to some, but not all, key dimensionless parameters Pamela et al. (2005). We obtain evidence that Type I ELMing in these plasmas exhibits transitions between processes with distinct physical analogues, dependent on the value of the gas puffing rate as control parameter. In all six plasmas the toroidal magnetic field density is 2.7T, the plasma current is 2.5MA, neutral beam and ion cyclotron resonance heating power are 13.5MW and 2.0MW respectively, and the confinement factor is in the range to . In all six plasmas, gas puffing terminates at s and neutral beam heating is ramped down from to s. The differences in Type I ELM character are largely determined by the different levels of externally applied gas puffing. The intensity of the signal, which sometimes saturates, is not necessarily a reliable proxy for the magnitude of the underlying ELM plasma phenomenon, whereas occurrence times are well defined. ELM occurrence and ELM waiting times are the primary physical indicators addressed in the present study. The moment of occurrence of each ELM is inferred from the datasets using an algorithm similar to that described in Greenhough et al. (2003), which exploits the steep leading edge of each ELM. This procedure generates a sequence of event times for each th ELM, and hence inter-event times . These sequences are used to construct delay plots, which are knownSchreiber and Schmitz (2000); Matsoukis et al. (2000); Devine and Chapman (1996) to capture aspects of the topology of the unknown underlying phase space evolution of the system.
II RESULTS AND DISCUSSIONS
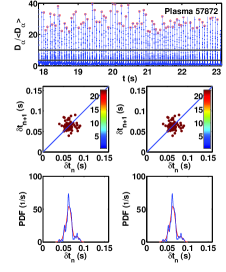
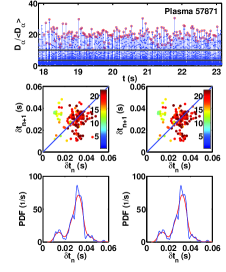
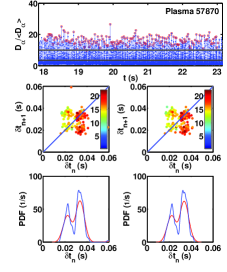
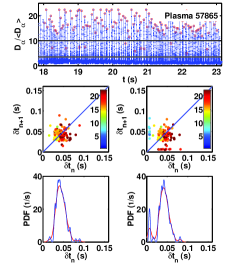
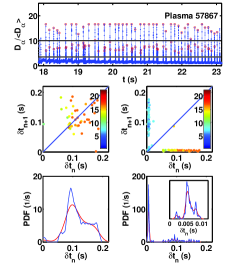
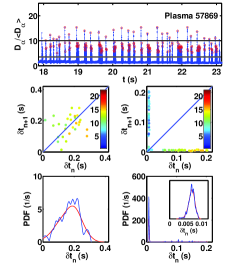
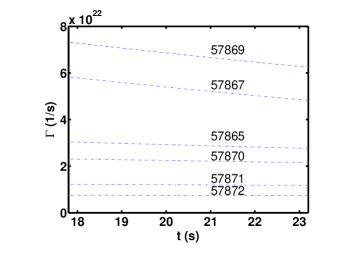
Figures 1 and 2 show measured Type I ELM signals for a sequence of six JET H-mode plasmas , where is , , , , , and in order of increasing magnitude and duration of the gas puffing rate, shown in Fig. 3, which is the key external control parameter. The upper trace in each panel of Figs. 1 and 2 plots the time-evolving intensity of Lyman alpha recombination radiation from deuterium, , measured by a camera directed at the inner divertor, normalised by the mean measured intensity. The two groupings of three plasmas are at lower (Fig. 1) and higher (Fig. 2) gas puffing rates. At lower gas puffing rates (Fig. 1) the ELM signal intensity is roughly the same across each time series, whereas at higher gas puffing rates (Fig. 2) this shows a rich structure. We will investigate this structure by sorting the ELM events that are used to construct the time series of inter-ELM time intervals (delay times), in terms of whether they exceed a threshold in signal intensity; the thresholds used are indicated by horizontal lines on the ELM time series (top panel in Figs 1 and 2). Each th Type I ELM that has signal intensity exceeding a given threshold then forms a set of events at time with the delay between events . The middle panels of Figs. 1 and 2 show the delay plots for a given threshold, that is, versus . The signal intensity for the ELM at is indicated by colour coding. These delay plots reflect the topology of the system phase space. For a trajectory that is approximately singly periodic the delay plot will exhibit a single concentration of points on the line, centred on the mean period . The spread of points about the mean period reflects a combination, in unknown proportions, of intrinsic and extrinsic sources of irregularity in a quasi-regular process, and determines the practical resolution limit of this method. A period-two oscillation will generate two concentrations of points, symmetrically placed either side of the line. Dynamical switching between one period and another at will generate four concentrations of points: at the two distinct periods and on the line, and at two locations symmetrically placed either side of the line, at coordinates and .
The number of ELMs evaluated in these six JET plasmas ranges between 79 and 197. The mean inter-ELM time interval is in the range 25 to 60ms. The delay plots in Fig. 1 are insensitive to the threshold, in marked contrast to Fig. 2, suggesting that these reflect distinct processes. In Fig. 1, plasmas with successively greater gas puffing rates are shown from left to right. We can see that increased gas puffing causes the ELMing process to bifurcate from singly periodic (), via transitional behaviour (), to a situation where two periods are present () together, with the plasma switching between them. This behaviour is approximately analogous to that of small amplitude oscillations of two weakly coupled pendulums with different natural frequencies. It is also apparent that a longer delay time before an ELM correlates statistically with a larger signal intensity. The bottom pair of plots in each panel of Figs. 1 and 2 displays the probability density functions (pdfs) for the distributions of measured for the ELM time series using the same amplitude thresholds as for the delay plots; in Fig. 1, unlike Fig. 2, these two panels are identical.
We now turn to Fig. 2 which corresponds to higher overall levels of gas puffing rate. It displays a transition in the ELMing process as the gas puffing rate is increased, which is different to that seen in Fig. 1. Each ELM with large signal intensity is statistically likely to be rapidly followed by a population of postcursor ELMs with smaller signal intensity. The likelihood of a postcursor ELM, and their number, increases with gas puffing rate. As a consequence, the delay plots constructed for different thresholds now, unlike Fig. 1, show different structure. At relatively low gas puffing rate (left hand plots) most delays fall within a single group on the line. However when the threshold is reduced, smaller postcursor events begin to feature in the time series of delays and result in populations (lines parallel to the axes) far from the line, and a new, narrowly constrained group on the line at small . As the gas puffing rate is increased, these small postcursor events come to dominate numerically. It is noteworthy that whereas ELMs with large signal amplitude exhibit a broad inter-ELM time interval distribution, the distribution of the postcursors is very sharply defined and is invariant between the three JET plasmas, see Fig. 2 bottom panels. Its inverse defines a potentially important characteristic frequency of the ELMing process. This process, as seen in the delay plots, is analogous to random large amplitude transient impulses driving a system that has a narrowband resonant frequency response.
Figure 3 displays the gas puffing rates for all six JET plasmas. The clear changes in ELMing displayed in Fig. 1, and for JET plasmas 57867 to 57869, arise under comparatively small changes in gas puffing, while there is a relative large step (a factor of approximately two) between 57865 and 57867. Other ELM interval dynamics are in principle possible for other gas fuelling rates, especially for fuelling rates between those of 57865 and 57867, for these otherwise identical plasma operating regimes.
Some previous experiments have observed that Type I ELM frequency (mean inter-ELM interval) increases with gas puffing rateMcDonald et al. (2008). Moreover, early theoretical studiesLönnroth et al. (2003) suggested that it might be possible to explain the experimentally observed transition from Type I to Type III ELMy H-mode triggered by strong gas puffing, as well as the subsequent increase in ELM frequency and deterioration of plasma confinement, as a transition from second to first stability (either ideal or resistive modes). However, there is still no widely accepted model for the overall ELMing process or processes.
III SUMMARY
We have exploited the similarity of these six JET plasmas which all have exceptionally long duration 5 of the quasi-stationary ELMing process, and which appear to have only one effective control parameter, the gas puffing rate. These particular experiments yield a sufficient number of ELMs and inter-ELM times, to enable us to apply the delay plot technique to characterize the dynamics.
There exists an increasing number of ELMing regimes. These are typically characterized phenomenologically and in terms of bulk plasma parameters. We believe that ELM interval analysis of the kind presented here, if applied more widely, will help shed light on such transitions in confinement phenomenology in tokamak plasmas. In particular, demonstrating and quantifying the effectiveness of ELM control and mitigation techniques will be assisted by characterizing the measured sequences of inter-ELM time intervals in this way.
Acknowledgements.
This work, supported by the European Communities under the contract of Association between EURATOM and CCFE, was carried out within the framework of the European Fusion Development Agreement. The views and opinions expressed herein do not necessarily reflect those of the European Commission. This work was also part-funded by the RCUK Energy Programme under grant EP/I501045. We acknowledge the UK EPSRC and the Chilean committee of science and technology, CONICYT, for support.References
- Keilhacker et al. (1984) M. Keilhacker, G. Becker, K. Bernhardi, A. Eberhagen, M. ElShaer, G. FuBmann, O. Gehre, J. Gernhardt, G. Gierke, E. Glock et al., Plasma Phys. Controlled Fusion 26, 49 (1984).
- Erckmann et al. (1993) V. Erckmann, F. Wagner, J. Baldzuhn, R. Brakel, R. Burhenn, U. Gasparino, P. Grigull, H. J. Hartfuss, J. V. Hofmann, R. Jaenicke et al., Phys. Rev. Lett. 70, 2086 (1993).
- Zohm (1996) H. Zohm, Plasma Phys. Controlled Fusion 38, 105 (1996).
- Loarte et al. (2003) A. Loarte, G. Saibene, R. Sartori, D. Campbell, M. Becoulet, L. Horton, T. Eich, A. Herrmann, G. Matthews, N. Asakura et al., Plasma Phys. Controlled Fusion 45, 1549 (2003).
- Kamiya et al. (2007) K. Kamiya, N. Asakura, J. Boedo, T. Eich, G. Federici, M. Fenstermacher, K. Finken, A. Herrmann, J. Terry, A. kirk et al., Plasma Phys. Controlled Fusion 49, S43 (2007).
- Hawryluk et al. (2009) R. J. Hawryluk, D. J. Campbell, G. Janeschitz, P. R. Thomas, R. Albanese, R. Ambrosino, C. Bachmann, L. Baylor, M. Becoulet, I. Benfatto et al., Nucl. Fusion 49, 065012 (2009).
- Evans et al. (2006) T. E. Evans, R. A. Moyer, K. H. Burrell, M. E. Fenstermacher, I. Joseph, A. W. Leonard, T. H. Osborne, G. D. Porter, M. J. Schaffer, P. B. Snyder et al., Nat. Phys. 2, 419 (2006).
- Liang et al. (2007) Y. Liang, H. R. Koslowski, P. R. Thomas, E. Nardon, B. Alper, P. Andrew, Y. Andrew, G. Arnoux, Y. Baranov, M. Bécoulet et al., Phys. Rev. Lett. 98, 265004 (2007).
- Kirk et al. (2012) A. Kirk, J. Harrison, Y. Liu, E. Nardon, I. T. Chapman and P. Denner (the MAST team), Phys. Rev. Lett. 108, 255003 (2012).
- Degeling et al. (2001) A. W. Degeling, Y. R. Martin, P. E. Bak, J. B. Lister and X. Llobet, Plasma Phys. Controlled Fusion 43, 1671 (2001).
- Greenhough et al. (2003) J. Greenhough, S. C. Chapman, R. O. Dendy and D. J. Ward, Plasma Phys. Controlled Fusion 45, 747 (2003).
- Itoh et al. (1991) S.-I. Itoh, K. Itoh, A. Fukuyama and Y. Miura, Phys. Rev. Lett. 67, 2485 (1991).
- Ruelle and Takens (1971) D. Ruelle and F. Takens, Commun. Math. Phys. 20, 167 (1971).
- Newhouse et al. (1978) S. Newhouse, D. Ruelle and F. Takens, Commun. Math. Phys. 64, 35 (1978).
- Trefethen et al. (1993) L. N. Trefethen, A. E. Trefethen, S. C. Reddy and T. A. Driscoll, Science 261, 578 (1993).
- Bodenschatz et al. (2000) E. Bodenschatz, W. Pesch and G. Ahlers, Annu. Rev. Fluid Mech. 32, 709 (2000).
- Ahlers (1974) G. Ahlers, Phys. Rev. Lett. 33, 1185 (1974).
- Gollub and Swinney (1975) J. P. Gollub and H. L. Swinney, Phys. Rev. Lett. 35, 927 (1975).
- Gollub and Benson (1980) J. P. Gollub and S. V. Benson, J. Fluid Mech. 100, 449 (1980).
- Libchaber et al. (1983) A. Libchaber, S. Fauve and C. Laroche, Physica D 7, 73 (1983).
- Klinger et al. (1997) T. Klinger, A. Latten, A. Piel, G. Bonhomme, T. Pierre and T. Dudok de Wit, Phys. Rev. Lett. 79, 3913 (1997).
- Brochard et al. (2006) F. Brochard, E. Gravier and G. Bonhomme, Phys. Rev. E 73, 036403 (2006).
- Matsoukis et al. (2000) S. K. Matsoukis, S. Chapman and G. Rowlands, Physica D 138, 251 (2000).
- Devine and Chapman (1996) P. E. Devine and S. C. Chapman, Physica D 95, 35 (1996).
- Schreiber and Schmitz (2000) T. Schreiber and A. Schmitz, Physica D 142, 346 (2000).
- Pamela et al. (2005) J. Pamela, J. Ongena and J. E. Contributors, Nucl. Fusion 45, S63 (2005).
- McDonald et al. (2008) D. C. McDonald, Y. Andrew, G. T. A. Huysmans, A. Loarte, J. Ongena, J. Rapp and S. Saarelma, Fusion Sci. Technol. 53, 891 (2008).
- Lönnroth et al. (2003) J.-S. Lönnroth, V. V. Parail, G. Corrigan, D. Heading, G. Huysmans, A. Loarte, S. Saarelma, G. Saibene, S. Sharapov, J. Spence et al., Plasma Phys. Controlled Fusion 45, 1689 (2003).