Late Time X-ray, IR and Radio Observations of the Tidal Disruption Event Galaxy NGC 5905
Abstract
NGC 5905 is one of the few galaxies with no prior evidence for an active galactic nucleus (AGN) in which an X-ray flare was detected by the ROSAT All Sky Survey (RASS) in 1990-91. Follow-up studies showed that the X-ray flare was due to the tidal disruption of a star by the massive black hole in the center of the galaxy. In this study we present analysis of late-time follow-up observations of NGC 5905 using Chandra archival data, Spitzer archival data, GMRT 1.28 GHz radio observations and VLA 3 GHz and 8 GHz archival data. The X-ray image shows no compact source that could be associated with an AGN. Instead, the emission is extended – likely due to nuclear star formation. The total measured X-ray luminosity from this extended emission region is comparable to the X-ray luminosity determined from the 2002 Chandra observations and is a factor of 200 less than the peak of the X-ray flare observed in 1990. Diffuse X-ray emission was detected close to the circum-nuclear star forming ring. The Spitzer 2006 mid-infrared spectrum also shows strong evidence of nuclear star formation but no clear AGN signatures. The semi-analytical models of Tommasin et al. (2010) together with the measured [OIV]/[NeII] line ratio suggest that at most only 5.6% of the total IR Flux at 19 m is being contributed by the AGN. The GMRT 1.28 GHz observations reveal a nuclear source. In the much higher resolution VLA 3 GHz map, the emission has a double lobed structure of size 2.7′′ due to the circumnuclear star forming ring. The GMRT 1.28 GHz peak emission coincides with the center of the circumnuclear ring.
We did not detect any emission in the VLA 8 GHz (1996) archival data. Instead we give upper limits to the radio afterglow of the tidal disruption event (TDE) using 3 upper limits where is the map noise. The 3 limits at 1.28 GHz, 3 GHz and 8 GHz are 0.17 mJy, 0.09 mJy and 0.09 mJy, respectively. Our studies thus show that (i) NGC 5905 has a declining X-ray flux consistent with a TDE, (ii) the IR flux is dominated by nuclear star formation, (iii) the nuclear radio emission observed from the galaxy is due to circumnuclear star formation, (iv) no compact radio emission associated with a radio afterglow from the TDE is detected.
Keywords Galaxies: spiral - Galaxies: individual (NGC 5905) - Galaxies: nuclei - Galaxies: X-ray - Galaxies: active - X-rays - radio continuum - infrared radiation.
1 Introduction
Tidal disruption of stars at the centers of galaxies are indicators for the presence of supermassive black holes (SMBHs) in their nuclei. Theoretical studies show that when a star passes close to a SMBH it can be tidally disrupted. The tidal disruption event (TDE) results in about half of the stellar mass falling into the black hole, while the remaining tidal debris is ejected out from its orbit (Rees, 1988; Ulmer, 1999; Strubbe and Quataert, 2009). This tidal debris will fall back onto the accretion disk and result in enhanced accretion rates and outflows that can persist over much longer timescales than the actual TDE (see Bower et al. 2013 and references therein). Radio jets can be triggered by the infalling debris but the timescale depends on the accretion rates. In some cases they can be triggered several years after the TDE (Bower, 2011) and will appear as compact emission associated with the nucleus. In this paper, we analyze late time multi-wavelength observations of the TDE in NGC 5905 with a special focus on searching for radio jets that may be triggered by the TDE. Late time radio emission can arise from within the jet itself (van Velzen et al., 2011) or from the interaction of the radio jet with the circumnuclear medium (Giannios and Metzger, 2011). The resulting blast wave expands into the surrounding circumnuclear gas and later enters a slower Sedov-Taylor expansion phase which can be detected in radio emission several years after the TDE. Since most of the TDE host galaxies are at distances of several Mpc (Esquej et al., 2012; Saxton et al., 2012a; Cappelluti et al., 2009; Gezari et al., 2009, 2008), the radio jets will appear as compact nuclear emission. To date only a few TDEs have been detected in radio emission. Two recent TDEs that were detected in and X-ray emission showed variable radio emission that decayed over a timescale of months (Bloom et al., 2011; Zauderer et al., 2011). Another source IC 3599, that was detected in X-ray by ROSAT showed, however, late time radio emission (Bower et al., 2013). This indicates that late time radio jets or a radio afterglow due to jet-cloud interaction can be observed in TDEs. Bower et al. (2013) also included NGC 5905 in their study but they did not detect any compact radio source.

| Wave- | Instrument | Date of Observation | Exposure,Obs-Id |
|---|---|---|---|
| length | time | ||
| X-ray | ACIS-S | 2007-06-07 | 44.95 ks (7728) |
| 2007-06-09 | 26.95 ks (8558) | ||
| Radio | GMRT 1.28 GHz | 2011-06-10 | 2 hours |
| VLA FIRST | May 1997 | …. | |
| VLA 3 GHz | 2012-06-04 | 15 min | |
| VLA 8 GHz (archive) | 1996-11-03 | 45 min | |
| IR | Spitzer/IRS | 2006-01-16 | SH 30s 2 cycles |
| LH 60s 2 cycles |
ROSAT All-sky survey (RASS) discovered an X-ray flare in NGC 5905 in 1990. During the X-ray flare the soft X-ray luminosity reached a peak of ergs s-1 (assuming an absorbed powerlaw spectral model with cm-2, a power law index of 4 and distance 47.8 pc) and decreased below ergs s-1 within 5 months of the X-ray outburst (Bade et al., 1996). Very few cases of X-ray outbursts of variability amplitude greater than 80 have been observed (Donley et al., 2002; Esquej et al., 2007; Saxton et al., 2012b; Maksym et al., 2010). Follow-up X-ray observations using ROSAT and Chandra show that the X-ray luminosity of the galaxy declined as , as expected in the event of tidal disruption of a star near the central BH (Rees, 1988; Komossa and Bade, 1999; Halpern et al., 2004). Using the stellar velocity dispersion in the bulge of NGC 5905 (, Ho et al., 2009) and the calibration (Gültekin et al., 2009), the calculated mass of the nuclear BH in NGC 5905 is . This is consistent with the upper limit of derived by assuming that the 1990 X-ray flare was due to tidal disruption of a star (Halpern et al., 2004). Hence the nucleus of NGC 5905 may have a SMBH of mass .
NGC 5905 is a barred spiral galaxy (SB(r)b type) at a distance of 47.8 Mpc (z=0.011 and H0=73 km s-1 Mpc-1). It is classified as a giant low surface brightness (GLSB) galaxy because of its low surface brightness optical disk (Kent 1985; Sprayberry et al. 1995). Like most GLSB galaxies, it is relatively poor in star formation (van Moorsel, 1982) but it does have a bright bulge and nuclear star formation. H observations reveal a circum-nuclear ring of star formation of 1 kpc in diameter (Mazzuca et al., 2008; Comeron et al., 2010). Ground based optical observations of NGC 5905 classified the nucleus as an HII or starburst type nucleus (Giuricin et al. 1990, Ho et al. 1995). However, post-outburst Hubble Space Telescope/Space Telescope Imaging Spectroscopy (HST/STIS) observations place it in the low luminosity Seyfert 2 category depending on the estimated line ratios (Gezari et al., 2003). These observed lines could not be explained as arising due to photoionization of clouds surrounding the central BH illuminated by the soft X-ray flare observed in 1990. But at the same time no direct evidence for a non-stellar continuum was found that could explain the observed line ratios. Thus it is not clear whether there is an AGN in NGC 5905 but weak AGN activity cannot be ruled out. Although, in general, AGNs are rare in GLSB galaxies and the BH masses are lower than those observed in normal galaxies (Ramya et al., 2011; Naik et al., 2010).
In this study we take a closer look at the late time nuclear emission from NGC 5905. We first examine the 2007 X-ray observations to constrain the decay of the X-ray flare. We then examine the Spitzer, Chandra and radio data to see if there is a weak AGN in the galaxy (both the Chandra and Spitzer data, though archival, are previously unpublished). Finally we investigate the radio emission using both the VLA 3 GHz data (analyzed as part of Bower et al., 2013) as well as low frequency GMRT 1.28 GHz data. We compare the 3 GHz and 1.28 GHz maps at different resolutions to see if there is a radio jet/afterglow associated with the TDE. We have also re-analyzed the VLA 8 GHz archival data of 1996. Throughout the paper luminosity of the source is estimated assuming for NGC 5905 and .
2 Observations and Analysis
2.1 Chandra X-ray observations
NGC 5905 was observed using the Advanced CCD Imaging Spectrometer (ACIS) on board the Chandra X-ray telescope twice in 2007. Table 1 gives the details of the observations. Sometimes large flares are detected in the ACIS background light curve and if such flares are detected during the observation then data recorded during the background flares should be filtered111Chandra memo for ACIS background flares. No background flares were detected in the ACIS background light curves extracted from the 2007 observations.
Chandra 2007 data was used to extract (a) the X-ray light curve of NGC 5905, (b) the image of NGC 5905 in two X-ray energy bands, (c) the X-ray spectrum of the central region and (d) the image of diffuse X-ray emission. We first examined the source light curve for X-ray flux variability using the Chandra task glvary. The source light curve extracted using glvary takes into account the variability due to dithering and optimizes the bin time for the light curve accordingly. A quick look at the light curve in Figure 1 shows no count rate variability. From the results of glvary we find that the probability that the observed signal is variable is 0.2 and the variability index is 0 implying that no variability was observed during the 2007 observations of NGC 5905.
| Component I | Component II | ||||||||
| Model | Norm | kT | Norm | dof | |||||
| () | photons cm-2keV-1 | keV | |||||||
| wabs(raymond) | (fixed) | – | – | ||||||
| wabs(pwlw+bb)a | |||||||||
| wabs(pwlw)a | – | – | |||||||
| wabs(bb)b | – | – | |||||||
| wabs(bb)b | (fixed) | – | – | ||||||
aFixing the value to the Galactic cm-2 gives a bad fit with
bReduced is greater than 2 and hence no uncertainties on the fitted parameters can be calculated
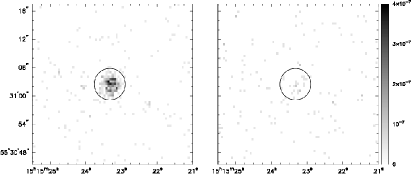
Since the source flux did not vary during the two observations of 2007, we merged the events obtained from both the pointings and made a combined image of NGC 5905 with better statistics in two energy bands namely 0.5-2.0 keV and 2.0-7.0 keV. Before merging the events, we matched the aspect solution of Obs-Id 8558 to that of Obs-Id 7728 using an X-ray point source in the field of view located at RA 15h 15m 18.254s and Dec +55∘ 32′ 53.71′′. Since both the observations have similar pointing offsets of 0.005’, the shift is very small, and , corresponding to a physical shift in x-direction of -0.06 pixels and in y-direction of -0.11 pixel. After reprojecting the events to a different tangent point using the matched aspect solution, combined images in the two energy bands were extracted using the task fluximage. Figure 2 shows the exposure corrected image of NGC 5905 in the two energy bands. No central peak near or at the location of the optical center is seen in either of the X-ray images. The observed image of the nuclear region of NGC 5905 is a cluster of bright pixels at the 0.5-2.0 keV energy range. On the other hand NGC 5905 is hardly discernible above the background in the (2.0-7.0) keV energy image. The number of counts within the 3.5′′ radius nuclear region marked in Figure 2 is 213 and 30 in the 0.5-2.0 keV and 2.0-7.0 keV energy bands, respectively. This gives a hardness ratio of 0.7 for the nuclear region of NGC 5905.
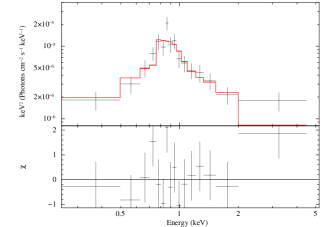
The spectrum of NGC 5905 is extracted from a circular region of 3.5′′ radius, shown in Figure 2. We extracted the spectra and responses separately for the two pointings and then co-added them to get a final combined spectrum. Corresponding background spectra were extracted from a source free region on the CCDs. The spectra and corresponding responses were extracted using the task specextract and coadded using the task combine_spectra. We grouped the combined spectrum such that each energy bin has 15 counts. Figure 3 shows the spectrum of NGC 5905 with the best fit model which describes the observed X-ray spectrum as emission due to hot, diffuse gas.
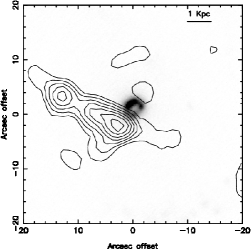
To derive the diffuse emission in NGC 5905 we followed the procedure used in Das et al. (2009). The field of view of CCD-Id: 7 was used and only events in the energy band of 0.5-7.0 keV were included. First, sources in the field of view were detected using wavdetect and then separate source and background region files for the detected sources were created using roi and splitroi. The source count rates were replaced by corresponding background counts for each source region and an image for each pointing was created by dmfilth. Images and exposure maps, thus created for each pointing, were combined using the tasks reproject_image_grid and reproject_image. The combined diffuse emission image was first exposure-corrected and then divided by the exposure map to produce the required flux image. We detected weak, diffuse emission near the nucleus of NGC 5905. The peak emission has a value approximately 14 times the background emission and this emission lies close to the circumnuclear ring of star formation, as shown in Figure 4, where the contours of the diffuse emission are overlaid on the H image which is obtained from the Atlas of Images of NUclear Rings (AINUR, Comeron et al., 2010).
| Line | Wavelength | Fluxes |
|---|---|---|
| element | () | () |
| 11.25 | ||
| 12.82 | ||
| 15.55 | ||
| 18.71 | ||
| 25.89 | ||
| 24.52 | ||
| 33.48 | ||
| 34.8 |
2.2 Spitzer mid-infrared observation
The mid-infrared data were retrieved from the Spitzer archival spectroscopic observations (Program ID: IG-A02120140, PI: A. Zezas) obtained with the infrared spectrograph (IRS, Houck et al., 2004). The observations were taken with the short-high (SH) and long-high (LH) modules covering the spectral ranges m and m, respectively. The slit width was for SH and for LH. The observations were reduced following the procedure described in detail by Pereira-Santaella et al. (2010).
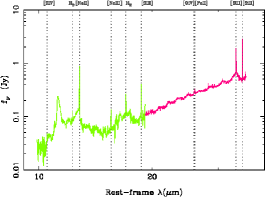
Several fine structure lines are observed in the spectrum along with the polycyclic aromatic hydrocarbon (PAH) feature (see Fig. 5). The measured line fluxes are given in Table 3. To measure the flux and equivalent width (EW) of the 11.3m PAH feature we used the method of Hernán-Caballero and Hatziminaoglou (2011), which models the feature using a Lorentz function. There is no indication of the presence of the [NeV] lines at m and m and we put upper limits on their line fluxes at and , respectively. The measured value of the equivalent width (EW) of the PAH feature is m which is typical of high metallicity star-forming galaxies (see Hernán-Caballero and Hatziminaoglou, 2011).
2.3 Radio Data
| Beam | Peak | Noise | Total | Fitted | |
|---|---|---|---|---|---|
| (GHz) | Flux | (mJy/b) | Flux | Size | |
| (mJy/b) | (mJy) | ||||
| 1.28 | 3.84 | 0.12 | 9.26 | ||
| 1.42 | 6.44 | 0.15 | 9.48 | ||
| 3.0 | 1.04 | 0.03 | 6.18 | ||
| 8.0 | … | 0.030 | … | … | |
| 1.28a | 1.32 | 0.15 | 3.07 | ||
| 1.28b | … | 0.20 | … | ||
| 3.0a | 0.42† | 0.02 | 1.87 | … | |
| 3.0b | 0.18‡ | 0.03 | 0.23 | … |
a uv cutoff 20 k †left lobe
b uv cutoff 40 k ‡right lobe
(i) 1.28 GHz : NGC 5905 was observed during June 2011 in radio continuum
at 1.28 GHz using the Giant Metrewave Radio Telescope (GMRT) located
near Pune, India (Ananthakrishnan and Pramesh
Rao, 2001).
Nearby radio sources, 1438+621 and 3C 286, were used for
phase and flux calibrations, respectively. NGC 5905 had a two hour scan. The data were
analyzed using AIPS222Astronomical Image Processing
System (AIPS) is distributed by NRAO which is a facility of NSF
and operated under cooperative agreement by Associated Universities, Inc. (Greisen, 2003)
and iteratively edited and calibrated until satisfactory gain
solutions were obtained. Low resolution (robust 5) and
high resolution (robust 0) maps were made using IMAGR.
Lower end UV cutoffs of 20 k and 40 k (i.e. baselines smaller than 20 or 40 k
were omitted) were applied to see if there was any compact nuclear emission.
(ii) 1.435 GHz : We used the VLA Faint Images of the Radio Sky at Twenty-Centimeters
(FIRST) map333Faint Images of
the Radio Sky at Twenty-Centimeters (Becker et al., 1995) to determine flux at this frequency. The observations were
from the epoch May, 1997.
(iii) 3 GHz : Observations were done in B configuration using the VLA in June 2012.
For further details see Bower et al. (2013). We made robust 0 and robust 5 maps. Lower end UV cutoffs of
20 k and 40 k were applied to obtain higher resolution images and to check if there was
any compact nuclear emission.
(iv) 8 GHz : We used 8 GHz radio data from the VLA archive; the observations
were from the epoch November, 1996 and were taken in the A configuration. We analyzed
the data using AIPS; 1331+305 and 1510+570 were used as flux and phase calibrators, respectively.
The map noise was 29.9 Jy/beam, where the beam is 0.28,
and is consistent with the earlier analysis of Komossa and
Dahlem (2001). We did not detect any compact emission
in either robust=0 or robust=-5 (highest resolution) maps. The 5 upper limit to any radio
afterglow is thus 150 Jy and is consistent with the upper limit given by
Komossa and
Dahlem (2001)
3 Results
3.1 Long term behavior of X-Ray Luminosity of NGC 5905
The best fit model (emission due to hot diffuse gas) to the 2007 X-ray spectrum yields the X-ray flux of the source as in the energy band of (also see Table 2). We also tried other models, the details of which are presented in Table 2. The powerlaw model with variable gives a very high value for the powerlaw index. A purely powerlaw model with absorption column density fixed to galactic value () gives a very poor fit. We also tried an absorbed blackbody model with variable and fixed values but both the models give poor fits. We also tried to model the spectrum as thermal bremsstrahlung but the resultant fit was very poor. For comparison, the 0.1-2.4 keV X-ray luminosity of NGC 5905 during the 2007 Chandra observations is a factor of less than the luminosity observed during the peak of the X-ray flare in 1990.
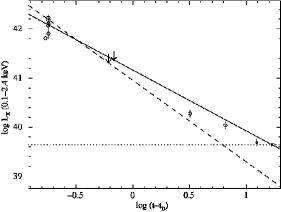
Figure 7 shows a plot of the long term variation in the observed X-ray luminosity of the source since the 1990 X-ray flare. The luminosities used in this plot are listed in table 5. It is clear that the X-ray luminosity estimated from the 2002 and 2007 Chandra observations are comparable within errors. We note here that, for the ROSAT observations, we use the observed count rates given in Li et al. (2002) to estimate the flux of NGC 5905 using WebPIMMS444http://asc.harvard.edu/toolkit/pimms.jsp and assuming a blackbody spectrum of . The declining X-ray luminosity is best fit with where , plus a constant luminosity due to nuclear star formation. The dashed line in figure 7 is the predicted theoretical TDE curve with used to explain the 1990 X-ray flare of NGC 5905 (Li et al., 2002; Halpern et al., 2004) and the dotted line represents the constant luminosity due to nuclear star formation. The we get from our fitting depends on the value of which is fixed; hence the real value might be much closer to than indicated here.
3.2 Diffuse X-ray Emission
We have detected faint diffuse X-ray emission (when the bright patch of pixels at the optical location of NGC 5905 are subtracted) from within the bulge, about from the galaxy center. The AINUR H image of NGC 5905 shows the presence of a central ring of nuclear star formation (Comeron et al., 2010). Figure 4 is an overlay of the X-ray diffuse emission contours on this H map. There is no strong spatial correlation between the H and the diffuse X-ray emission. Therefore this diffuse X-ray emission could be due to gas infall associated with the large scale bar in the galaxy and the formation of the nuclear ring.
3.3 No AGN signatures in X-Ray, IR or Radio emission
The X-ray image of NGC 5905 (Figure 2) is a cluster of bright pixels. This cluster of bright pixels are clearly visible in the 0.5-2.0 keV energy band and are very faint in the 2.0-7.0 keV energy band. From the photon counts within the 3.5′′ radius marked in figure 2 the hardness ratio of the source is 0.7. The estimated source luminosity in the 0.5-8.0 keV energy band is erg s-1. Presence of an AGN is expected if the X-ray image shows a bright point source at the optical center with a hardness ratio greater than 0.8 and a source luminosity greater than erg s (Bauer et al., 2004). It is also noted here that the Raymond model for emission from hot diffuse gas gives the best fit to the X-ray spectrum indicating that the observed X-ray flux is probably all due to the nuclear star formation.
The Spitzer/IRS mid-infrared spectrum does not show any [NeV] lines at 14.3 or m which are expected if the galaxy hosts an AGN. The measured [OIV]m/[NeII]m ratio () indicates that the nuclear emission of this galaxy is completely powered by star formation (see Pereira-Santaella et al., 2010; Tommasin et al., 2010). To constrain the AGN contribution, if any, we can compare various line ratios with the EW of the PAH features using the diagnostic diagrams of Tommasin et al. (2010). Accordingly we calculate upper limits for [NeV]14.32 m/[NeII]12.82 m at 0.025 and for [NeV]14.32 m/[SiII]34.8 m at 0.014. The line ratios for [OIV]/[NeII] and [NeIII]/[NeII] are and , respectively. Using the estimated line ratios and the value of EW of the PAH feature in Figures 4a and 4b of Tommasin et al. (2010) we conclude that the IR flux is nearly 100% dominated by the starburst emission. Indeed the semi-analytical models suggested by Tommasin et al. (2010) estimates 5.6% AGN emission at 19 m using the [OIV]/[NeII] line ratio which is consistent with the 34.6% AGN emission suggested by the upper limit on [NeV]/[NeII] line ratio. The bright 11.3m PAH feature and the [NeII] line at m also indicate that there is high star formation in the nuclear region of the galaxy. From the star forming region (SFR) calibration given in Diamond-Stanic and Rieke (2012) based on the [NeII] line we obtain a nuclear SFR (for a Salpeter IMF) of , in good agreement with the estimate of Mazzuca et al. (2008) using H observations. Using the correlations between SFR and the soft X-ray luminosity of Pereira-Santaella et al. (2011) we get an expected 0.5-2.0 keV X-ray luminosity of consistent with the measured X-ray luminosity (see Table 2) leaving no excess X-ray emission which can be associated with a central Seyfert 2 type AGN.
The absence of radio emission in the 8 GHz VLA radio map also points to the absence of an AGN. The flux density of radio emission from AGNs does not fall as sharply with increasing frequency as SFRs (Condon, 1992). Hence if the compact radio core was due to an AGN, we would have observed some emission at 8 GHz as well.
Gezari et al. (2003) observed NGC 5905 in the optical using the HST/STIS which has a narrow slit size of and hence detected narrow emission lines from the nuclear region of the galaxy. But they did not detect any broad Balmer line emission. Furthermore, the spatial profile of the HST acquisition image obtained by them also does not indicate any AGN-like unresolved point source in the nucleus. Thus no evidence for an AGN is found from X-ray, Optical, IR or radio data. We infer that any AGN present in NGC 5905 is very weak, as also indicated by a low total X-ray luminosity (see Table 2), and rule out the possibility that the X-ray flare of 1990 in this galaxy observed by RASS was a result of large-amplitude variability in the Seyfert nucleus.
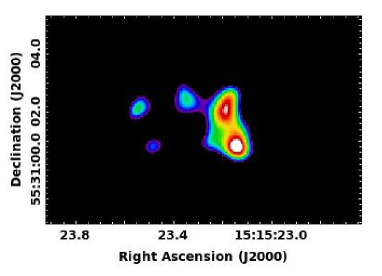
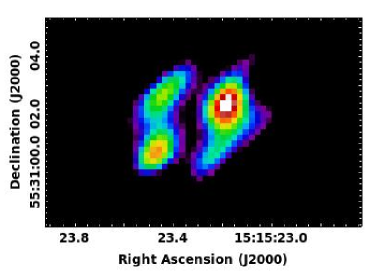
3.4 Radio emission at 1.28 GHz and 3 GHz : the circumnuclear star formation
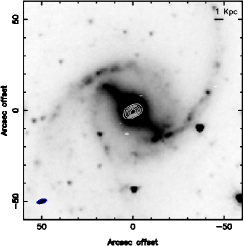
At all resolutions in the GMRT maps, the 1.28 GHz radio emission shows strong nuclear emission but no extended structure that could be associated with large scale jets or disk emission (see Figure 6). The source structure and flux density are similar to that of the FIRST image (Table 4). The NVSS map has a flux density of 20.1 mJy which is significantly higher than both the FIRST and GMRT maps. But this may be due to the larger NVSS beam (45′′) which picks up more of the extended diffuse emission. To see if there is any compact nuclear emission in the 1.28 GHz radio image, we made a high resolution map using the imaging parameter, robust=-5 (Figure 8(b)). The emission peaks close to the galaxy nucleus and has a value of 1.81 mJy/beam where the beam is 4.971.63′′ and the map noise is 0.088 mJy/beam. But it is offset from the optical center by approximately an arcsecond. The emission is also extended. Hence we could not detect any compact emission that could be a radio afterglow associated with the TDE at 1.28 GHz.
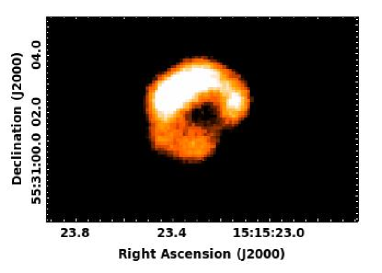
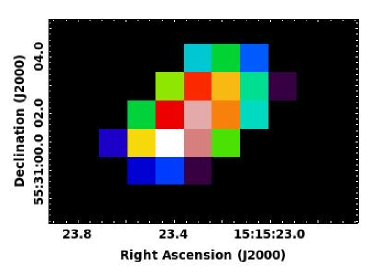
At 3 GHz, however, the 1.28 GHz nuclear emission breaks up into a double lobed structure (Figure 8(c)) that could be either due to a weak AGN or emission from the limb brightened edges of a nuclear ring. Since there is a circumnuclear star forming ring in the galaxy ((Figure 8(a)), a nuclear ring is more likely. The size and orientation of the ring matches the high resolution 1.28 GHz radio morphology. The size is also similar to the H image of the circumnuclear ring. All these factors suggest the 3 GHz emission is mainly due to circumnuclear star formation. Using the total flux at 1.28 and 3 GHz (Table 4) we obtain a spectral index of where . This is typical for both radio jets and star formation. However the high resolution radio geometry suggests that star formation is more likely.
At 8 GHz we obtained only patchy emission. To see if there was any extended emission that was not picked up by the small beam, we smoothed the 8 GHz map (robust=0, lower resolution) to 1′′ resolution (Figure 8(d)). No compact emission that could be due to a TDE was detected, but some patchy emission close to the noise limit is seen. It is probably associated with the star forming ring.
We used the radio flux at 1.4 GHz in the FIRST map (Table 4) to estimate the star formation rate in the nuclear region using the relation (Condon, 1992). We obtain a value of 0.61 , which is lower than the value that we obtained from the Spitzer spectrum, 2.3 and from the H observations of the nuclear ring, 2.6 (Mazzuca et al., 2008). This could be because the SFR derived from radio continuum assumes the presence of massive stars which are usually associated with supernova that emit synchrotron radiation. However, NGC 5905 is a giant LSB galaxy and in such systems massive stars may not be common.
One question that arises is whether the TDE could have triggered the nuclear star formation through gas shocked by radio jets. This is unlikely as the ring has an inner diameter of 0.5′′ to 1′′. Even with velocity close to speed of light (), the time required to reach such radius is of the order of several yrs. However, the higher nuclear mass density makes a TDE more probable.
3.5 Nuclear radio emission : Is there a TDE radio afterglow?
As mentioned in the introduction, TDEs can result in enhanced SMBH mass accretion rates which can result in the formation of radio jets or outflows from the nucleus. They will appear as relatively weak but compact radio emission associated with the nucleus. One of the main goals of this study is to detect such a radio afterglow from NGC 5905. To search for compact emission we applied 20-0 and 40-0 k UV range cutoffs (i.e. only UV wavelengths greater than 20 or 40 k were included) to both the 1.28 GHz and 3 GHz maps (see Table 4 for fluxes). The 1.28 GHz 20 k map has a peak coincident with the center of the 3 GHz ring (Figure 8). But when a 40 k cutoff is applied, no compact emission remained - which suggests that the 20 k 1.28 GHz peak was probably due to diffuse emission associated with star formation and not compact emission associated with the TDE. The 3 GHz images with 20-0 and 40-0 k UV range cutoffs (Figure 8 b and c) show a nice ring but no compact nuclear emission. Thus both the 1.28 and 3 GHz radio data (both obtained after the epoch 2010) do not show any emission that could be associated with the TDE. But the map noise at 1.28 GHz and 3 GHz constrains the radio afterglow to lie between 0.62 mJy and 0.09 mJy (3 limits), respectively. We did not detect any emission in the VLA 8 GHz (1996) archival data as well. Instead the map noise gives a 5 limit of 0.15 mJy for an 8 GHz afterglow.
4 Conclusion
1. X-ray emission: From the 2007 Chandra X-ray spectrum of NGC 5905 we conclude that the observed X-ray emission
at that epoch can be fully accounted for as emission from a hot diffuse gas probably present due
to the nuclear star formation.
2. No evidence for an AGN: No evidence for an AGN is found from X-ray, IR or radio observations.
The predicted 0.5-2keV X-ray luminosity obtained from the IR SFRs compares well with the observed X-ray luminosity.
The non-detection of the high excitation [NeV] lines together with the observed EW of the 11.3 m PAH feature and
mid-IR line ratios indicate that the mid-IR emission of this galaxy is fully arising from star formation
activity. According to the Tommasin et al. (2010) semi-analytical models, the [OIV]/[NeII] line ratio
suggests an AGN contribution of only 5.6% to the total IR flux at 19 m. Also radio emission at 8 GHz is absent.
Therefore the STIS data (Gezari et al., 2003) can imply only a very weak AGN in NGC 5905.
3. Circumnuclear star formation: The 3 GHz image of the galaxy shows a double lobed structure the size of
which is similar to the H image of the circumnuclear ring. The size and orientation of this structure
matches with the 20 k 1.28 GHz radio morphology. Thus the 3 GHz radio emission is likely due to the circumnuclear
star forming ring in NGC 5905.
4. No Confirmed Radio Afterglow : We did not detect any compact emission associated with the TDE at
1.28 GHz, 3 GHz or 8 GHz. Such emission could arise from a radio jets triggered by the TDE. Upper
limits to any flux associated with a radio afterglow can be given by 3 (where is the map
noise) and is 0.62 mJy at 1.28 GHz, 0.09 mJy at 3 GHz and 0.09 mJy at 8 GHz.
5. Long term X-ray luminosity: The long term X-ray luminosity shows a decline after the 1990 X-ray flare detected by RASS. This decline follows the expected decline if the 1990 X-ray flare was due to TDE. The observed luminosity decline is well modeled as where is the year 1990.36, plus a constant luminosity due to nuclear star formation.
Acknowledgments
We thank Sebastien Comeron for giving us the AINUR image of the nuclear ring in NGC 5905, M. Pereira-Santaella for his help with the Spitzer/IRS spectra, S. Tommasin for help with their semi-analytical models of IR emission lines and S. Komossa for very useful discussions regarding this work. We also thank G.C. Bower for his very useful comments which have improved this work and for sharing the 3 GHz EVLA data used in the work. A.A.-H. is party funded by the Spanish Plan National grant AYA2012-31447. We thank the GMRT staff for help in observations. The GMRT is operated by the National Center for Radio Astrophysics of the Tata Institute of Fundamental Research. This work has used VLA 3 GHz and 8 GHz archival data of NGC 5905. It has also used the NRAO VLA FIRST image and the 8 GHz NRAO VLA Archival data of NGC 5905. The NRAO (National Radio Astronomy Observatory) is a facility of the National Science Foundation operated under cooperative agreement by Associated Universities, Inc. This research has made use of data obtained from the Chandra Data Archive and the Chandra Source Catalog, and software provided by the Chandra X-ray Center (CXC) in the application package CIAO. This work is based [in part] on observations made with the Spitzer Space Telescope, which is operated by the Jet Propulsion Laboratory, California Institute of Technology under a contract with NASA. This research has also made use of the NASA/IPAC Extragalactic Database (NED) which is operated by the Jet Propulsion Laboratory, California Institute of Technology, under contract with the National Aeronautics and Space Administration.
References
- Ananthakrishnan and Pramesh Rao (2001) Ananthakrishnan, S., Pramesh Rao, A.: In: 2001 Asia-Pacific Radio Science Conference AP-RASC ’01, p. 237 (2001)
- Bade et al. (1996) Bade, N., Komossa, S., Dahlem, M.: Astron. Astrophys. 309, 35 (1996)
- Bauer et al. (2004) Bauer, F.E., Alexander, D.M., Brandt, W.N., Schneider, D.P., Treister, E., Hornschemeier, A.E., Garmire, G.P.: Astron. J. 128, 2048 (2004). arXiv:astro-ph/0408001. doi:10.1086/424859
- Becker et al. (1995) Becker, R.H., White, R.L., Helfand, D.J.: Astrophys. J. 450, 559 (1995). doi:10.1086/176166
- Bloom et al. (2011) Bloom, J.S., Giannios, D., Metzger, e.a.: Science 333, 203 (2011). 1104.3257. doi:10.1126/science.1207150
- Bower (2011) Bower, G.C.: Astrophys. J. Lett. 732, 12 (2011). 1103.4328. doi:10.1088/2041-8205/732/1/L12
- Bower et al. (2013) Bower, G.C., Metzger, B.D., Cenko, S.B., Silverman, J.M., Bloom, J.S.: Astrophys. J. 763, 84 (2013). 1210.0020. doi:10.1088/0004-637X/763/2/84
- Cappelluti et al. (2009) Cappelluti, N., Ajello, M., Rebusco, P., Komossa, S., Bongiorno, A., Clemens, C., Salvato, M., Esquej, P., Aldcroft, T., Greiner, J., Quintana, H.: Astron. Astrophys. 495, 9 (2009). 0901.3357. doi:10.1051/0004-6361/200811479
- Comeron et al. (2010) Comeron, S., Knapen, J.H., Beckman, J.E., Laurikainen, E., Salo, H., Martínez-Valpuesta, I., Buta, R.J.: Mon. Not. R. Astron. Soc. 402, 2462 (2010). 0908.0272. doi:10.1111/j.1365-2966.2009.16057.x
- Condon (1992) Condon, J.J.: Annu. Rev. Astron. Astrophys. 30, 575 (1992). doi:10.1146/annurev.aa.30.090192.003043
- Das et al. (2009) Das, M., Reynolds, C.S., Vogel, S.N., McGaugh, S.S., Kantharia, N.G.: Astrophys. J. 693, 1300 (2009). 0812.0457. doi:10.1088/0004-637X/693/2/1300
- Diamond-Stanic and Rieke (2012) Diamond-Stanic, A.M., Rieke, G.H.: Astrophys. J. 746, 168 (2012). 1106.3565. doi:10.1088/0004-637X/746/2/168
- Donley et al. (2002) Donley, J.L., Brandt, W.N., Eracleous, M., Boller, T.: Astron. J. 124, 1308 (2002). arXiv:astro-ph/0206291. doi:10.1086/342280
- Esquej et al. (2007) Esquej, P., Saxton, R.D., Freyberg, M.J., Read, A.M., Altieri, B., Sanchez-Portal, M., Hasinger, G.: Astron. Astrophys. 462, 49 (2007). arXiv:astro-ph/0612340. doi:10.1051/0004-6361:20066072
- Esquej et al. (2012) Esquej, P., Saxton, R.D., Komossa, S., Read, A.M.: In: European Physical Journal Web of Conferences. European Physical Journal Web of Conferences, vol. 39, p. 2004 (2012). doi:10.1051/epjconf/20123902004
- Gezari et al. (2003) Gezari, S., Halpern, J.P., Komossa, S., Grupe, D., Leighly, K.M.: Astrophys. J. 592, 42 (2003). doi:10.1086/375553
- Gezari et al. (2008) Gezari, S., Basa, S., Martin, D.C., Bazin, G., Forster, K., Milliard, B., Halpern, J.P., Friedman, P.G., Morrissey, P., Neff, S.G., Schiminovich, D., Seibert, M., Small, T., Wyder, T.K.: Astrophys. J. 676, 944 (2008). 0712.4149. doi:10.1086/529008
- Gezari et al. (2009) Gezari, S., Heckman, T., Cenko, S.B., Eracleous, M., Forster, K., Gonçalves, T.S., Martin, D.C., Morrissey, P., Neff, S.G., Seibert, M., Schiminovich, D., Wyder, T.K.: Astrophys. J. 698, 1367 (2009). 0904.1596. doi:10.1088/0004-637X/698/2/1367
- Giannios and Metzger (2011) Giannios, D., Metzger, B.D.: Mon. Not. R. Astron. Soc. 416, 2102 (2011). 1102.1429. doi:10.1111/j.1365-2966.2011.19188.x
- Giuricin et al. (1990) Giuricin, G., Bertotti, G., Mardirossian, F., Mezzetti, M.: Mon. Not. R. Astron. Soc. 247, 444 (1990)
- Greisen (2003) Greisen, E.W.: Information Handling in Astronomy - Historical Vistas 285, 109 (2003). doi:10.1007/0-306-48080-8_7
- Gültekin et al. (2009) Gültekin, K., Richstone, D.O., Gebhardt, K., Lauer, T.R., Tremaine, S., Aller, M.C., Bender, R., Dressler, A., Faber, S.M., Filippenko, A.V., Green, R., Ho, L.C., Kormendy, J., Magorrian, J., Pinkney, J., Siopis, C.: Astrophys. J. 698, 198 (2009). 0903.4897. doi:10.1088/0004-637X/698/1/198
- Halpern et al. (2004) Halpern, J.P., Gezari, S., Komossa, S.: Astrophys. J. 604, 572 (2004). arXiv:astro-ph/0402497. doi:10.1086/381937
- Hernán-Caballero and Hatziminaoglou (2011) Hernán-Caballero, A., Hatziminaoglou, E.: Mon. Not. R. Astron. Soc. 414, 500 (2011). 1101.4794. doi:10.1111/j.1365-2966.2011.18413.x
- Ho et al. (1995) Ho, L.C., Filippenko, A.V., Sargent, W.L.: Astrophys. J. Suppl. Ser. 98, 477 (1995). doi:10.1086/192170
- Ho et al. (2009) Ho, L.C., Greene, J.E., Filippenko, A.V., Sargent, W.L.W.: Astrophys. J. Suppl. Ser. 183, 1 (2009). 0906.4105. doi:10.1088/0067-0049/183/1/1
- Houck et al. (2004) Houck et al., J.R.: Astrophys. J. Suppl. Ser. 154, 18 (2004). arXiv:astro-ph/0406167. doi:10.1086/423134
- Kent (1985) Kent, S.M.: Astrophys. J. Suppl. Ser. 59, 115 (1985). doi:10.1086/191066
- Komossa and Bade (1999) Komossa, S., Bade, N.: Astron. Astrophys. 343, 775 (1999). arXiv:astro-ph/9901141
- Komossa and Dahlem (2001) Komossa, S., Dahlem, M.: ArXiv Astrophysics e-prints (2001). arXiv:astro-ph/0106422
- Li et al. (2002) Li, L.-X., Narayan, R., Menou, K.: Astrophys. J. 576, 753 (2002). arXiv:astro-ph/0203191. doi:10.1086/341890
- Maksym et al. (2010) Maksym, W.P., Ulmer, M.P., Eracleous, M.: Astrophys. J. 722, 1035 (2010). 1008.4140. doi:10.1088/0004-637X/722/2/1035
- Mazzuca et al. (2008) Mazzuca, L.M., Knapen, J.H., Veilleux, S., Regan, M.W.: Astrophys. J. Suppl. Ser. 174, 337 (2008). 0709.2915. doi:10.1086/522338
- Naik et al. (2010) Naik, S., Das, M., Jain, C., Paul, B.: Mon. Not. R. Astron. Soc. 404, 2056 (2010). 1001.5096. doi:10.1111/j.1365-2966.2010.16423.x
- Pereira-Santaella et al. (2010) Pereira-Santaella, M., Diamond-Stanic, A.M., Alonso-Herrero, A., Rieke, G.H.: Astrophys. J. 725, 2270 (2010). 1010.5129. doi:10.1088/0004-637X/725/2/2270
- Pereira-Santaella et al. (2011) Pereira-Santaella, M., Alonso-Herrero, A., Santos-Lleo, M., Colina, L., Jiménez-Bailón, E., Longinotti, A.L., Rieke, G.H., Ward, M., Esquej, P.: Astron. Astrophys. 535, 93 (2011). 1109.0921. doi:10.1051/0004-6361/201117420
- Ramya et al. (2011) Ramya, S., Prabhu, T.P., Das, M.: Mon. Not. R. Astron. Soc. 418, 789 (2011). 1108.0763. doi:10.1111/j.1365-2966.2011.19530.x
- Rees (1988) Rees, M.J.: Nature 333, 523 (1988). doi:10.1038/333523a0
- Saxton et al. (2012a) Saxton, R.D., Read, A.M., Esquej, P., Komossa, S., Dougherty, S., Rodriguez-Pascual, P., Barrado, D.: Astron. Astrophys. 541, 106 (2012a). 1202.5900. doi:10.1051/0004-6361/201118367
- Saxton et al. (2012b) Saxton, R.D., Read, A.M., Esquej, P., Komossa, S., Dougherty, S., Rodriguez-Pascual, P., Barrado, D.: Astron. Astrophys. 541, 106 (2012b). 1202.5900. doi:10.1051/0004-6361/201118367
- Sprayberry et al. (1995) Sprayberry, D., Impey, C.D., Bothun, G.D., Irwin, M.J.: Astron. J. 109, 558 (1995). doi:10.1086/117300
- Strubbe and Quataert (2009) Strubbe, L.E., Quataert, E.: Mon. Not. R. Astron. Soc. 400, 2070 (2009). 0905.3735. doi:10.1111/j.1365-2966.2009.15599.x
- Tommasin et al. (2010) Tommasin, S., Spinoglio, L., Malkan, M.A., Fazio, G.: Astrophys. J. 709, 1257 (2010). 0911.3348. doi:10.1088/0004-637X/709/2/1257
- Ulmer (1999) Ulmer, A.: Astrophys. J. 514, 180 (1999). doi:10.1086/306909
- van Moorsel (1982) van Moorsel, G.A.: Astron. Astrophys. 107, 66 (1982)
- van Velzen et al. (2011) van Velzen, S., Körding, E., Falcke, H.: Mon. Not. R. Astron. Soc. 417, 51 (2011). 1104.4105. doi:10.1111/j.1745-3933.2011.01118.x
- Zauderer et al. (2011) Zauderer, B.A., Berger, E., Soderberg, e.a.: Nature 476, 425 (2011). 1106.3568. doi:10.1038/nature10366