Water deuterium fractionation in the inner regions of two solar type protostars 111Based on observations carried out with the IRAM Plateau de Bure Interferometer. IRAM is supported by INSU/CNRS (France), MPG (Germany) and IGN (Spain).
Abstract
The [HDO]/[H2O] ratio is a crucial parameter for probing the history of water formation. So far, it has been measured for only three solar type protostars and yielded different results, possibly pointing to a substantially different history in their formation. In the present work, we report new interferometric observations of the HDO line for two solar type protostars, IRAS2A and IRAS4A, located in the NGC1333 region. In both sources, the detected HDO emission originates from a central compact unresolved region. Comparison with previously published interferometric observations of the HO line shows that the HDO and H2O lines mostly come from the same region. A non-LTE LVG analysis of the HDO and HO line emissions, combined with published observations, provides a [HDO]/[H2O] ratio of 0.3 - 8 % in IRAS2A and 0.5 - 3 % in IRAS4A. First, the water fractionation is lower than that of other molecules such as formaldehyde and methanol in the same sources. Second, it is similar to that measured in the solar type protostar prototype, IRAS16293-2422, and, surprisingly enough, larger than that measured in NGC1333 IRAS4B. The comparison of the measured values towards IRAS2A and IRAS4A with the predictions of our gas-grain model GRAINOBLE gives similar conclusions to those for IRAS 16293, arguing that these protostars share a similar chemical history, although they are located in different clouds.
Subject headings:
astrochemistry — ISM: abundances — ISM: individual objects (NGC1333-IRAS2A, NGC1333-IRAS4A) — ISM: molecules — stars: formation1. Introduction
The formation of solar type protostars is triggered by the gravitational collapse of dense fragments of molecular clouds, the so-called prestellar cores. In molecular clouds and prestellar cores, the low temperature and interstellar UV flux promote the formation of icy mantles around the dust grains. These mantles are mainly composed of H2O, CO, CO2, H2CO, or CH3OH (see Boogert & Ehrenfreund, 2004). The two last become abundant with the freeze-out of CO. In addition, the CO freeze-out coupled with the cold conditions enhance the abundance of the deuterated molecules (see Ceccarelli et al., 2007; Caselli et al., 2008).
Several theoretical studies have shown that the molecular deuteration is very sensitive to the physical conditions. For instance, the deuteration of gaseous species increases with the total density and decreases with the temperature (see Millar et al., 1989; Roberts et al., 2003). Similarly, the deuteration of icy species formed on the grain surfaces by H and D atom addition reactions, like H2O, H2CO and CH3OH, depends on the gaseous atomic [D]/[H] ratio, which also increases with the density and the CO freeze-out at low temperatures (Cazaux et al., 2011; Taquet et al., 2012b, 2013).
In theory, therefore, the deuteration of different mantle species can be used to reconstruct the history of the ice formation and, consequently, of the protostar (e.g. Taquet et al., 2013). In practice, unfortunately, the direct measurement of the deuteration of frozen species is not possible. Observations of solid HDO towards protostars only yielded upper limits (with HDO/H2O few percent, Dartois et al., 2003; Parise et al., 2003). However, one can observe these species where the icy mantles sublimate, for example in the hot corino regions. Since the timescale needed to significantly alter the deuteration after the ice sublimation is longer than the typical age of Class 0 protostars ( versus yr, Charnley et al., 1997; André et al., 2000), the measured deuteration of the gaseous mantle species likely reflects that in the ices prior to the sublimation. A comparison between the measured and predicted deuteration in interstellar ices is, therefore, possible.
In Taquet et al. (2013), we did a first study by comparing the predictions of our gas-grain GRAINOBLE model (Taquet et al., 2012a) with the observations towards the protostar IRAS16293-2422 (hereafter, IRAS16293). This source displays a very high deuterium fractionation of formaldehyde and methanol (with D/H ratios of 15 and 40 %, respectively, see Loinard et al., 2001; Parise et al., 2002, 2004) and a lower fractionation of water (0.1 - 3 %, see Butner et al., 2007; Vastel et al., 2010; Coutens et al., 2012, 2013; Persson et al., 2013). We concluded that the lower fractionation of water with respect to that of formaldehyde and methanol is likely due to a different epoch of formation of the three species. Water is predicted to be mainly produced during the molecular cloud phase, while most of formaldehyde and methanol is formed during the colder and denser prestellar phase. We carried out a similar study using the measured deuteration of H2O, H2CO, and CH3OH towards the outflow shock L1157-B1 and concluded that this site had a similar sequence for the formation of the ice, but in a less dense environment (Codella et al., 2012).
Encouraged by these two studies, we want here to extend the analysis to other solar type protostars with the goal to reconstruct the formation history of their ices and compare it with the two previous cases. Ultimately, a similar study in a large sample of solar type protostars will provide us with a more complete picture of how the environment influences the chemical composition of the ices and will supply strong constraints to the theory.
Although the fractionation of formaldehyde and methanol has been measured towards several solar type protostars (Parise et al., 2002, 2004, 2005, 2006), observational studies of deuterated water are scarce. In NGC1333-IRAS4B, the non detection of the HDO line at 225.6 GHz yields an upper limit to the [HDO]/[H2O] ratio of (Jørgensen & van Dishoeck, 2010). In NGC1333-IRAS2A, several HDO and H2O lines have been observed with single-dish telescopes. Using the Herschel Space Observatory, Kristensen et al. (2010) observed a broad outflow component for several H2O lines, but could not accurately estimate the water abundance in the warm compact region. In contrast, Liu et al. (2011) derived the HDO abundance profile in the warm and cold regions of the envelope. However, single-dish telescopes also encompass the cold envelope, and the possible outflow component. Complementary interferometric observations, with arcsecond resolutions, are needed to resolve the emission coming from the hot corinos, where the ices are sublimated and where the deuteration likely reflects the ice pristine deuteration (Jørgensen & van Dishoeck, 2010; Persson et al., 2013).
In this Letter, we present interferometric IRAM Plateau de Bure observations of the HDO - line at 143 GHz towards NGC1333-IRAS2A (hereinafter IRAS2A) and NGC1333-IRAS4A (hereinafter IRAS4A). These sources are located in the Perseus complex, in the NGC1333 cloud, whose distance is about 220 pc (Cernis, 1990). They were selected because they are the two line brightest low-mass protostars after IRAS16293 due to their distance and their luminosity and because interferometric observations of HO have been recently obtained by Persson et al. (2012) towards them. The [HDO]/[H2O] ratio derived in the present work, combined with previous observations of deuterated formaldehyde and methanol, will be compared with the predictions of our gas-grain model GRAINOBLE (Taquet et al., 2013) to reconstruct the chemical history of these two protostars.
2. Observations and results
The two low-mass Class 0 protostars IRAS2A and IRAS4A were observed with the IRAM Plateau de Bure Interferometer on 2010 August 1, August 3 and 2011 March 10 and in the C and D configurations of the array. Due to the proximity to each other, the two sources were observed in the same track. The - HDO transition at 143.727 GHz and the 2 mm continuum emission have been obtained simultaneously using the WIDEX correlator, with a 1.8 GHz bandwidth centered at 143.5 GHz, and providing a spectral resolution of 1.95 MHz (4 km s-1). Phase and amplitude were calibrated by performing regular observations of the nearby point sources 3C454.3, 3C84, and 0333+321. The amplitude calibration uncertainty is estimated to be %.
The data calibration and imaging were performed using the CLIC, and MAPPING packages of the GILDAS software222The GILDAS package is available at http://www.iram.fr/IRAMFR/GILDAS. Continuum images were produced by averaging line-free channels in the WIDEX correlator before the Fourier transformation of the data. The coordinates of the sources, and the size of the synthesized beams are reported in Table 1.
| Source | IRAS2A | IRAS4A |
|---|---|---|
| RA | 03:28:55.56 | 03:29:10.45 |
| Dec | 31:14:37.05 | 31:13:31.18 |
| Synthesized Beam (″) | 2.16 x 1.73 (25∘) | 2.18 x 1.76 (25∘) |
| Continuum flux (Jy) aafootnotemark: | 0.13 | 1.08 |
| Source size (″) aafootnotemark: | 1.75 x 1.69 | 2.13 x 1.72 |
Figure 1 shows the maps of the continuum emission at 2 mm of IRAS2A and IRAS4A obtained after natural weighted cleaning. Parameters of the continuum emission (flux and deconvolved FWHM size), obtained from elliptical Gaussian fits, are given in Table 1. For the two sources, since the FWHM size of the continuum emission is very similar to the size of the synthesized beam, the continuum emission is, therefore, not resolved. In particular, IRAS4A is known to be a binary system with a 1.8″ separation (Looney et al., 2000), as depicted in Figure 1. Although the continuum emission of IRAS4A is peaked at the southeast (SE) position rather than at the northwest (NW) position, we cannot resolve the two sources.
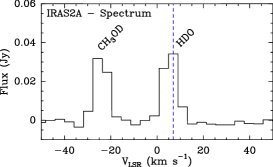
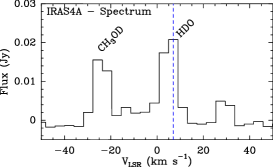

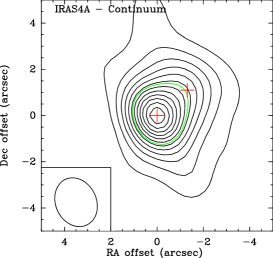
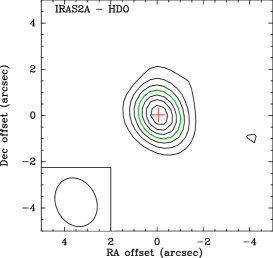
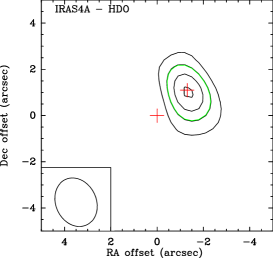
Figure 1 shows the maps of the integrated HDO - line towards the two sources obtained after natural weighted cleaning. For both sources, the FWHM size of the HDO line is very similar to the size of the synthesized beam, as shown in Figure 1. The emission clearly originates in compact regions, that are confined within the synthesized beam of the telescope. In particular, although the SE position of IRAS4A is the brightest in the continuum, the HDO line emission comes from the NW position. The spectra of the HDO transition integrated within the FWHM size are shown in Figure 1 assuming km s-1 for the two sources. Table 2 gives the flux and the brightness temperature of the HDO line transition integrated inside the FWHM size.
| Transition | Frequency | Flux | Beam | Telescope | Ref. | |||||
| (GHz) | (K) | (s-1) | (Jy km s-1) | (K km s-1) | (″) | (km s-1) | ||||
| NGC1333 IRAS2A | ||||||||||
| HDO - | 143.727 | 319.2 | 0.43 | 2.2 x 1.8 | IRAM PdBi | 7 | 1 | |||
| HDO - | 80.578 | 46.8 | 0.37 | 31.2 | IRAM 30m | 3.9 | 2 | |||
| HDO - | 241.561 | 95.3 | 2.2 | 10.4 | IRAM 30m | 4.1 | 2 | |||
| HDO - | 225.896 | 167.7 | 2.6 | 11.1 | IRAM 30m | 4.2 | 2 | |||
| HO | 203.408 | 203.7 | 0.98 | 0.9 x 0.7 | IRAM PdBi | 4.0 | 3 | |||
| NGC1333 IRAS4A | ||||||||||
| HDO - | 143.727 | 319.2 | 0.21 | 2.2 x 1.8 | IRAM PdBi | 6 | 1 | |||
| HO | 203.408 | 203.7 | 0.27 | 0.9 x 0.7 | IRAM PdBi | 2.9 | 3 | |||
Comparison with maps of the HO - line transition by Persson et al. (2012) shows that, although our beam is two times larger, most of the HDO and H2O emissions originate in the same region. Persson et al. (2012) estimated the FWHM size of the HO emission, from a Gaussian fit in the plane, and they found that most of the emission originates in a 0.8″ ellipse, similar to their synthesized beam. Observational data derived by Persson et al. (2012) are given in Table 2. The HDO lines observed in this work are broader, by a factor of 2, than the other HDO and HO lines, due to the low spectral resolution of our observations. In IRAS2A, even if the bulk of the HO emission is associated with the central warm envelope, an outflow component towards the southwest is also observed (see Fig. 2 of Persson et al., 2012) whereas the HDO line only originates in the compact region located within the synthesized beam. Our maps are, therefore, in good agreement with previous single-dish observations of HO and HDO towards IRAS2A by Kristensen et al. (2010) and Liu et al. (2011), described in the Introduction, which show that H2O mostly traces the outflow whereas HDO only traces the central envelope.
In IRAS4A, both the HDO and HO emission come from the NW position and the FWHM sizes are similar to the respective synthesized beams, suggesting that the emission originates in the central region. Therefore, it is meaningful to compare the flux of the HDO and HO lines originating in the FWHM central regions. The fluxes are given in Table 2 and are used in the next section to estimate the [HDO]/[H2O] ratio.
3. Deuterium fractionation of water
3.1. Method
A single transition line of HDO and HO does not allow us to derive an accurate estimate of the HDO and H2O column densities towards the two protostars and, therefore, of [HDO]/[H2O]. In order to derive the physical conditions of the line emitting gas and the relevant column densities, we compared the predictions from a non-LTE LVG code (Ceccarelli et al., 2003) with our observations and the observations by Liu et al. (2011) of several HDO lines towards IRAS2A, obtained with the IRAM 30m, JCMT, and APEX telescopes. We considered the collisional coefficients from Daniel et al. (2011) for HO and from Faure et al. (2012) for HDO. The Einstein coefficients are from the Jet Propulsion Laboratory molecular database (Pickett et al., 1998).
We ran a grid of models covering a large parameter space in kinetic temperature (15 values from 70 to 220 K), (15 values from to cm-3), HDO column density (HDO) (15 values from to cm-2), and source size (30 values from 0.1 to 200 arcsec). In addition, we considered three values for the ortho to para ratio (opr) of H2: (namely all H2 molecules are in the para state), 1, and 3 (thermal equilibrium value at K). To find the best fit to the data, we excluded the 464 GHz line observed by Liu et al. (2011) as it may be contaminated by the cold envelope emission, given its low energy level (22 K).
3.2. Results
IRAS2A
We ran the grid of models to reproduce the emission of the HDO lines towards IRAS2A. The H2 opr has a low influence on the column densities derived from the observations. Varying the H2 opr between 0.1 and 3 causes a small variation of the results, by no more than 20 %, namely within the uncertainties of the observations. In the following, we consider an H2 opr of 3. The flux of all the HDO lines are well reproduced (reduced ) for 75-80 K, ″, and a wide range of between and cm-3. The derived (HDO), varies between and cm-2 and decreases with . To evaluate the H2O column density (H2O) from the 203.4 GHz transition, we considered three physical cases that reproduce the emission of the HDO lines (see Table 3). The density used in Case 1 ( cm-3) is similar to the density used by Maret et al. (2004) for reproducing the H2CO emission with a non-LTE LVG analysis. The densities used in Cases 2 and 3 are slightly lower than the density in the hot corino region (where the temperature is higher than 100 K) of IRAS2A derived by Jørgensen et al. (2002). Higher densities do not reproduce the observed HDO emission (the reduced increases to values much higher than 1). Regardless of the density, the derived column density of HO is equal to cm-2. Note that at cm-3, the line weakly masers (see also Neufeld and Melnick, 1991). The column densities we obtain are slightly higher, by a factor of two, than that derived by Persson et al. (2012). The difference can, therefore, come from a combination of the LTE versus non-LTE population, gas temperature and line opacity (in our model, it is 1.4). The low temperature could indicate that the gas is thermally decoupled from the dust. (HO) can then be derived by assuming an isotopic abundance ratio 16O/18O of 560 (Wilson et al., 1994) and an opr of 3 (see Emprechtinger et al., 2010, 2013). Depending on , we derive an [HDO]/[H2O] abundance ratio between 0.3 and 8 % (see Table 3).
IRAS4A
For IRAS4A, no other HDO lines but the line observed in this work are available. The flux of the HDO and HO lines are, therefore, compared with the predictions obtained by using the same set of physical conditions as for IRAS2A. We also used another set of parameters presenting a larger source size of 0.8″, consistent with the upper limit given by Persson et al. (2012) for the HO transition. The increase in slightly decreases the column density of HDO and HO by approximately the same factor (2-3), giving similar results to those by Persson et al. (2012). The [HDO]/[H2O] ratio, therefore, decreases by a factor of two, at maximum. For both sets of physical conditions, we predict an [HDO]/[H2O] abundance ratio between 0.5 and 3 % (see Table 3).
| Case | 1 | 2 | 3 |
|---|---|---|---|
| Density (cm-3) | |||
| IRAS2A ( K, ″) | |||
| (HDO) (cm-2) | |||
| (HDO -) | 23 | 2 | 1 |
| (p-HO) (cm-2) | |||
| (p-HO) | -0.4 | 0.8 | 1.5 |
| (H2O) (cm-2) | |||
| HDO/H2O | |||
| IRAS4A | |||
| K, ″ | |||
| (HDO) (cm-2) | |||
| (HDO -) | 3 | 0.8 | 0.4 |
| (p-HO) (cm-2) | |||
| (p-HO) | -0.4 | 0.05 | 0.15 |
| (H2O) (cm-2) | |||
| HDO/H2O | |||
| K, ″ | |||
| (HDO) (cm-2) | |||
| (HDO -) | 0.8 | 0.3 | 0.2 |
| (p-HO) (cm-2) | |||
| (p-HO) | -0.2 | -0.02 | 0.08 |
| (H2O) (cm-2) | |||
| HDO/H2O | |||
4. Discussion and conclusions
The first result of this work is the relatively high water deuteration, %, in IRAS2A and IRAS4A. In IRAS2A, this value is compatible with the lower limit derived by Liu et al. (2011) in the same source (see Introduction). In IRAS4A, this is the first published estimate.
Second, as in IRAS16293 and L1157-B1, the water deuteration is lower, by about one order of magnitude, than the deuteration of formaldehyde and methanol in the same sources, previously measured by Parise et al. (2006).
Third, the water deuteration in IRAS2A and IRAS4A is very similar to that measured in IRAS16293 by Coutens et al. (2012), 3 %, but higher than the ratio derived by Persson et al. (2013) in the same source. The difference between the two results might come from the choice of the method. Persson et al. (2013) derived the [HDO]/[H2O] ratio from few lines by assuming LTE population and optically thin emission, whereas the quoted column density implies a line opacity and the 203 GHz line may maser (see above). On the contrary, Coutens et al. (2012) uses single-dish observations which also encompass the cold envelope even though most of the lines have 50K, so that the contamination from the outer cold envelope is accounted for.
The ratio is at least one order of magnitude larger than the value measured in IRAS4B, , by Jørgensen & van Dishoeck (2010), despite the fact that this source lies in the same molecular cloud, NGC1333, as IRAS2A and IRAS4A and it is only ″ away from IRAS4A (Sandell et al., 1991). To add to this oddity, the deuteration of formaldehyde and methanol in IRAS4B is very similar to that measured in IRAS2A and IRAS4.
Figure 2 summarizes the situation, with a plot of the measured deuteration of water, formaldehyde and methanol in the outflow shock L1157-B1 and in the protostars IRAS 16293, IRAS2A, IRAS4A and IRAS4B.
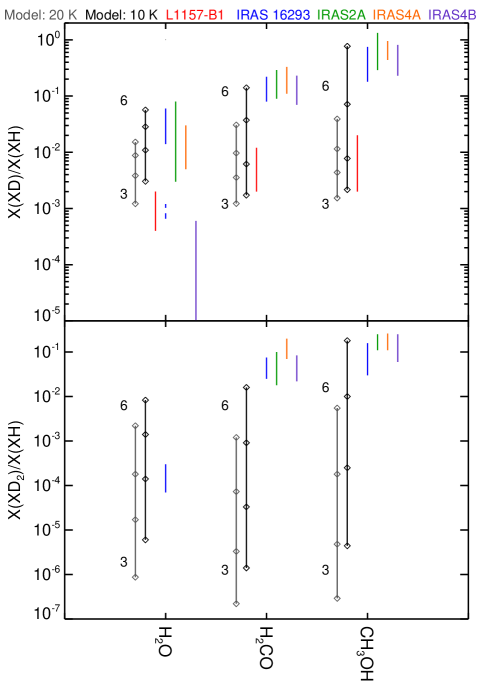
In the same figure, we also show the theoretical predictions by the gas-grain model GRAINOBLE (Taquet et al., 2013). Briefly, the model follows the multilayer formation of deuterated ices with a pseudo time-dependent approach. We report the icy [HDO]/[H2O] ratio computed at yr (the typical age of prestellar cores) for different constant densities and temperatures, mag. The H2 opr, which is difficult to constrain observationally, is one of the key parameters in setting the [HDO]/[H2O] ratio (Taquet et al., 2013). Following the value derived by Dislaire et al. (2012) towards IRAS 16293, we used a H2 opr of . The comparison between the observations and the theoretical predictions shows that the [HDO]/[H2O] ratio measured in IRAS2A and IRAS4A is reproduced for a large range of physical conditions: cm-3 for K and cm-3 for K. On the contrary, our model cannot reproduce the [HDO]/[H2O] value reported by Jørgensen & van Dishoeck (2010) for densities larger than cm-3. One possible explanation is that water ice has formed at a lower H2 opr (see Taquet et al., 2013) or the model is missing some ingredients regarding the deuterated ice formation.
As in our previous work, we note that the larger deuteration of formaldehyde and methanol testifies to a formation of these species on the grain surfaces at a later and higher density stage than water, likely the prestellar core phase.
Finally, NGC1333 is a very active star forming region undergoing the destruction and alteration from various outflows of the first generation stars that might have initiated the formation of IRAS2A and IRAS4A (Liseau et al, 1988; Warin et al., 1996; Lefloch et al., 1998; Knee & Sandell, 2000) whereas the cloud containing IRAS16293 is relatively quiescent (Mizuno et al., 1990). Nevertheless, the similar deuterium fractionation derived in IRAS2A, IRAS4A and IRAS 16293 suggests that these protostars have followed a similar chemical history even though they are located in very different environments. However, the [HDO]/[H2O] ratio observed in IRAS4B by Jørgensen & van Dishoeck (2010) and in IRAS 16293 by Persson et al. (2013) does not fit with this conclusion and remains puzzling.
References
- André et al. (2000) André, P., Ward-Thompson, D., Barsony, M. 2000, Protostars and Planets IV, 59
- Boogert & Ehrenfreund (2004) Boogert, A. C. A. and Ehrenfreund, P. 2004, Astrophysics of Dust, 309, 547
- Butner et al. (2007) Butner, H. M., Charnley, S. B., Ceccarelli, C. et al. 2007, ApJ, 659, L137-L140
- Caselli et al. (2008) Caselli, P., Vastel, C., Ceccarelli, C. et al. 2008, A&A, 492, 703-718
- Caselli & Ceccarelli (2012) Caselli, P., Ceccarelli, C. 2012, A&A. Rev. 20, 56
- Cazaux et al. (2011) Cazaux, S., Caselli, P., Spaans, M., 2011, ApJ, 741, L34
- Ceccarelli et al. (2003) Ceccarelli, C., Maret, S., Tielens, A. G. G. M., Castets, A. and Caux, E. 2003, A&A, 410, 587-595
- Ceccarelli et al. (2007) Ceccarelli, C., Caselli, P., Herbst, E., Tielens, A. G. G. M. and Caux, E. 2007, Protostars and Planets V
- Cernis (1990) Cernis, K. 1990, Ap&SS, 166, 315-330
- Charnley et al. (1997) Charnley, S. B., Tielens, A. G. G. M. and Rodgers, S. D. 1997, ApJ, 482, L203
- Codella et al. (2012) Codella, C., Ceccarelli, C., Lefloch, B. et al. 2012, ApJ, 757, L9
- Coutens et al. (2012) Coutens, A., Vastel, C., Caux, E., Ceccarelli, C., Bottinelli, S., Wiesenfeld, L., Faure, A., Scribano, Y. and Kahane, C. 2012, A&A, 539, A132
- Coutens et al. (2013) Coutens, A., Vastel, C., Cazaux, S., et al. 2013, A&A, accepted
- Daniel et al. (2011) Daniel, F., Dubernet, M.-L., Grosjean, A. 2011, A&A, 536, A76
- Dartois et al. (2003) Dartois, E., Thi, W.-F., Geballe, T. R. et al. 2003, A&A, 399, 1009-1020
- Dislaire et al. (2012) Dislaire, V., Hily-Blant, P., Faure, A., Maret, S., Bacmann, A. and Pineau Des Forêts, G. 2012, A&A, 537, A20
- Emprechtinger et al. (2010) Emprechtinger, M., Lis, D. C., Bell, T. et al. 2010, A&A, 521, L28
- Emprechtinger et al. (2013) Emprechtinger, M., Lis, D. C., Rolffs, R. et al. 2013, ApJ, 765, 61
- Faure et al. (2012) Faure, A., Wiesenfeld, L., Scribano, Y. and Ceccarelli, C. 2012, MNRAS, 420, 699-704
- Jørgensen et al. (2002) Jørgensen, J. K., Schöier, F. L., van Dishoeck, E. F. 2002, A&A, 389, 908-930
- Jørgensen & van Dishoeck (2010) Jørgensen, J. K. and van Dishoeck, E. F. 2010, ApJ, 725, L172-L175
- Knee & Sandell (2000) Knee, L. B. G. and Sandell, G. 2000, A&A, 361, 671-684
- Kristensen et al. (2010) Kristensen, L. E., Visser, R., van Dishoeck, E. F. et al. 2010, A&A, 521, L30
- Lefloch et al. (1998) Lefloch, B., Castets, A., Cernicharo, J., Langer, W. D. and Zylka, R. 1998, A&A, 334, 269-279
- Liseau et al (1988) Liseau, R., Sandell, G. and Knee, L. B. G. 1988, A&A, 192, 153-164
- Liu et al. (2011) Liu, F.-C., Parise, B., Kristensen, L., Visser, R., van Dishoeck, E. F. and Güsten, R. 2011, A&A, 527, A19
- Loinard et al. (2001) Loinard, L., Castets, A., Ceccarelli, C. et al. 2001, ApJ, 552, L163-L166
- Looney et al. (2000) Looney, L. W., Mundy, L. G. and Welch, W. J. 2000, ApJ, 529, 477-498
- Maret et al. (2004) Maret, S., Ceccarelli, C., Caux, E. et al. 2004, A&A, 416, 577-594
- Millar et al. (1989) Millar, T. J., Bennett, A. and Herbst, E. 1989, ApJ, 340, 906-920
- Mizuno et al. (1990) Mizuno, A., Fukui, Y., Iwata, T. et al. 1990, ApJ, 356, 184-194
- Neufeld and Melnick (1991) Neufeld, D. A. and Melnick, G. J. 1991, ApJ, 368, 215-230
- Parise et al. (2002) Parise, B., Ceccarelli, C., Tielens, A. G. G. M. et al. 2002, A&A, 393, L49-L53
- Parise et al. (2003) Parise, B., Simon, T., Caux, E. et al. 2003, A&A, 410, 897-904
- Parise et al. (2004) Parise, B., Castets, A., Herbst, E., Caux, E. et al. 2004, A&A, 416, 159-163
- Parise et al. (2005) Parise, B., Caux, E., Castets, A. et al. 2005, A&A, 431, 547-554
- Parise et al. (2006) Parise, B., Ceccarelli, C., Tielens, A. G. G. M., Castets, A., Caux, E., Lefloch, B. and Maret, S. 2006, A&A, 453, 949-958
- Persson et al. (2012) Persson, M. V., Jørgensen, J. K. and van Dishoeck, E. 2012, A&A, 541, A39
- Persson et al. (2013) Persson, M. V., Jørgensen, J. K. and van Dishoeck, E. 2013, A&A, 549, L3
- Pickett et al. (1998) Pickett, H. M., Poynter, R. L., Cohen, E. A., Delitsky, M. L., Pearson, J. C. and Müller, H. S. P. 1998, J. Quant. Spec. Radiat. Transf., 60, 883-890
- Roberts et al. (2003) Roberts, H., Herbst, E. and Millar, T. J. 2003, ApJ, 591, L41-L44
- Sandell et al. (1991) Sandell, G., Aspin, C., Duncan, W. D., Russell, A. P. G. and Robson, E. I. 1991, ApJ, 376, L17-L20
- Taquet et al. (2012a) Taquet, V., Ceccarelli, C. and Kahane, C. 2012a, A&A, 538, A42
- Taquet et al. (2012b) Taquet, V., Ceccarelli, C. and Kahane, C. 2012b, ApJ, 748, L3
- Taquet et al. (2013) Taquet, V., Peters, P. , Kahane, C., Ceccarelli, C., López-Sepulcre, A., Toubin, C., Duflot, D., Faure, A. and Wiesenfeld, L. 2013, A&A, 550, A127
- Vastel et al. (2010) Vastel, C., Ceccarelli, C., Caux, E. et al. 2010, A&A, 521, L31
- Warin et al. (1996) Warin, S., Castets, A., Langer, W. D., Wilson, R. W. and Pagani, L. 1996, A&A, 306, 935
- Wilson et al. (1994) Wilson, T. L. and Rood, R. 1994, ARA&A, 32, 191