Stellar electron-capture rates in pf-shell nuclei from quasiparticle random-phase approximation calculations
Abstract
Electron-capture rates at different density and temperature conditions are evaluated for a set of pf-shell nuclei representative of the constituents in presupernova formations. The nuclear structure part of the problem is described within a quasiparticle random-phase approximation based on a deformed Skyrme Hartree-Fock selfconsistent mean field with pairing correlations and residual interactions in particle-hole and particle-particle channels. The energy distributions of the Gamow-Teller strength are evaluated and compared to benchmark shell-model calculations and experimental data extracted from charge-exchange reactions. The model dependence of the weak rates are discussed and the various sensitivities to both density and temperature are analyzed.
pacs:
21.60.Jz,23.40.Hc,26.50.+x,27.40.+z,27.50.+eI Introduction
Stars are unique laboratories where all the interactions in nature come into play to determine the different stages in the stellar evolution. This comprises the energy generation, which is mainly caused by fusion reactions mediated by strong interactions, as well as the nucleosynthesis of elements mediated by nuclear reactions in different stellar scenarios b2fh . Whereas the main sequences of the stellar evolution and the majority of the elements with mass number below are produced by hydrostatic burning mediated by the strong and electromagnetic interactions, weak interactions grow in importance in later stages ffn , when the density () and temperature () in the core become larger, increasing the Fermi energy of the degenerate electron gas and then favoring electron captures.
In fact, it is a well established feature that weak -decay and electron-capture (EC) processes are very important mechanisms to understand the late stages of the stellar evolution ffn , playing a critical role to determine both the presupernova stellar structure and the nucleosynthesis of heavier nuclei. These processes are dominated by Gamow-Teller (GT) transitions and therefore, the GT properties of pf-shell nuclei are of special importance because they are the main constituents of the stellar core in presupernovae formations aufderheide-94 leading to core-collapse (type II) or thermonuclear (type Ia) supernovae.
While the scenarios for type Ia supernovae are thought to be binary systems with a white dwarf accreting material from a companion star, type II supernovae are the final result of the gravitational collapse of the core of a massive star that takes place when the nuclear fuel exhausts. Then, the core becomes unstable and when the mass exceeds the Chandrasekhar mass, the electron degeneracy pressure is not able to prevent the gravitational collapse. In the initial stages, electrons are captured by nuclei in the iron-nickel mass region, thus reducing the electron-to-baryon fraction () of the presupernova star and correspondingly the degeneracy pressure. At the same time, the neutrinos produced at presupernova densities leave the star reducing the energy and cooling the star. Both effects act in the same direction accelerating the collapse. With increasing neutronization of the core material, the energies increase and -decays become more important competing with ECs. EC processes are therefore essential ingredients to follow the complex dynamics of core-collapse supernovae and reliable estimates of these rates certainly contribute to a better understanding of the explosion mechanism.
An accurate understanding of most astrophysical processes requires necessarily information from nuclear physics, which provides the input to deal with network calculations and astrophysical simulations langanke-03 . Due to the extreme conditions of and that hold in stellar scenarios, most of the nuclear properties cannot be measured directly. Therefore, the GT strength distributions must be estimated in many cases by model calculations. Obviously, nuclear physics uncertainties will finally affect the reliability of the description of those astrophysical processes.
The first extensive calculations of stellar weak rates as functions of relevant ranges of and were done in Ref. ffn . It was assumed that the whole GT strength resides in a single resonance whose energy relative to the daughter ground state is parametrized phenomenologically, taking the total GT strength from the single-particle model.
In the last decades, GT+ strength distributions on nuclei in the mass region have been studied experimentally via , or equivalent higher resolution charge-exchange reactions such as and , at forward angles alford-91 ; yako-09 ; rakers-04 ; alford-93 ; baumer-03 ; ronnqvist-93 ; vetterli-87 ; elkateb-94 ; hagemann-04 ; cole-06 ; williams-95 ; anantaraman-08 ; popescu-07 ; grewe-08 ; hitt-09 ; fujita-11 . Charge-exchange reactions are the most efficient way to extract the GT+ strength in stable nuclei osterfeld-92 . For incident energies above 100 MeV, the isovector spin-flip component of the effective interaction is dominant and the cross sections is mainly originated from spin-isospin transitions. At forward angles the momentum transfer is small and the reaction cross section is dominated by the GT operator with . The cross section, extrapolated to zero momentum transfer, is proportional to the -decay strength between the same states. Charge-exchange reactions at small momentum transfer are therefore used to study GT strength distributions when -decay is not energetically possible.
The data show that the total GT+ strength is strongly quenched and fragmented over many final states, as compared to the independent-particle model. Then, improvements in the weak rates have been focused on the description of the nuclear structure aspect of the problem. Different approaches to describe the nuclear structure involved in the stellar weak decay rates can be found in the literature. They are basically divided into shell model (SM), either SM Montecarlo koonin-97 or large scale SM diagonalizations langanke-00 ; langanke-01 ; suzuki-09 and proton-neutron quasiparticle random-phase approximation (QRPA) moeller-97 ; nabi-99 ; nabi-09 ; paar-04 ; sarri-09-11 ; fantina-12 categories. Although QRPA calculations cannot reach the detailed spectroscopy achieved from present state-of-the-art SM calculations, the global performance of QRPA is quite satisfactory. Moreover, one clear advantage of the QRPA method is that it can be extended to heavier nuclei, which are beyond the present capability of full SM calculations, without increasing the complexity of the calculation.
Very recently, a systematic evaluation of the ability to reproduce the measured GT strength distributions of various theoretical models based on SM and QRPA was done in Ref. cole-12 , where EC rates were derived from those models at relevant and . While several sets of SM calculations using different effective interactions were compared, namely KB3G poves-01 and GXPF1a honma-02 , in the case of QRPA only the formalism developed in krumlinde-84 using deformations and masses obtained from the finite range droplet model moeller-95 was considered in Ref. cole-12 . In what follows we use the term QRPA-Möller to refer to these QRPA results obtained from the above mentioned formalism.
Given the sensitivity of the weak rates to the nuclear structure through the GT strength distributions, it is worth extending the study in Ref. cole-12 by considering alternative calculations within the QRPA formalism. Indeed, the QRPA method with separable GT interactions was first proposed and applied in Ref. halbleib-67 , on a spherical harmonic oscillator basis, and then it was extended to deformed nuclei krumlinde-84 using deformed phenomenological single-particle basis. Further refinements to the QRPA formalism were introduced along the years muto-89 ; frisk-95 ; sarri-98 ; sarri-99 ; sarri-01 ; sarri-01-odd ; borzov-06 .
In this work, we study the dependence of the EC rates on both and with GT strength distributions calculated within a QRPA approach based on a selfconsistent deformed Hartree-Fock (HF) mean field with Skyrme interactions including pairing correlations and residual separable forces in both particle-hole () and particle-particle () channels. We compare our calculations with the benchmark calculations in Ref. cole-12 . This formalism represents an improvement over the QRPA-Möller approach in several aspects. First, instead of a phenomenological approach (single-particle models based on Nilsson, Woods-Saxon, or folded Yukawa models), the deformed mean field is now obtained selfconsistently and there is no need to introduce deformation parameters as input, and secondly, a separable residual GT interaction in the channel is included. We should also mention the inclusion of an effective quenching factor in our calculations that was not included in QRPA-Möller. The present nuclear model has been tested successfully reproducing very reasonably the experimental information available on both bulk and decay properties of medium-mass nuclei sarri-03 ; poirier-04 ; nacher-04 ; sarri-05-wp ; sarri-09-prc ; sarri-10 .
The paper is organized as follows. In Section II the weak decay rates are introduced as functions of and and their nuclear structure and phase space components are described. Section III contains the results obtained for the GT strength distributions and for the EC rates in some selected pf-shell nuclei that correspond to those used in Ref. cole-12 . Section IV contains the conclusions of this work.
II Theoretical Formalism
There are several distinctions between terrestrial and stellar decay rates caused by the effect of high and . One effect of is directly related to the thermal population of excited states in the decaying nucleus, accompanied by the corresponding depopulation of the ground states. The weak-decay rates of excited states can be significantly different from those of the ground state and a case by case consideration is needed. Another effect related to the high and comes from the fact that atoms in these scenarios are completely ionized and consequently electrons are no longer bound to the nuclei, but forming a degenerate plasma obeying a Fermi-Dirac distribution. This opens the possibility for continuum EC, in contrast to the orbital EC caused by bound electrons in the atom under terrestrial conditions. These effects make weak interaction rates in the stellar interior sensitive functions of and .
II.1 Weak decay rates
Assuming thermal equilibrium, the probability of occupation of the excited states in the parent nucleus follows a Boltzmann distribution. The decay rate of the parent nucleus is given by
| (1) |
where is the partition function and is the angular momentum (excitation energy) of the parent nucleus state .
In principle, the sum extends over all populated states in the parent nucleus up to the proton separation energy. However, because of the range of temperatures considered in this work ( GK), only a few low-lying excited states are expected to contribute in the decay of even-even nuclei. In fact, the lowest excited states in the even-even nuclei considered are collective states located typically above 1 MeV from the ground state. The lowest of these states corresponds to the nucleus 56Fe and appears at MeV ensdf . Hence, their contributions to the rates can be neglected at these temperatures.
In the case of odd- nuclei the situation is more involved because excited states of single-particle nature appear at low excitation energies. This is particularly the case of 45Sc, where one finds up to six excited states below 1 MeV ensdf . These states will become populated as raises and may contribute to the weak rates. A case by case analysis is mandatory and work in this line is in progress.
The decay rate corresponding to the parent state is given by
| (2) |
where the sum extends over all the states in the final nucleus reached in the decay process and s. This expression is decomposed into a phase space factor , which is a function of and and a nuclear structure part that contains the transition probabilities for allowed Fermi and GT transitions,
| (3) |
In this work we only consider the dominant GT transitions. Fermi transitions have a simple expression assuming isospin symmetry and are only important for decay of neutron-deficient light nuclei with . The theoretical description of both and are explained in the next subsections.
II.2 Phase Space Factors
The nuclei under study in this work correspond to stable pf-shell nuclei. decays from their ground states are then energetically forbidden. However, as raises, thermal population of excited states in the parent nucleus may induce -decays if exceeds the energy. These decays that are almost independent of and , might compete with ECs in cases where is high enough to populate significantly excited states in the parent nucleus. In our case the decays would involve excited states beyond 1.5-2 MeV in the most favored cases, but they are not sufficiently populated even at the higher considered in this work ( MeV at with K) Contributions to the weak rates from positron decays are therefore neglected in this work.
In the astrophysical scenarios of our study, nuclei are fully ionized and continuum EC from the degenerate electron plasma are possible. The phase space factor for EC is given by
| (4) | |||||
In this expression is the total energy of the electron in units, is the momentum, and is the total energy available in units
| (5) |
with
| (6) |
written in terms of the nuclear masses of parent () and daughter () nuclei and their excitation energies and , respectively.
is the Fermi function that takes into account the distortion of the electron wave function due to the Coulomb interaction.
| (7) |
where ; ; is the fine structure constant and the nuclear radius. The lower integration limit in Eq. (4) is given by if , or if .
and , are the electron and neutrino distribution functions, respectively. Its presence inhibits or enhances the phase space available. In the stellar scenarios considered here the commonly accepted assumption is that , because neutrinos and antineutrinos at these densities can escape freely from the interior of the star. The electron distribution is described as a Fermi-Dirac distribution
| (8) |
The chemical potential as a function of and is determined from the expression
| (9) |
in (mol/cm3) units. is the baryon density (g/cm3), is the electron-to-baryon ratio (mol/g), and is Avogadro’s number (mol-1).
The phase space factor for EC in Eq. (4) is therefore a sensitive function of both and , through the electron distribution .
II.3 Nuclear Structure
The nuclear structure part of the problem is described within the QRPA formalism. Various approaches have been developed in the past to describe the spin-isospin nuclear excitations in QRPA paar-04 ; krumlinde-84 ; muto-89 ; frisk-95 ; sarri-98 ; sarri-99 ; sarri-01 ; sarri-01-odd ; borzov-06 . In this subsection we show briefly the theoretical framework used in this work to describe the nuclear part of the decay rates. More details of the formalism can be found in Refs. sarri-98 ; sarri-01 ; sarri-01-odd .
The method starts with a self-consistent deformed Hartree-Fock mean field formalism obtained with Skyrme interactions, including pairing correlations. The single-particle energies, wave functions, and occupation probabilities are generated from this mean field. In this work we have chosen the Skyrme force SLy4 sly4 as a representative of the Skyrme forces. It is one of the most successful Skyrme forces and has been extensively studied in the last years. We also consider for comparison the results obtained with the force SG2 giai that has been successfully tested against spin-isospin excitations in spherical and deformed nuclei.
The solution of the HF equation is found by using the formalism developed in Ref. vautherin , assuming time reversal and axial symmetry. The single-particle wave functions are expanded in terms of the eigenstates of an axially symmetric harmonic oscillator in cylindrical coordinates, using twelve major shells. The method also includes pairing between like nucleons in BCS approximation with fixed gap parameters for protons and neutrons, which are determined phenomenologically from the odd-even mass differences involving the experimental binding energies ensdf .
Potential energy curves are analyzed as a function of the quadrupole deformation. For that purpose, constrained HF calculations are performed with a quadratic constraint flocard-73 . The HF energy is minimized under the constraint of keeping fixed the nuclear deformation. Calculations for GT strengths are performed subsequently for the various equilibrium shapes of each nucleus, that is, for the solutions, in general deformed, for which minima are obtained in the energy curves.
To describe GT transitions, a spin-isospin residual interaction is added to the Skyrme mean field and treated in a deformed proton-neutron QRPA. Taking into account the phenomenological nature of the Skyrme interactions, which are not fitted to spin-isospin observables, it is reasonable to complement the Skyrme interaction with some extra phenomenological parameters sensitive to those nuclear properties.
This interaction contains a and a part. The interaction in the channel is mainly responsible for the position and structure of the GT resonance and it can be derived consistently from the same Skyrme interaction used to generate the mean field, through the second derivatives of the energy density functional with respect to the one-body densities. The residual interaction is finally expressed in a separable form by averaging the resulting contact force over the nuclear volume sarri-98 . By taking separable GT forces, the energy eigenvalue problem reduces to find the roots of an algebraic equation.
The part is a neutron-proton pairing force in the coupling channel, which is also introduced as a separable force muto-89 ; sarri-01 . Its strength is usually fitted to reproduce globally the experimental half-lives. Various attempts have been done in the past to fix this strength homma-96 , arriving to expressions that depend on the model used to describe the mean field, Nilsson model in the above reference. In previous works sarri-98 ; sarri-99 ; sarri-01 ; sarri-01-odd ; sarri-03 we have studied the sensitivity of the GT strength distributions to the various ingredients contributing to the deformed QRPA calculations, namely to the nucleon-nucleon effective force, to pairing correlations, and to residual interactions. We found different sensitivities to them. In this work, all of these ingredients have been fixed to the most reasonable choices found previously. In particular we use the coupling strengths MeV and MeV. An optimum set of coupling strengths could be chosen following a case by case fitting procedure and we will get different answers depending on the nucleus, shape, and Skyrme force. However, since the purpose here is to test the ability of QRPA to account for the GT strength distributions in the iron-nickel mass region with as few free parameters as possible, we have chosen to use the same coupling strengths for all the nuclei considered in this work.
The GT strength for a transition from an initial state to a final state is given by
| (10) |
is the effective ratio of axial and vector coupling factors that takes into account in an effective manner the observed quenching of the GT strength.
In even-even nuclei, the GT strength corresponding to the transition ) in the laboratory system, is expressed in terms of the intrinsic amplitudes connecting the QRPA ground state with the one-phonon excited states
| (12) | |||||
To obtain this expression, the initial and final states in the laboratory frame have been expressed in terms of the intrinsic states using the Bohr-Mottelson factorization bm .
When the parent nucleus has an odd nucleon, the ground state can be expressed as a one quasi-particle state in which the odd nucleon occupies the single-particle orbit of lowest energy. Then two types of transitions are possible. One type is due to phonon excitations in which the odd nucleon acts only as a spectator. In the intrinsic frame, the transition amplitudes are in this case basically the same as in the even-even case but with the blocked spectator excluded from the calculation. The other type of transitions are those involving the odd nucleon state, which are treated by taking into account phonon correlations in the quasiparticle transitions in first order perturbation krumlinde-84 ; muto-89 ; sarri-01 .
III Results
.
.
.
III.1 Gamow-Teller distributions
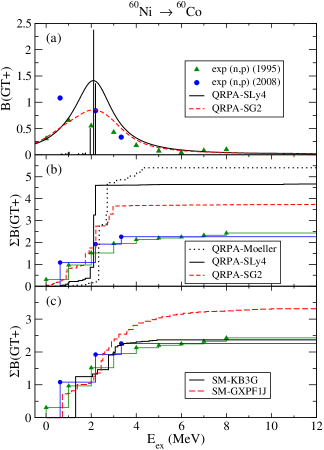
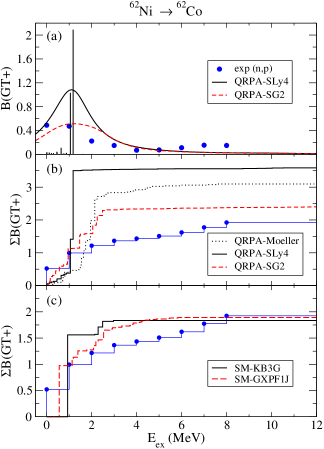
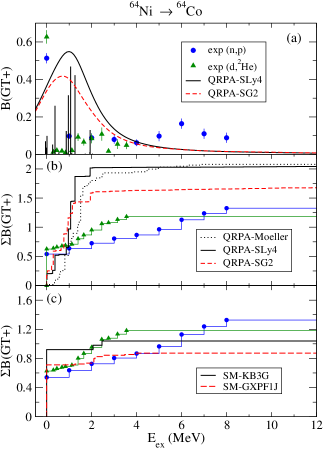
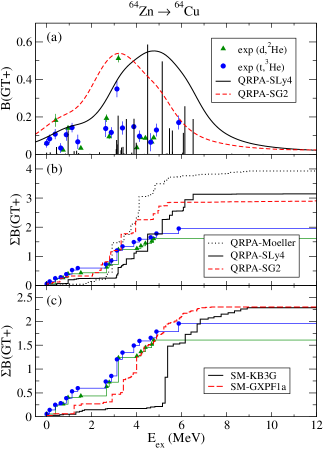
In the next figures, we show the results obtained for the energy distributions of the GT strength corresponding to the equilibrium shapes for which we obtained minima in the potential energy curves. The GT strength is plotted versus the excitation energy of the daughter nucleus (MeV).
Figs. 1-12 contain the results for the isotopes 45Sc, 48Ti, 51V, 54Fe, 55Mn, 56Fe, 58Ni, 59Co, 60Ni, 62Ni, 64Ni, and 64Zn, respectively. This set of nuclei, which are the object of our study, have been chosen in accordance with the cases studied in Ref. cole-12 .
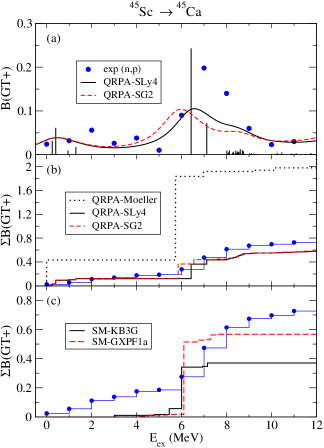
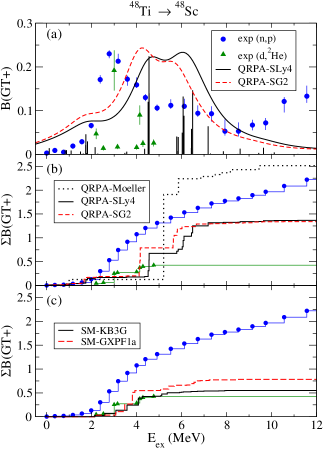
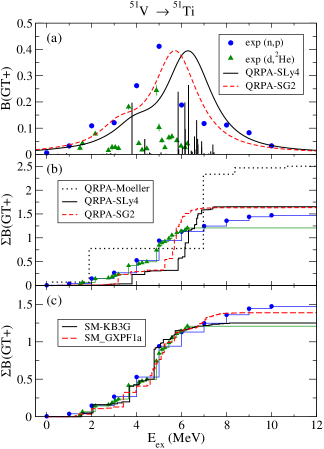
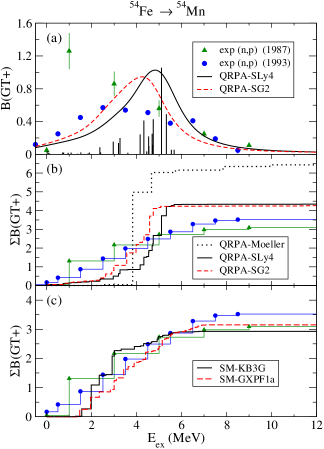
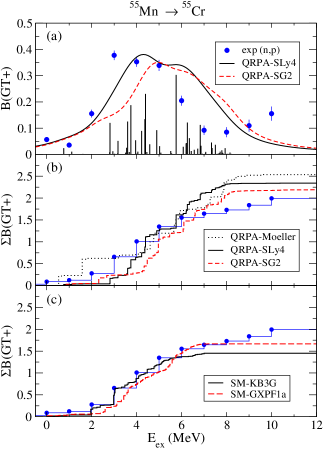
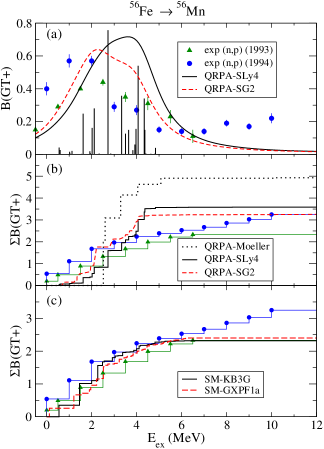
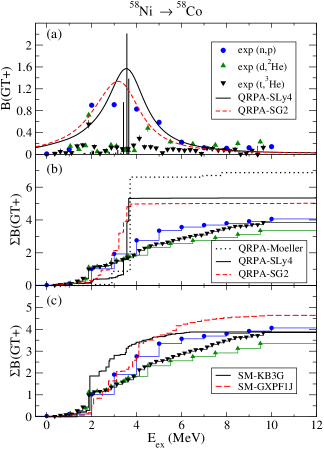
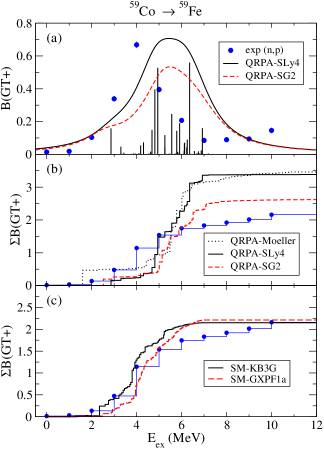
In the top panels (a) we show the experimental energy distributions and the individual GT strengths corresponding to the SLy4 interaction. We also show the continuous distributions from SLy4 and SG2 obtained by folding the strength with Breit-Wigner functions as it was done in Refs. sarri-03 ; radha-97 ; caurier-99 , so that the original discrete spectrum is transformed into a continuous profile. In the middle panels (b) we plot the measured energy distribution of the accumulated strength, which is compared to three QRPA calculations. They are the QRPA-Möller calculations and the two calculations obtained from our present formalism using the Skyrme forces SLy4 and SG2. Finally, in the bottom panels (c) the comparison of the experimental distribution is made with SM calculations with the interactions KB3G poves-01 and GXPF1a honma-02 , as given in Ref. cole-12 .
Fig. 1 shows the GT strength distributions for the 45ScCa extracted from charge-exchange reactions alford-91 . Results are available in 1 MeV energy bins. The measured strength distribution is compared to our QRPA results in Fig. 1(a). The structure of the calculated distribution agrees qualitatively with the data in the sense that the GT strength is concentrated around 7 MeV with small bumps at low energy. Both SG2 and SLy4 results are very similar. The total accumulated strength as a function of the excitation energy can be seen in Fig. 1(b), where the running sums are compared. Our calculations follow closely the experimental strength, while QRPA-Möller overestimates it. Similarly, the SM calculations shown in Fig. 1(c) compare reasonably well with the experiment with the strength practically concentrated in a single peak at 6 MeV and somewhat smaller total strength in the whole energy range.
Fig. 2 contains the results for the 48TiSc transition. In this case the data are from yako-09 and rakers-04 reactions. One should note that the strength measured in Ref. yako-09 would contain an isovector spin monopole component, which is estimated to contribute to about one third of the total strength. In the case of the reaction, the high resolution achieved was 120 keV, but the strength was extracted only up to an excitation energy of 5 MeV. Both sets of data agree in the location of the peak of the strength distribution at about 3 MeV, but disagree in other regions. Our QRPA calculations show a two bump structure with peaks centered at about 4 and 6 MeV that resembles the profile of the data. The total strength obtained lies between the strengths from and reactions and is lower than QRPA-Möller. The SM calculations accumulate the strength around 4 MeV containing less strength than QRPA.
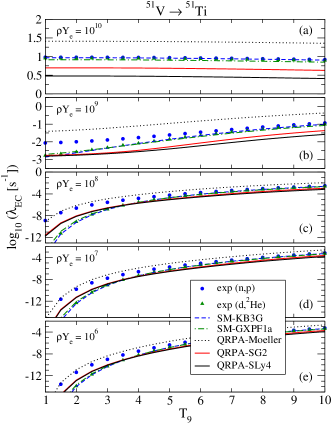
Fig. 3 for the 51VTi transition contains data from alford-93 and baumer-03 reactions with 1 MeV and 110 keV resolution, respectively. Strengths from the high resolution experiments were only extracted up to 6.5 MeV. The main characteristic of these data is that the strength appears concentrated at about 5 MeV excitation energies, a feature that is well reproduced by our QRPA results although at somewhat higher energy. The total strength measured in both experiments are similar and agrees quite well with our QRPA and with SM results.
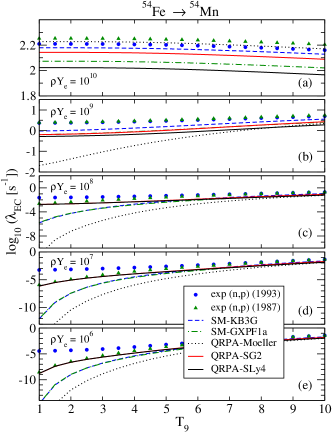
The results for the 54FeMn transition appear in Fig. 4. In this case two sets of data from reactions are available from Refs. ronnqvist-93 ; vetterli-87 . Our QRPA results produce a bump centered at about 5 MeV which is a little bit displaced to higher energies with respect to the experiment. The total strengths in QRPA are also above the measured strength, which is better reproduced by the SM calculations.
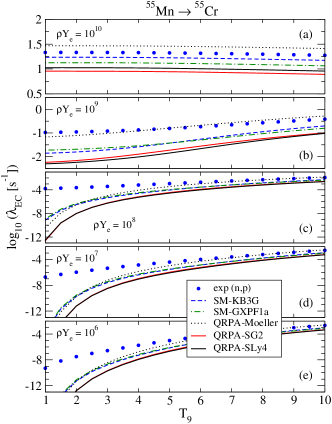
In the case of the 55MnCr transition in Fig. 5 there are data extracted from reactions elkateb-94 . The broad peak observed experimentally centered at about 4 MeV is well reproduced in our QRPA calculations. Also the total GT strength is in this case well accounted for by all the models.
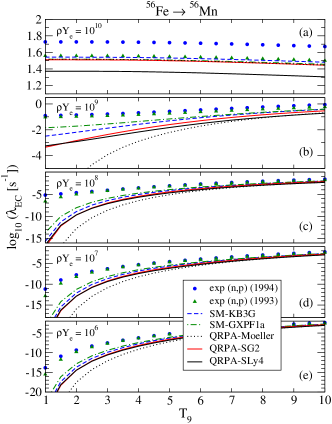
Fig. 6 shows the results corresponding to the 56FeMn transition. Data are from reactions ronnqvist-93 ; elkateb-94 . Both sets of data show a concentration of the GT strength between 1 and 4 MeV in agreement with the calculations. However, the strength observed beyond 6 MeV is not found in any of the calculations presented. The total strength measured is slightly overestimated (underestimated) by QRPA (SM) calculations.
The distribution of the GT strength corresponding to the transition 58NiCo is shown in Fig. 7. Data are from elkateb-94 , hagemann-04 , and cole-06 reactions with energy resolutions of 1.2 MeV, 130 keV, and 250 keV, respectively. Our QRPA calculations produce a strength distribution sharply concentrated between 3 and 4 MeV that contains practically all the GT strength observed. The SM results are more fragmented in better agreement with experiment. Contrary to previous cases, we use here and in the rest of Ni isotopes, the SM results obtained with the improved interaction GXPF1J suzuki-09 .
Fig. 8 shows the results for the 59CoFe transition. Data in this case have been obtained from reactions alford-93 with about 1 MeV energy resolution. QRPA results show one peak structure centered around 5 MeV, which seems to be displaced 1 MeV to higher energy with respect to the experimental distribution. The total GT strength is somewhat larger than experiment. On the other hand SM results agree quite well with the experiment.
In the case of the 60NiCo transition shown in Fig. 9, the data are from reactions williams-95 and from the reanalysis performed in Ref. anantaraman-08 . As in the case of 58Ni, whereas the experimental strength appears fragmented below 3 MeV, QRPA calculations produce a sharp transition with practically all the strength at 2 MeV. All the calculations except SM-KB3G overestimate the total strength measured.
The case of the 62NiCo transition (Fig. 10) is very similar to the previous case for 60Ni. The data from reactions williams-95 show that practically all the strength is contained below 2 MeV, which is compatible with the structure of the GT strength distributions obtained from the theoretical models. However, while QRPA calculations overestimate the total strength, SM results agree very nicely with experiment.
For the 64NiCo transition in Fig. 11 we have data not only from reactions williams-95 as in the previous Ni isotopes, but also data up to 4 MeV from popescu-07 reactions at a much higher energy resolution (110 keV). Most of the GT strength is observed in the ground state to ground state transition, while in QRPA the strength is fragmented below 2 MeV. The calculated strength is overestimated (underestimated) by QRPA (SM) calculations.
In the last example, we see in Fig. 12 the results for the 64ZnCu transition. Data are from grewe-08 and hitt-09 reactions achieving 115 keV and 280 keV energy resolution, respectively. The QRPA results show a bump centered at an excitation energy of 3 MeV (5 MeV) when using SG2 (SLy4) interaction. SG2 results reproduce better the experimental results, which show a strong peak at 3 MeV. The calculated total strength, including results from SM calculations, overestimates always the experiment. Results from SM-KB3G produce a strong peak at 5 MeV at variance with experiment.
Summarizing this section we can say that the observed fragmentation of the experimental GT+ strength distributions over many states, as well as the centroids and widths of the distributions are reasonably well described by the calculations. In the experimental distributions, especially in those extracted from () reactions, there is a tendency to build up a second peak beyond MeV, which is not reproduced in the calculations. In general, QRPA produce more strength at higher energy than SM because of the higher N-shell mixing contained in QRPA. All in all, the present QRPA calculations based on the deformed Skyrme HF+BCS+QRPA described in Sec. II are in general of comparable quality to SM calculations. These results serve to refine the findings in Ref. cole-12 , where it was concluded that QRPA calculations based on Ref. krumlinde-84 produce systematically much larger deviations from the data than SM calculations. We have shown in this work that this is not necessarily the case for all QRPA type calculations.


III.2 Stellar weak decay rates
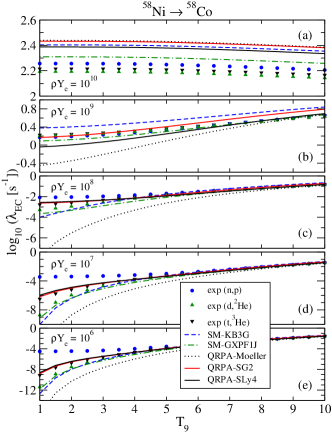
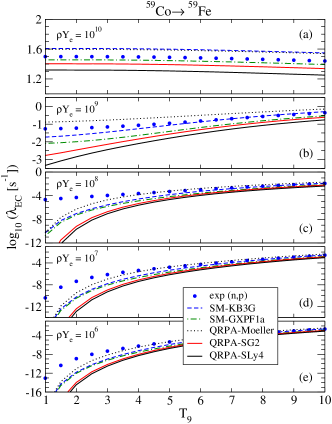
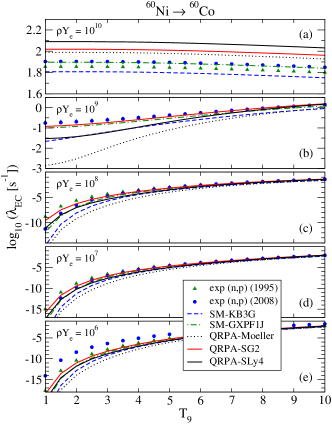
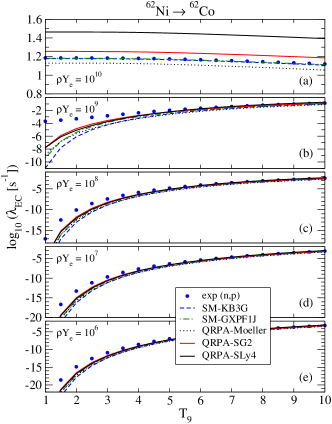
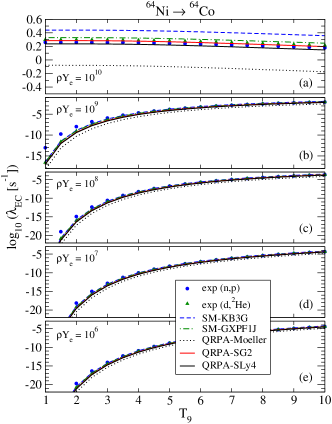
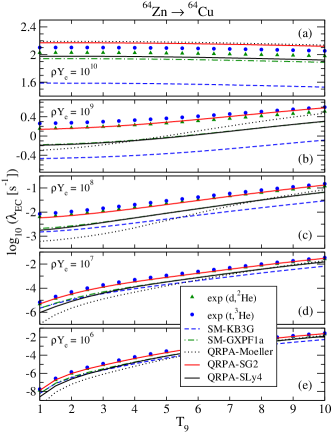
In the following figures (Figs. 13-24) we present the EC rates of the selected pf-shell nuclei as a function of the temperature and for various densities. The range of considered varies from up to , whereas the range in varies from mol/cm3 up to mol/cm3. This grid of and includes those ranges relevant for astrophysical scenarios related to the silicon-burning stage in a presupernovae star aufderheide-94 ( mol/cm3 and ), as well as scenarios related to pre-collapse of the core hix-03 and thermonuclear runaway type Ia supernovae iwamoto-99 ( mol/cm3 and ). In each figure from Fig. 13 to Fig. 24 we show the EC rates obtained from the experimental GT strength distributions and from different SM (KB3G and GXPF1) and QRPA (SLy4, SG2, and Möller) calculations.
Concerning the experimental EC rates in Figs. 13-24, one should keep in mind that these quantities are not necessarily the actual rates in stellar scenarios at high and . is indeed the rate calculated from the experimental GT strength distribution extracted from charge-exchange reactions. Besides the intrinsic uncertainties in the extraction of the GT strength due to several causes like the global normalization of the unit cross section or to possible interferences caused by the tensor component of the interaction, which are typically estimated to be a 10-20% effect, one has to consider other sources of ignorance that makes to be different from the EC rates in stellar scenarios. First, the GT strength is only measured up to some excitation energy and therefore, does not include possible contributions from transitions beyond the measured energy range that could have an effect, especially at high and . Secondly, even when the GT strength distribution is perfectly determined from charge-exchange reactions in the laboratory under terrestrial conditions, this is not sufficient to determine the EC rates in stellar scenarios where ECs can occur on excited states of the parent nucleus that become thermally populated at high . Although these effects are expected to be very small for the densities and temperatures considered, one should keep in mind the real significance of .
Some general comments about the sensitivity of the EC rates to , to the Fermi and energies, and to the GT distribution are in order to understand better the EC rates. Values for and Fermi energies are given in Table I and Table II, respectively. Since the Fermi energy increases with the density, it is expected that the EC rates at low densities are mainly sensitive to the GT strength of states at low excitation energies in the daughter nucleus. This is especially true at low , where the shape of the electron energy distribution, , has a sharp surface at the Fermi energy. When raises, the shape of is smeared out and thus, GT transitions at higher excitation energies might contribute to the rates even at low densities. When increases the rates also increase because the Fermi energy of the electrons is larger and larger allowing to reach higher excitation energies in the daughter nucleus and thus making the GT strength at these energies contribute to the rates in a more significant way. The magnitude of this general effect is different in each nucleus because of the different values that force the electron energy to be large enough to overcome it. When increasing , the rates in general increase because the diffuseness of the electron energy distributions makes it possible that more excited states at higher energy can be reached.
On the other hand the role of the energy in Eq. (5) is also very important. It determines the lower integration limit in the EC phase factor (4). Then, the energy of the available electrons must overcome this value to be captured or in other words, the Fermi energy has to be larger than . The argument is strictly valid at where changes abruptly from one to zero at the Fermi energy. When increases, is smeared out and ECs are possible even for Fermi energies lower than . In general, the larger the energy (more negative) the lower the EC rates. This effect will be accentuated at low densities where the Fermi energy is small. Similarly, nuclei with large (negative) values (i.e., 48Ti, 56Fe, 62Ni, 64Ni) are mostly sensitive to the GT strength of the ground and lowest excited states and the opposite is true for the nuclei with small values (45Sc, 54Fe, 58Ni, 64Zn).
It is also worth comparing the rates in the Ni isotopes that exhibit different values of their energies (see Table I). The EC rates in 64Ni ( MeV) are almost independent of the density for values between and . They start growing at and become very large in comparison at . This effect is related to the fact that the Fermi energy is about 11 MeV (see Table II) at the highest density, which is enough to surpass the large value. We find a similar situation in the case of 62Ni ( MeV) and to a less extent in 60Ni ( MeV). Finally, in 58Ni ( MeV) the rates increase more steadily because the Fermi energy exceeds the small much sooner. Nuclei with large negative energies such as 48Ti and 56Fe show similarities with the rates in 64Ni, whereas nuclei with small negative energies like 45Sc, 54Fe, and 64Zn exhibit similarities with the rates in 58Ni.
We should also mention that in all the examples studied, the rates are practically independent of at mol/cm3 and only a model dependence is apparent. This is a direct consequence of the large Fermi energy (about 11 MeV) at any that makes the rates sensitive to the GT strength at all the excitation energies.
| 45Sc | 48Ti | 51V | 54Fe | 55Mn | 56Fe | 58Ni | 59Co | 60Ni | 62Ni | 64Ni | 64Zn |
|---|---|---|---|---|---|---|---|---|---|---|---|
| -0.258 | -3.990 | -2.472 | -0.697 | -2.603 | -3.696 | -0.382 | -1.565 | -2.823 | -5.315 | -7.307 | -0.580 |
Now we discuss the model dependence of the EC rates. As we have already mentioned, as a general rule the EC rates at low and will be more sensitive to the GT strength at low excitation energies, especially for nuclei with large negative energies. On the other hand, the rates at high and will depend more on the global structure of the GT distribution. This type of correlations can be seen to some extent in all the figures from Figs 13 to Fig. 24.
In the case of 45Sc (Fig. 13) the small value of makes the EC rates very sensitive to the nuclear model because the GT distribution is to a large extent involved up to large excitation energies. We can see that we always get the rates from QRPA-Möller larger than the rates from QRPA-SLy4 and QRPA-SG2, and larger than the SM ones. This is clearly correlated to the GT strength distributions in Fig. 1, where we observe the same ordering in the GT strength. In particular, the rates from our QRPA calculations are very close to the experimental ones, while QRPA-Möller gives larger rates and SM produce rates clearly above. This is especially noticeable at low and due to the absence of strength between 0-6 MeV in the SM calculations.
In the case of 48Ti (Fig. 14) with a relatively large value, we can see that the experimental rates from are larger than the corresponding rates for in accordance with the GT strengths in Fig. 2. While the QRPA calculations agree better with the rates from , the SM calculations agree better with the rates from . In the case of 51V (Fig. 15) all the models are quite similar with the exception of QRPA-Möller that produces larger rates, a feature that is connected with the structure of the GT strength distribution in Fig. (3).
For 54Fe (Fig. 16) is again very small allowing most of the GT strength to be probed more easily. At low densities, the agreement of our QRPA calculations with experiment is better than for other models. It is also interesting to observe how the rates from QRPA-Möller are much lower than other models at low and , but are larger at the largest density. This is a consequence of the GT distribution in Fig. 4 that shows a huge strength at 4 MeV and practically nothing else. Then, at low and there are no electrons available to be captured to that energy. On the contrary at high densities, when the Fermi energy is larger, strong EC to that state is possible increasing dramatically the rate.
In the case of 55Mn (Fig. 17) the most remarkable aspect to mention is the similarity between the model predictions, as well as the discrepancy with experiment at low and . This is caused by the larger experimental GT strength at low energies. At higher when the effect of the low-lying states is not so important the agreement with the experiment improves. The situation is very similar in 56Fe (Fig. 18), where the experimental GT strength at low excitation energy is larger than any model prediction. The rates from QRPA-Möller are particularly low as a consequence of the lack of GT strength below 2.5 MeV (see Fig. 6).
In 58Ni (Fig. 19) with a very small we can see that at low the rates are sensitive to the strength of the low-lying excitations and thus the rates from QRPA-Möller are the smallest, while at the high the rates are sensitive to the total strength and then QRPA-Möller is the largest in accordance with the GT strengths in Fig. 7. The situation in 59Co (Fig. 20) is similar to the previous case, but in this case our QRPA rates are the lowest at low because the GT strengths are the smallest at low energies.
In the cases of 64Ni and 62Ni, and to a less extent 60Ni, has large negative values and therefore the rates are mainly sensitive to the strength of the low-lying states. In the case of 60Ni (Fig. 21) the rates from the different models at low vary from the larger values of the experimental rates up to the lower values of the QRPA-Möller calculations. This is in agreement with the GT strength at low energies, where the measured strength is larger than any model. The GT strength from QRPA-Möller is practically inexistent up to 2 MeV. At higher one finds the rates ordered from the higher QRPA to the lower SM, passing through the experimental rates. In this case this ordering follows the total GT strength in Fig. 9 as one could expect from the fact that at high , the Fermi energy is high enough to overcome the range of excitation energies where GT strength is found. Similar arguments apply to 62Ni and 64Ni. Finally, the rates in Fig. 24 for 64Zn with a very small energy, are sensitive to high excitation energies that can contribute especially at high values.
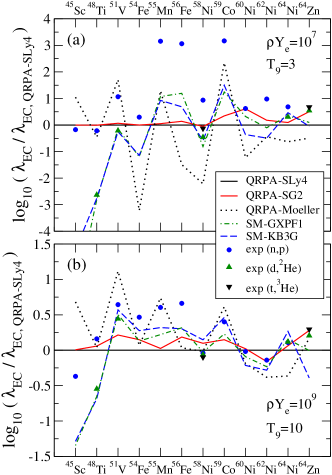
To quantify the measure of the quality of the various calculations for the EC rates, the ratios of the EC rates are compared in Fig. 25 for the pf-shell nuclei studied in this work and for two stellar conditions corresponding to mol/cm3, GK in Fig. 25(a) and to mol/cm3, GK in Fig. 25(b). Because we do not have experimental GT strength distributions from high resolution charge-exchange reactions, or , for all of these nuclei, we show in this comparison the relative EC rates using the QRPA-SLy4 results as a reference, . As it was noticed in Ref. cole-12 , the results in Fig. 25 confirm that the SM calculations reproduce fairly well the rates from the high resolution data, while our QRPA results improve significantly the results from QRPA-Möller, except in the case of 48Ti. The comparison of the calculations with the rates obtained from data shows a tendency to underestimate them in most cases. It is also worth mentioning the better agreement with the data with the stellar conditions given in Fig. 25(b), where the EC rates are less sensitive to the details of the GT strength distributions.
The quality of the calculations can be further quantified with the help of the average ratios of all nuclei defined by
| (13) |
or with the average of the absolute ratios that avoid positive and negative cancellations and gives us the average order of magnitude of these ratios,
| (14) |
These average results are given in Tables III and IV for the two stellar conditions discussed above. In these tables one can see the ratios of various theoretical EC rates with respect to the experimental rates for pf-shell nuclei. We consider two sets of experimental rates, in the first row of each model the ratios are calculated with respect to the rates obtained from the GT strength distributions extracted from charge-exchange reactions. In the second row the ratios are calculated with respect to the high resolution charge exchange reactions (h.r.). The last two columns correspond to the average of the ratios and to the average of the absolute ratios, as defined in Eqs. (13) and (14), respectively. In the case of data the average involves 11 nuclei, whereas in the case (h.r.) there are 5 nuclei involved.
Table III shows that for these stellar conditions, the different theoretical models produce comparable average ratios in the case of data, with a little bit better agreement for the QRPA calculations with Skyrme forces. On the other hand, the best agreement in the case of high resolution data is obtained with the SM calculations, although the agreement in the QRPA-Skyrme cases is also quite good. In the stellar conditions of Table IV the quality of the calculations improve and the agreement with experiment is much better. The average of the absolute ratios of the different models with respect to the data are comparable. On the other hand, the agreement with the high resolution data is especially good for the SM with the GXPF1 force. The agreement obtained from SM with KB3G and from QRPA with SLy4 and SG2 Skyrme forces is comparable, while the QRPA-Möller results are somewhat worse.
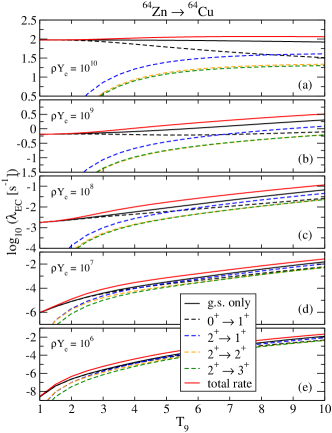
As it has been mentioned, ECs from excited states in the parent nuclei have not been considered in this work on the basis of the typical excitation energies of the lowest excited states that are in most cases larger than 1 MeV and the -range considered that is not sufficiently high to populate those states significantly.
Nevertheless, in order to check to what extent these contributions are small, we have calculated the EC rates originated by transitions from the excited state in the case of 64Zn, where MeV ensdf is one of the lowest excitation energy in our set of nuclei. We compare in Fig. 26 these EC rates with those from the ground state in the case of QRPA-SLy4. In this figure we can see the various contributions to the EC rates for several densities as a function of coming from the transitions from the ground state and from the transitions from the excited state in the parent nucleus, as well as the sum of these contributions (labeled as total rate). The figure also shows for comparison the EC rates calculated from the ground state alone with a probability of population set to one (g.s. only), which correspond to the QRPA-SLy4 results in Fig. 24. The results show that EC from the ground state is the dominant contribution except at high , where contributions from excited states are comparable. We also observe that the EC from only the ground state is always larger than the contribution to the total rate because of the depopulation of the ground state when the state becomes populated.
| 1 | 3 | 5 | 7 | 10 | |
|---|---|---|---|---|---|
| 0.672 | 0.299 | 0.091 | 0.042 | 0.020 | |
| 2.437 | 2.355 | 2.192 | 1.952 | 1.493 | |
| 11.116 | 11.098 | 11.063 | 11.011 | 10.898 | |
| 45Sc | 48Ti | 51V | 54Fe | 55Mn | 56Fe | 58Ni | 59Co | 60Ni | 62Ni | 64Ni | 64Zn | |||||
|---|---|---|---|---|---|---|---|---|---|---|---|---|---|---|---|---|
| SM-KB3G | -4.518 | -2.544 | -1.320 | -1.439 | -2.228 | -2.376 | -1.526 | -1.671 | -0.980 | -1.470 | -0.223 | -1.845 | 1.845 | |||
| (h.r.) | -0.130 | -0.040 | -0.460 | 0.159 | -0.589 | -0.212 | 0.276 | |||||||||
| SM-GXPF1 | -6.357 | -2.596 | -1.217 | -1.490 | -2.081 | -1.869 | -1.746 | -1.924 | -0.298 | -1.082 | -0.334 | -1.909 | 1.909 | |||
| (h.r.) | -0.182 | 0.063 | -0.680 | 0.048 | -0.446 | -0.239 | 0.284 | |||||||||
| QRPA-Möller | 1.219 | -0.240 | 0.642 | -3.518 | -1.864 | -4.551 | -3.151 | -0.820 | -1.849 | -1.417 | -1.316 | -1.533 | 1.872 | |||
| (h.r.) | 2.174 | 1.922 | -2.084 | -0.934 | -1.034 | 0.009 | 1.630 | |||||||||
| QRPA-SLy4 | 0.175 | 0.217 | -1.066 | -0.296 | -3.155 | -3.063 | -0.936 | -3.169 | -0.620 | -0.979 | -0.685 | -1.234 | 1.306 | |||
| (h.r.) | 2.631 | 0.214 | 0.131 | -0.303 | -0.543 | 0.426 | 0.764 | |||||||||
| QRPA-SG2 | 0.172 | 0.211 | -1.001 | -0.296 | -3.103 | -2.924 | -0.988 | -2.826 | -0.010 | -0.799 | -0.590 | -1.105 | 1.175 | |||
| (h.r.) | 2.625 | 0.279 | 0.078 | -0.208 | -0.041 | 0.547 | 0.646 |
| 45Sc | 48Ti | 51V | 54Fe | 55Mn | 56Fe | 58Ni | 59Co | 60Ni | 62Ni | 64Ni | 64Zn | |||||
|---|---|---|---|---|---|---|---|---|---|---|---|---|---|---|---|---|
| SM-KB3G | -0.917 | -0.846 | -0.075 | -0.190 | -0.286 | -0.359 | 0.186 | 0.061 | -0.197 | -0.142 | 0.158 | -0.237 | 0.311 | |||
| (h.r.) | -0.138 | 0.126 | 0.245 | 0.147 | -0.597 | -0.043 | 0.251 | |||||||||
| SM-GXPF1 | -0.976 | -0.813 | -0.139 | -0.337 | -0.385 | -0.346 | 0.014 | -0.172 | -0.073 | -0.093 | 0.047 | -0.298 | 0.309 | |||
| (h.r.) | -0.105 | 0.062 | 0.072 | 0.036 | -0.211 | -0.029 | 0.097 | |||||||||
| QRPA-Möller | 1.050 | -0.125 | 0.471 | -0.399 | 0.134 | -0.628 | 0.023 | 0.211 | -0.169 | -0.242 | -0.472 | -0.013 | 0.357 | |||
| (h.r.) | 0.583 | 0.672 | 0.082 | -0.483 | -0.039 | 0.163 | 0.372 | |||||||||
| QRPA-SLy4 | 0.369 | -0.161 | -0.644 | -0.466 | -0.604 | -0.662 | 0.040 | -0.401 | 0.018 | 0.140 | -0.108 | -0.226 | 0.328 | |||
| (h.r.) | 0.547 | -0.443 | 0.099 | -0.118 | -0.206 | -0.024 | 0.283 | |||||||||
| QRPA-SG2 | 0.374 | -0.103 | -0.430 | -0.318 | -0.580 | -0.476 | 0.138 | -0.253 | 0.038 | -0.020 | -0.045 | -0.152 | 0.252 | |||
| (h.r.) | 0.605 | -0.228 | 0.197 | -0.055 | 0.073 | 0.118 | 0.232 |
IV Conclusions and final remarks
In this work we have evaluated continuum electron-capture rates at different density and temperature conditions holding in stellar scenarios. This study is performed on a set of pf-shell nuclei representative of the constituents in presupernova formations (i.e., 45Sc, 48Ti, 51V, 54Fe, 55Mn, 56Fe, 58Ni, 59Co, 60Ni, 62Ni, 64Ni, and 64Zn). The nuclear structure involved in the calculation of the energy distribution of the Gamow-Teller strength is described within a selfconsistent deformed HF+BCS+QRPA formalism with density-dependent effective Skyrme interactions and spin-isospin residual interactions.
We find that the present QRPA calculation is able to reproduce the main features of the GT distributions extracted in these nuclei from charge-exchange reactions. Comparison of our results for the EC rates with SM calculations and other QRPA results analyzed in Ref. cole-12 shows that, in general, the agreement with experiment is best in the case of SM calculations, but the present QRPA calculations with Skyrme forces are of similar quality in most cases, clearly improving the agreement with experiment with respect to QRPA-Möller. Thus, the results in this work provide additional information on the performance of QRPA-based models and refine the conclusions in Ref. cole-12 , where it was found that QRPA calculations based on the model developed in Ref. krumlinde-84 produce systematically much larger deviations from the data than SM calculations. This work demonstrates that this is not the case for all QRPA type calculations.
We have studied the sensitivity of the EC rates to both and . At low (low Fermi energies) and low (sharp shape of the energy distribution of the electrons), the rates are very sensitive to details of the GT strength of the low-lying excitations and therefore to model calculations. On the other hand, when the and are high enough, the EC rates are sensitive to all the spectrum. Then, the whole description of the GT strength distribution is more important than a detailed description of the low-lying spectrum. Since QRPA reproduces reasonably well the global behavior of the GT strength distributions, it is expected to be a good approach, especially for high and conditions.
decays and EC from thermally populated excited states in the parent nuclei are expected to occur at high . Contributions to the EC rates from the low-lying excited state in 64Zn have been evaluated and compared with the contributions from the ground state in the range of and considered in this work. A systematic study of these contributions will be very important for more extreme stellar conditions, but in this work they can be safely neglected. Moreover, the main purpose of this work is to compare QRPA results with benchmark SM calculations and to EC rates extracted from the measured GT strength distributions in the laboratory that do not contain those type of contributions.
Acknowledgements.
This work was supported in part by MINECO (Spain) under Research Grant No. FIS2011–23565 and by Consolider-Ingenio 2010 Programs CPAN CSD2007-00042.References
- (1) E. M. Burbidge, G. R. Burbidge, W. A. Fowler, and F. Hoyle, Rev. Mod. Phys. 29, 547 (1957); G. Wallerstein et al., Rev. Mod. Phys. 69, 995 (1997).
- (2) G. M. Fuller, W. A. Fowler, and M. J. Newman, Ap. J. Suppl. 42, 447 (1980); Ap. J. 252, 715 (1982); Ap. J. Suppl. 48, 279 (1982); Ap. J. 293, 1 (1985).
- (3) M. B. Aufderheide, I. Fushiki, S. E. Woosley, and D. H. Hartmann, Ap. J. Suppl. 91, 389 (1994); A. Heger, S. E. Woosley, G. Martínez-Pinedo, and K. Langanke, Ap. J. 560, 307 (2001).
- (4) K. Langanke and G. Martínez-Pinedo, Rev. Mod. Phys. 75, 819 (2003).
- (5) W. P. Alford et al., Nucl. Phys. A531, 97 (1991).
- (6) K. Yako et al., Phys. Rev. Lett. 103, 012503 (2009).
- (7) S. Rakers et al., Phys. Rev. C 70, 054302 (2004).
- (8) W.P. Alford et al., Phys. Rev. C 48, 2818 (1993).
- (9) C. Bäumer et al., Phys. Rev. C 68, 031303(R) (2003).
- (10) T. Rönnqvist et al., Nucl. Phys. A563, 225 (1993).
- (11) M. C. Vetterli et al., Phys. Rev. Lett. 59, 439 (1987); Phys. Rev. C 40 559 (1989).
- (12) S. El-Kateb et al., Phys. Rev. C 49, 3128 (1994).
- (13) M. Hagemann et al., Phys. Rev. C 71, 014606 (2005); Phys. Lett. B 579, 251 (2004).
- (14) A. L. Cole et al., Phys. Rev. C 74, 034333 (2006).
- (15) A. L. Williams et al., Phys. Rev. C 51, 1144 (1995).
- (16) N. Anantaraman et al., Phys. Rev. C 78, 065803 (2008).
- (17) L. Popescu et al., Phys. Rev. C 75, 054312 (2007).
- (18) E.-W. Grewe et al., Phys. Rev. C 77, 064303 (2008).
- (19) G. W. Hitt et al., Phys. Rev. C 80, 014313 (2009).
- (20) Y. Fujita, B. Rubio, and W. Gelletly, Prog. Part. Nucl. Phys. 66, 549 (2011).
- (21) F. Osterfeld, Rev. Mod. Phys. 64, 491 (1992).
- (22) S. E. Koonin, D. J. Dean, and K. Langanke, Phys. Rep. 278, 1 (1997).
- (23) K. Langanke and G. Martínez-Pinedo, Nucl. Phys. A673, 481 (2000).
- (24) K. Langanke and G. Martínez-Pinedo, At. Data Nucl. Data Tables 79, 1 (2001).
- (25) T. Suzuki et al., Phys. Rev. C 79, 061603(R) (2009); Phys. Rev. C 83, 044619 (2011).
- (26) P. Möller, J. R. Nix, and K. -L. Kratz, At. Data Nucl. Data Tables 66, 131 (1997).
- (27) J.-U. Nabi and H. V. Klapdor-Kleingrothaus, At. Data Nucl. Data Tables 71, 149 (1999); 88, 237 (2004).
- (28) J.-U. Nabi, Eur. J. A. 40, 223 (2009); Astrophys. Space Sci. 331, 537 (2010); Eur. J. A. 48, 84 (2012).
- (29) N. Paar, T. Nikšić, D. Vretenar, and P. Ring, Phys. Rev. C 69, 054303 (2004); N. Paar, G. Colò, E. Khan, and D. Vretenar, Phys. Rev. C 80, 055801 (2009).
- (30) P. Sarriguren, Phys. Lett. B 680, 438 (2009); Phys. Rev. C 83, 025801 (2011).
- (31) A. F. Fantina, E. Khan, G. Colò, N. Paar, and D. Vretenar, Phys. Rev. C 86, 035805 (2012).
- (32) A. L. Cole et al., Phys. Rev. C 86, 015809 (2012).
- (33) A. Poves, J. Sánchez-Solano, E. Caurier, and F. Nowacki, Nucl. Phys. A694, 157 (2001).
- (34) M. Honma, T. Otsuka, B. A. Brown, and T. Mizusaki, Phys. Rev. C 65, 061301(R) (2002); 69, 034335 (2004).
- (35) J. Krumlinde and P. Möller, Nucl. Phys. A417, 419 (1984); P. Möller and J. Randrup, Nucl. Phys. A514, 1 (1990).
- (36) P. Möller, J. R. Nix, W. D. Myers, and W. J. Swiatecki, At. Data Nucl. Data Tables 59, 185 (1995).
- (37) J. A. Halbleib and R. A. Sorensen, Nucl. Phys. A98, 542 (1967).
- (38) K. Muto, E. Bender, and H.V. Klapdor, Z. Phys. A 333, 25 (1989); K. Muto, E. Bender, T. Oda, and H.V. Klapdor-Kleingrothaus, Z. Phys. A 341, 407 (1992).
- (39) F. Frisk, I. Hamamoto, and X. Z. Zhang, Phys. Rev. C 52, 2468 (1995).
- (40) P. Sarriguren, E. Moya de Guerra, A. Escuderos, and A. C. Carrizo, Nucl. Phys. A635, 55 (1998).
- (41) P. Sarriguren, E. Moya de Guerra, and A. Escuderos, Nucl. Phys. A658, 13 (1999).
- (42) P. Sarriguren, E. Moya de Guerra, and A. Escuderos, Nucl. Phys. A691, 631 (2001).
- (43) P. Sarriguren, E. Moya de Guerra, and A. Escuderos, Phys. Rev. C 64, 064306 (2001).
- (44) I. N. Borzov, Nucl. Phys. A 777, 645 (2006).
- (45) P. Sarriguren, E. Moya de Guerra, R. Álvarez-Rodríguez, Nucl. Phys. A716, 230 (2003).
- (46) E. Poirier et al., Phys. Rev. C 69, 034307 (2004).
- (47) E. Nácher et al., Phys. Rev. Lett. 92, 232501 (2004).
- (48) P. Sarriguren, R. Álvarez-Rodríguez, and E. Moya de Guerra, Eur. Phys. J. A 24, 193 (2005).
- (49) P. Sarriguren, Phys. Rev. C 79, 044315 (2009).
- (50) P. Sarriguren and J. Pereira, Phys. Rev. C 81, 064314 (2010).
- (51) Evaluated Nuclear Structure Data File (ENSDF), http://www.nndc.bnl.gov/ensdf/.
- (52) E. Chabanat, P. Bonche, P. Haensel, J. Meyer, and R. Schaeffer, Nucl. Phys. A635, 231 (1998).
- (53) N. Van Giai and H. Sagawa, Phys. Lett. B 106, 379 (1981).
- (54) D. Vautherin and D. M. Brink, Phys. Rev. C 5, 626 (1972); D. Vautherin, Phys. Rev. C 7, 296 (1973).
- (55) H. Flocard, P. Quentin, A. K. Kerman, and D. Vautherin, Nucl. Phys. A203, 433 (1973).
- (56) H. Homma et al., Phys. Rev. C 54, 2972 (1996).
- (57) A. Bohr and B. Mottelson, Nuclear Structure, (Benjamin, New York 1975).
- (58) P.B. Radha, D.J. Dean, S.E. Koonin, K. Langanke, and P. Vogel, Phys. Rev. C 56, 3079 (1997).
- (59) E. Caurier, K. Langanke, G. Martínez-Pinedo, and F. Nowacki, Nucl. Phys. A653, 439 (1999).
- (60) W. R. Hix et al., Phys. Rev. Lett. 91, 201102 (2003).
- (61) K. Iwamoto et al., Ap. J. Suppl. 125, 439 (1999).