Deep and Wide Photometry of Two Open Clusters NGC 1245 and NGC 2506: Dynamical Evolution and Halo
Abstract
We studied the structure of two old open clusters, NGC 1245 and NGC 2506, from a wide and deep photometry data acquired using the CFH12K CCD camera at CFHT. We devised a new method for assigning cluster membership probability to individual stars using both spatial positions and positions in the colour-magnitude diagram. From analyses of the luminosity functions at several cluster-centric radii and the radial surface density profiles derived from stars with different luminosity ranges, we found that the two clusters are dynamically relaxed to drive significant mass segregation and evaporation of some fraction of low-mass stars. There seems to be a signature of tidal tail in NGC 1245 but the signal is too low to be confirmed.
keywords:
galaxies: star clusters – open clusters: general – method: observation –techniques: photometric1 Introduction
Open clusters are useful examples for studying the dynamical evolution of stellar systems and the chemical evolution of the Galactic disc, because the stars in an open cluster are assumed to have the same chemical and dynamical properties owing to of their shared origin. Because open clusters orbit about the centre of the Galaxy near the Galactic plane, they are frequently disturbed by both giant molecular clouds and the tidal forces originating from the Galactic disc. In particular, old open clusters can be tracers of the structural and evolutionary history of the Galactic disc (Friel, 1995).
The structure of the old open clusters can be changed by dynamical evolution driven by internal and external tidal forces. Energy equipartition due to encounters among member stars (Spitzer, 1940) leads to mass segregation, which is characterized by the concentration of high-mass stars in the cluster’s centre, and an isotropic distribution of low-mass stars rambling throughout the cluster. Mass segregation results in the steeper slope of the mass function in the outer region of the cluster (Ann & Lee, 2002). Some fraction of low-mass stars evaporates from the cluster to create the halo surrounding the cluster (Eggen, 1993). The evaporation of low-mass stars also increases the size of the cluster because of the reduction of the binding energy.
| Cluster | age(Gyr) | [Fe/H] | ||||||
|---|---|---|---|---|---|---|---|---|
| name | J2000.0 | J2000.0 | (deg.) | (deg.) | ||||
| NGC 1245 | 03 14 47 | +47 13 53 | 0.24 | 12.25 | 1.08 | -0.08 | ||
| NGC 2506 | 08 00 02 | -10 46 15 | 0.035 | 12.47 | 2.31 | -0.24 |
Notes. – Units of right ascension are hours, minutes, and seconds; units of declination are degrees, arcminutes, and arcseconds.
Although internal interactions among member stars make the distribution of stars more spherical, perturbation by Galactic tidal forces results in an elongated shape. The elongated morphology of open clusters has been reported for the Hyades (Oort, 1979), Pleiades (Raboud & Mermilliod, 1998a), NGC 2287, and NGC 2548 (Bergond, Leon & Guibert, 2001). Chen, Chen and Shu (2004) also reported the elongated structure of 31 open clusters, which includes young star clusters that are a few million years old. Sharma et al. (2006) reported the elongated corona of 6 open clusters among 9 open clusters. They could not find a correlation between the age of a cluster and its core shape.
One possible origin of the elongated morphology of open clusters is a stretching of the stellar distribution along the cluster orbit (Chumak et al., 2010). Davenport & Sandquist (2010) represented the halo morphology of M67 is elongated shape using SDSS data, which is roughly aligned with the proper motion of the cluster. A relevant structure is the tidal tail caused by the Galactic tidal field (Chumak & Rastorguev, 2006). Because the evaporation of low-mass stars is likely to be isotropic, if there is no external force, the elongated shape of the halo of open clusters seems to be caused by the same mechanism that creates the tidal tails. Thus, it seems likely that a detailed analysis of halo structure provides important information about the dynamical history of open clusters. However, analysis of the spatial structure of open clusters is not easy, because it is extremely difficult to assign cluster membership without having kinematic information.
The membership of cluster stars is critical for any investigation of the dynamical structure of clusters. Earlier studies of dynamical evolution and halo structure were carried out for nearby clusters whose member stars were well defined by proper motion studies (Mermilliod et al., 1990; Perryman et al., 1998; Raboud & Mermilliod, 1998a, b). Since the kinematic data for membership determination is difficult to be attained for most of open clusters, especially for the faint stars, the colour-magnitude diagram (CMD) of clusters and surrounding field regions are used to correct the field star contamination in the cluster luminosity function (eg., Sung et al., 1999). There have been some attempts to determine membership probability of individual stars statistically using spatial densities (Chen, Chen and Shu, 2004) or stellar densities in CMD (Janes & Hoq, 2011). Here, we introduce a new method for assigning cluster membership probability based on locations in the CMD and projected spatial positions in the sky.
The aim of the present study is to understand the structures and dynamical properties of two old open clusters, NGC 1245 and NGC 2506, for which CCD photometry data has been reported by Lee, Kang & Ann (2012) (Paper I). Because the photometry was deep and wide enough to analyze the surface density distribution of low-mass stars around the tidal radii of NGC 1245 and NGC 2506, we expect to be able to describe the halo structures of the two clusters. We also expect to see the effects of dynamical evolution on the structure of open clusters when analyzing the radial dependence of LFs.
In §2, we describe the observational data and the cluster parameters. We describe membership probability in §3. The properties of dynamical evolution and halo are analyzed in §4. A brief summary and conclusions are given in the final section.
2 OBSERVATIONAL DATA
The data used in the present study are from the deep and wide field CCD photometry observations we conducted in a previous study (Paper I). A detailed description of the observations and data reduction are given in Paper I; however, we briefly describe the photometry here. We obtained the data using a CFH12K mosaic CCD camera mounted at the prime focus of the CFHT. The CFH12K CCD camera has the field of view with a pixel size of . We observed 6 regions in NGC 1245 and 3 regions in NGC 2506 (all of which were centred on the cluster centres), and which covered and for NGC 1245 and NGC 2506, respectively.
We followed the standard procedures for CCD reduction using IRAF and carried out PSF photometry using DAOPHOT (Stetson, 1987). The seeing size, defined as the FWHM of the stellar images, varied between and from region to region. For calibrating our photometry, we observed the SA 98 region (Landolt, 1992) on the same night. The limiting magnitude of the photometry is V 23. The cluster parameters are listed in Table 1; they were derived using the CMDs as described in Paper I.
3 MEMBERSHIP PROBABILITY

Traditionally, proper motion study is the most reliable method for determining the membership criteria of cluster stars. However, this method requires two observations separated by a long time interval. Therefore, most previous studies utilized membership criteria based on the locations of cluster stars in the CMDs (eg., Sung et al., 1999). This approach is very simple and effective when the main sequences do not overlap with wedge patterns of field stars in the CMD.
The main sequence and giant stars of a cluster are distributed along the cluster isochrone in the CMDs, whereas non-member stars are primarily distributed in a wedge shape with a random distribution outside the wedge pattern. There is also a clear difference in the spatial distributions of the cluster member stars and those of non-member stars. The cluster stars are likely to be centrally concentrated, whereas field stars are uniformly distributed, which leads to an outward decrease of the ratio of the number of member stars to the number of field stars. Thus, it seems plausible that we can differentiate the cluster members from the field stars using CMDs and the spatial distributions of stars in the cluster region.
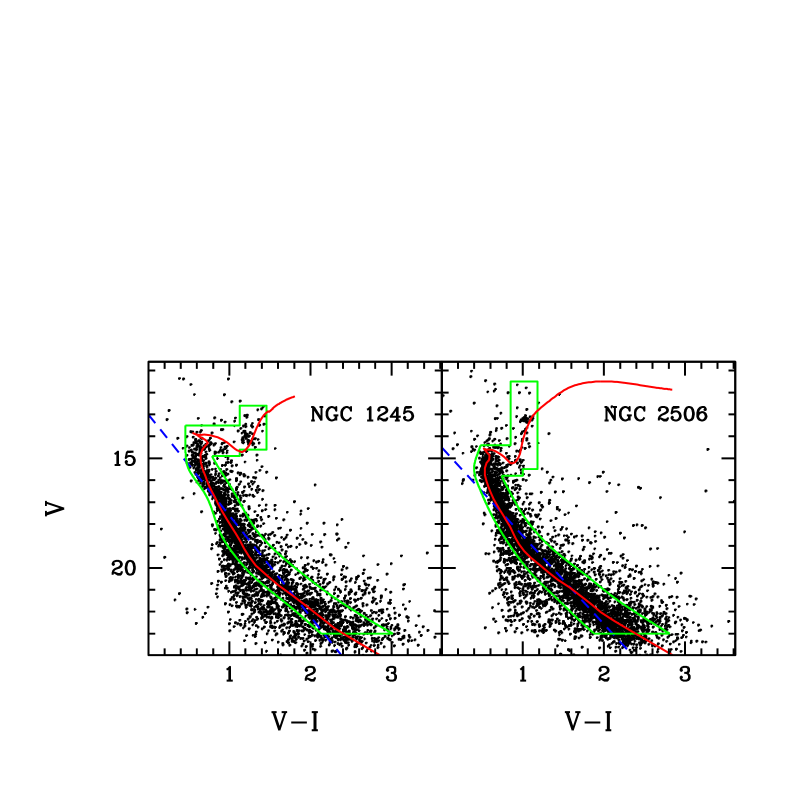
According to the stellar evolution theory, cluster members are distributed along the main sequence and giant branches in the CMD. To determine the boundaries of the two clusters within which the member stars are supposed to be located in the CMD, we derived the density distributions across the main sequence at each magnitude bin using stars in the central region, and fitted Gaussian functions to the density cross-sections along the main sequence. We smoothly connected the locations correspond to the 3 density levels to determine the photometric membership boundary in the CMDs (Fig. 1). For the giant stars we defined the boundaries based on the visual inspection of the giant stars in the CMD. We neglected the blue stragglers in defining the membership boundaries. The magnitude limits are for the clusters.
We define the membership probability of a star , , as a function of the coordinates in the four-dimensional (4-D) space that consists of two spatial coordinates in the sky and two photometric parameters constituting the CMD, namely . Thus, we consider a 4-D membership probability as follows. We counted the number of stars in a unit volume of the 4-D space centered on a point and then corrected for the contribution by field stars. We derived the field star distribution in CMD, i.e., , to correct for field star contamination using the stars in the outermost regions for NGC 1245 and for NGC 2506. If we assume that the distribution of field stars is homogeneous in the cluster region, the distribution function of cluster member stars in the 4-D space, , is determined from the following equation:
| (1) |
where is the distribution function of stars in the 4-D space, including both member and non-member stars.
Because field stars are mostly disc stars which are located in the Galactic plane where considerable density variation is expected, it is better to take into account the density variation of field stars. To investigate the variation of the spatial distribution of non-member stars, we derived the spatial distribution of field stars, using stars outside the cluster boundary, by calculating the normalized field star density distribution defined as
| (2) |
where is the spatial number density of stars outside the photometric membership boundaries in the CMD and is the average value of n(x,y). Thus, the mean value of is equal to 1. We derived by counting the number of stars in the smoothing box of , with sampling interval of . These sampling size and sampling interval were used through out the paper for the derivation of the surface number densities such as N (x,y,V,V-I) and g(x,y). The sampling size and sampling interval in the CMD are and . We used a Gaussian smoothing algorithm in 4-D space to derive the surface number densities.
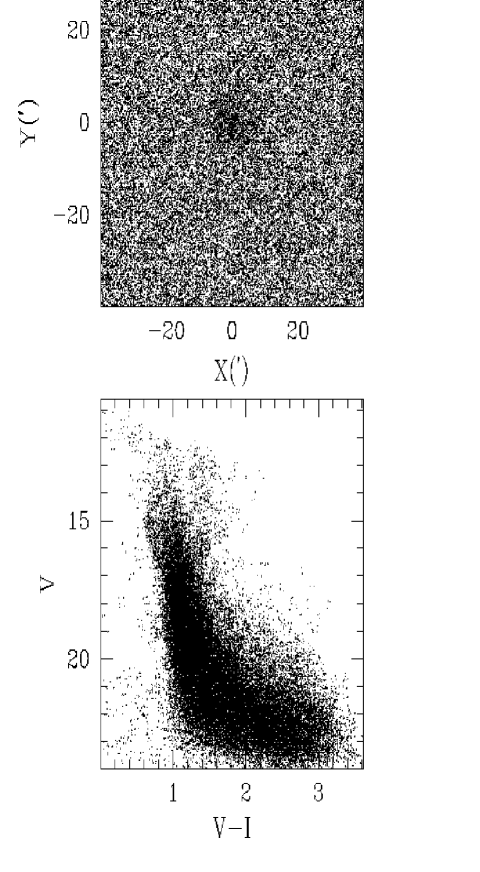
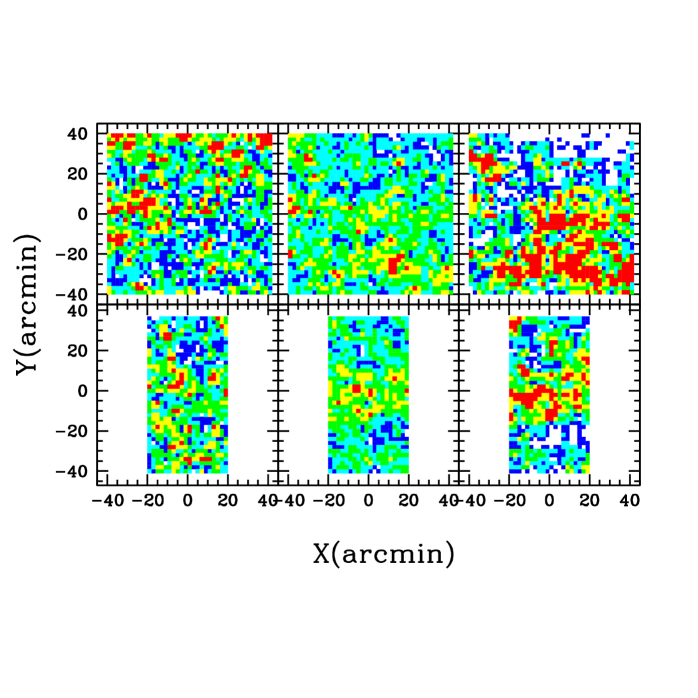
Fig. 2 shows the spatial distribution of non-member stars, represented by . The distributions of field stars below and above the main sequence are plotted in the right panels and left panels, respectively. The middle panels show the spatial distribution of all the field stars in the CMDs. The upper panels are for NGC 1245 and the lower panels are for NGC 2506. There are some differences in the spatial distributions of the stars in the right panels and left panels. In particular, the stars in the upper right panel, i.e, field stars below the main sequence of NGC 1245 show higher density in the middle south region of the cluster while those above the main sequence of NGC 1245 show higher density in the north-east part of the cluster. We suppose that this difference is caused by the gradient in the density distribution of field stars toward NGC 1245. The stars above the main sequence are likely to be foreground stars while those below the main sequence are likely to be background stars because the stars above the main sequence are brighter than those below the main sequence if they have similar colors.
Using , we rewrote the 4-D distribution function of cluster
member stars as
| (3) |
Then, the membership probability, , of a star is defined as
| (4) |
We derived the membership probability of all stars in the observed regions of the two clusters, however, we assigned to the stars outside the photometric membership boundary in the CMDs (Fig. 1).
To check the validity of the derived values of , we compared the membership probabilities of stars in NGC 2506 derived from the present method using and of (Chiu & van Altena, 1981) in Fig. 3. Chiu & van Altena (1981) derived the membership probabilities of 724 stars in NGC 2506 using two photographic plates with an epoch difference of 56.9 years. Their sky coverage is only in radius, with a magnitude limit of . As can be seen in Fig. 3, the majority of stars with a high membership probability () also have a high value. However, a significant fraction of high stars have a less than 0.7. This is because the proper motion study was confined to the stars in the central regions of the cluster, where high values of are assigned to stars if their CMD positions are within the photometric membership boundary. Thus, the present method of determining membership probabilities is likely to overestimate the membership probabilities for stars in the central region.
In order to see the robustness of segregating the cluster member stars from the field stars, we created artificial clusters using the radial density profile and the mass function of NGC 1245 via the Monte-Carlo technique. The spatial distribution of each star was determined by randomly generated radial positions assuming the King profile whereas the positions in the CMD were determined from the luminosity function assuming asymmetric Gaussian distribution for the colors at a given luminosity. We did not assume binary sequence explicitly but we took into account the binary effect by assuming three times larger for the Gaussian distribution for the color distributions in the right side of the main sequence. We also generated the artificial field stars by assuming homogeneous spatial distribution and the CMD positions of the field stars which are located at from the cluster centre. We derived the CMD position of each star by assigning magnitude and color randomly around each field star position in the CMD with and . We constrained the number of field stars by comparing the area where the field stars were selected and the total observed field of NGC 1245. In Fig. 5, we presented the spatial distributions and CMDs of an artificial cluster including artificial field stars.
We ran 100 simulations to see that the 4-D membership probability technique works correctly. Fig. 5 shows the fractional frequency distributions of the cluster members and non-members as a function of the 4-D membership probability . Most of the field stars have less than with of field stars have whereas of the cluster members have larger than 0.2. As can be seen in Fig. 5, if we randomly select a star with , the probability that this star is a field star is . But, if we randomly select a star with , the field star probability is whereas if we select a star with , that is less than . The reason for the relatively high number of member stars that have is the number of member stars is only of the field stars. This makes for member stars which are located in the regions where the surface density is greatly dominated by field stars. A predominance of field stars makes and consequently becomes zero (see eqs (3) and (4)). Thus, the member stars that have are mostly located in the region where field stars are distributed with a wedge pattern in the CMD.

4 STRUCTURE AND DYNAMICAL EVOLUTION OF OPEN CLUSTERS
4.1 Radial Surface Density Profiles
Similar to Chen, Chen and Shu (2004), we defined an effective surface number density by summing up the membership probabilities, , inside the observed area ,
| (5) |
where is the correction factor for incomplete photometry (Paper I). Because the position of maximum value of () depends upon the size of , we first determined the position of by calculating for all the pixel positions with . Then we determined the position of the cluster centre by averaging the coordinates of the pixels where is larger than . We derived the radial surface number density by calculating for concentric rings at a radial distance with radial interval of where n represents the nth ring and is the radius of the central region. Although is considered to be the surface number density corrected for field stars, there are some residuals, due to field stars which have positive owing to their CMD positions lying within the cluster membership boundaries. We calculated at for NGC 1245 and and for NGC 2506, respectively. Because depends on the smoothing box and sampling resolution, we optimized them to minimize . The adopted values of are for NGC 1245 and for NGC 2506. We subtracted from before fitting to the King profiles (King, 1962).
Fig. 6 and Fig. 7 show the logarithmic radial surface number density profiles of NGC 1245 and NGC 2506 with the best-fit King profiles which can be expressed as
| (6) |
where is the central surface number density, is core radius. We derived and by least-squares fitting technique. The radius for the cluster extent was taken to be , where the radial surface number density profiles becomes constant. We derived and for NGC 1245 and NGC 2506, respectively (paper I).


Since the effective radial surface number density near is comparable to , errors of affect the derived and significantly. For NGC 1245, variation of gave rise to and variations in and while they were reduced to to both and for NGC 2506.
We examined the dependence of on the luminosity of stars because the spatial distribution of stars depends on the stellar mass if the clusters under consideration are dynamically relaxed. We plotted the effective radial surface number density profiles along with best-fitted King profiles to show this dependence in Fig. 6 and Fig. 7. As expected, the effective radial surface number density profiles of bright stars have smaller core radius than those of faint stars (see Table 2). This is the very clear evidence of the mass segregation due to dynamical evolution of the clusters.
One thing worth to mention is the departure of the observed surface number density from the King profile at , which is more pronounced in NGC 1245. Although the difference between the observation and the King profile is within the Poisson errors, there is a possibility that they are caused by some real features such as tidal tails, especially in NGC 1245. We can see the morphology of these features in Fig. 9 where we found that there are over-dense regions at in the north-west of NGC 1245. However, the surface density of the over-dense region is about of the , the morphology of the over-dense regions are much affected by the errors in .
| cluster | Magnitude range | ||
|---|---|---|---|
| NGC 1245 | 8.3 | 2.3 | |
| 4.3 | 4.5 | ||
| 3.1 | 5.0 | ||
| 14.7 | 3.6 | ||
| NGC 2506 | 14.3 | 2.0 | |
| 15.2 | 3.7 | ||
| 10.4 | 6.0 | ||
| 33.5 | 4.0 |
4.2 Radial LFs
We derived the luminosity function (LF) of the clusters using the membership probability defined in equation 4. Because the number of stars at each magnitude interval, corrected for the field star contamination, is equal to the effective number of stars , it can be expressed as
| (7) |
where and are the membership probability and incompleteness correction factor, respectively, for stars with a magnitude interval . Then, the LFs at a radial distance from the cluster centre can be determined based on .
We considered three regions, , , and , to derive Radial dependence of LFs. The half number radius is the radius where the number of stars becomes half of the total number of stars within . They are and for NGC 1245 and NGC 2506, respectively.

Fig. 8 shows the radial LFs derived for the two open clusters, NGC 1245 and NGC 2506. The general trend of the LFs of the two open clusters under consideration is a gradual change of the peak positions; the LFs peak closes to the bright end of the inner region (), whereas the peak closes to the faint end in the outer region (). This means that fainter stars are likely to be found in the outer regions of the clusters, i.e., there is a clear evidence of mass segregation in the two clusters, NGC 1245 and NGC 2506.
Similar signatures of mass segregation were reported for M11 (Mathieu, 1984), Pleiades and Praesepe (Raboud & Mermilliod, 1998a, b), NGC 2099 (Kalirai et al., 2001b) and NGC 6819 (Kalirai et al., 2001a; Kang & Ann, 2002)). The reason for the observed mass segregation seems to be the dynamical evolution that leads to the energy equilibrium because these open clusters are old enough to be relaxed.


4.3 Halo Structures
To investigate the morphology and halo structure of the clusters, we plotted 2 dimensional effective surface number density distributions of NGC 1245 and NGC 2506 in Fig. 9 and Fig. 10, respectively. We plotted two contour levels. One corresponds to the effective surface number density of showing the representive morphology of the cluster and the other corresponds to the of the background density () showing the outer morphology of the cluster which can be detected above the background fluctuations. As can be seen in Fig. 9 and Fig. 10, NGC 1245 is more elongated than NGC 2506. There seems to be no relation between the direction of the major axis of NGC 1245 and the direction of the cluster proper motion (Loktin & Beshenov, 2003). We plotted the directions of cluster proper motion (Loktin & Beshenov, 2003) along with the directions of the Galactic latitude and longitude for comparison. There are some features resembling tidal tails in the north-west of NGC 1245. The surface number densities of these features are comparable to the of the which is times the central surface density ().
5 SUMMARY AND CONCLUSIONS
We proposed a new method for determining the cluster membership probability using the spatial positions together with the positions in the CMD. Owing to the ability to assign the membership probability for all the stars in the cluster field, we could trace the morphology of the clusters and derive the radial surface density profiles corrected for the field star contamination.
The validity of the present method of 4-D membership probability is confirmed by comparing our membership probabilities with those from proper motion studies in the central region of NGC 2506 (Chiu & van Altena, 1981). However, our method shows some bias to higher probability for stars in the central regions of the cluster. This bias is caused by assigning high probabilities to stars in the central regions of the cluster if they are located within the photometric membership boundary in the CMDs. We also tested the robustness of the segregation of non-member stars from the member stars by the Monte-Carlo simulations and found that the 4-D method assigns membership probability quite convincingly. The probability of a star with is a real cluster member is about . However, for better understanding of the structure of open clusters, we need kinematic data.
The two old open clusters NGC 1245 and NGC 2506 show an imprint of the dynamical evolution in their LFs and radial surface density profiles. The LFs of the inner region of the clusters are dominated by the giant and upper main-sequence stars, whereas those of the outer region of the clusters are dominated by low-mass stars. This effect is more pronounced in NGC 2506. Some fraction of low mass stars is expected to be evaporating from the cluster to create the tidal halo surrounding the cluster. The over-dense regions revealed in the effective number density contour map of NGC 1245 suggest the presence of the tidal halo at in the north-west of NGC 1245. The detection of the over-dense regions at was made possible due to our method of membership probability which took into account spatial positions together with the positions in the CMD, in addition to using wide and deep photometry of the two clusters (Paper I).
We found that the cluster core radius derived from bright stars is smaller than that from the faint stars. The dependence of core radius on the luminosity of stars is a strong evidence of the mass segragation in NGC 1245 and NGC 2506. Mass segregation and evaporation of the low mass stars are natural consequences of the dynamical evolution in relaxed clusters. Stars exchange their kinetic energy through encounters. Owing to the equipartition of the kinetic energy, high-mass stars have relatively low velocity, whereas low mass stars may have velocity that is sufficient to escape from the cluster. If the evaporated stars are tidally disturbed by the Galactic disc or giant molecular clouds during their orbital motion, they are likely to be stretched along the orbit (Chumak et al., 2010) to create tidal tails. A signature of tidal tail seems to be observed in NGC 1245 but the signal is too low to be confirmed.
Acknowledgments
We would like to thank Prof. Kenneth Janes whose comments improved the present paper significantly. This work was supported in part by the NRF research 2010-0023319 and supported in part by KASI(Korea Astronomy and Space Science Institute).
References
- Ann & Lee (2002) Ann H. B., Lee S. H., 2002, JKAS, 35, 29
- Bergond, Leon & Guibert (2001) Bergond G., Leon S., Guibert J., 2001, A&A, 377, 462
- Chen, Chen and Shu (2004) Chen W. P., Chen C. W., Shu C. G., 2004, AJ, 128, 2306
- Chiu & van Altena (1981) Chiu, L.-T. G., van Altena, W. F., 1981, ApJ, 243, 841
- Chumak & Rastorguev (2006) Chumak, Y. O., Rastorguev, A. S., 2006, AstL, 32, 157
- Chumak et al. (2010) Chumak Y. O., Platais, I. M., Dean E., Rastorguev, A. S., Chumak, O. V., 2010, MNRAS, 402, 1841
- Davenport & Sandquist (2010) Davenport, J. R. A., Sandquist, E. L. 2010, ApJ, 711, 559
- Eggen (1993) Eggen, O. J., 1993, AJ, 106, 1885
- Friel (1995) Friel E. D., 1995, ARA&A, 33, 381
- Gieles et al. (2006) Gieles, M., Portegies Zwart, S. F., Baumgardt, H., Athanassoula, E., Lamers, H. J. G. L. M., Sipior, M., & Leenaarts, J. 2006, MNRAS, 371, 793
- Janes & Hoq (2011) Janes, K. A., Hoq, S., 2011, AJ, 141, 92
- Kalirai et al. (2001a) Kalirai J. S., Ventura P., Richer Harvey B. Fahlman G. G., Durrell P. R., D’Antona F., Marconi G., 2001a, AJ, 122, 3239
- Kalirai et al. (2001b) Kalirai J. S., Venture P., Richer H. B., Fahlman G. G., Durrell P., Cuillandre J.-C., Venture P., D’antona F., Bertin E., 2001b, AJ, 122, 266
- Kang & Ann (2002) Kang Y.-W., Ann H. B., 2002, JKAS, 35, 87
- King (1962) King I., 1962, AJ, 67, 471
- Landolt (1992) Landolt A. U., 1992, AJ, 104, 340
- Lee, Kang & Ann (2012) Lee S. H., Kang Y.-W., Ann H. B., 2012, MNRAS, 425, 1567
- Loktin & Beshenov (2003) Loktin, A. V. and Beshenov, G. V., 2003, ARep, 47, 6
- Mathieu (1984) Mathieu, R. D., 1984, ApJ,284, 643
- Mermilliod et al. (1990) Mermilliod J.-C., Weis E. W., Duquennoy A., Mayor M., 1990, A&A, 235, 114
- Oort (1979) Oort, J. H., 1979, A&A, 78, 312
- Perryman et al. (1998) Perryman M. A. C., Brown A. G. A., Lebreton Y., Gomez A., Turon C., Cayrel de Strobel G., Mermilliod J. C., Robichon N., Kovalevsky J., Crifo, F., 1998, A&A, 331, 81
- Raboud & Mermilliod (1998a) Raboud D., Mermilliod J.-C., 1998a, A&A, 329, 101
- Raboud & Mermilliod (1998b) Raboud D., Mermilliod J.-C., 1998b, A&A, 333, 897
- Sharma et al. (2006) Sharma S., Pandey A. K., Ogura K., Mito, H., Tarusawa K., Sagar, R., 2006, AJ, 132, 1669
- Spitzer (1940) Spitzer L. Jr., 1940, MNRAS, 100, 396
- Stetson (1987) Stetson P. B., 1987, PASP, 99, 191
- eg., Sung et al. (1999) Sung H., Bessell M. S., Lee, H.-W., Kang, Y. H., Lee, S.-W., 1999, MNRAS, 310, 982
- Terlevich (1987) Terlevich E., 1987, MNRAS, 224, 193