Coevolution of dust, gas, and stars in galaxies - I. Spatial distributions and scaling-relations of dust and molecular hydrogen
Abstract
We investigate the time evolution of dust properties, molecular hydrogen () contents, and star formation histories in galaxies by using our original chemodynamical simulations. The simulations include the formation of dust in the stellar winds of supernovae (SNe) and asymptotic giant branch (AGB) stars, the growth and destruction processes of dust in the interstellar medium (ISM), the formation of polycyclic aromatic hydrocarbon (PAH) dust in carbon-rich AGB stars, the formation on dust grains, and the photo-dissociation due to far ultra-violet (FUV) light in a self-consistent manner. We focus mainly on disk galaxies with the total masses ranging from and in this preliminary study. The principle results are as follows: The star formation histories of disk galaxies can be regulated by the time evolution of interstellar dust, mainly because the formation rates of can be controlled by dust properties. The observed correlation between dust-to-gas-ratios () and gas-phase oxygen abundances () can be reproduced reasonably well in the present models. The disks show negative radial gradients (i.e., larger in inner regions) of fraction (), PAH-to-dust mass ratio (), , and and these gradients evolve with time. The surface-mass densities of dust () are correlated more strongly with the total surface gas densities () than with those of (). Local gaseous regions with higher are more likely to have higher in individual disks and total masses () correlate well with total dust masses (). More massive disk galaxies are more likely to have higher , , and and smaller dust-to-stellar mass ratios (). Early-type E/S0 galaxies formed by major galaxy merging can have lower than isolated late-type disk galaxies. We also compare between galactic star formation histories in the metallicity-dependent and dust-dependent star formation models and find no major differences. Based on these results, we discuss the roles of dust in chemical and dynamical evolution of galaxies.
keywords:
ISM: dust, extinction – galaxies:ISM – galaxies:evolution – infrared:galaxies – stars:formation1 Introduction
One of the many important roles of interstellar dust in galaxies is the formation of molecular hydrogen () on its surface (e.g., Gould & Salpeter 1963; Hollenbach & Salpeter 1971; Cazaux & Tielens 2002). Giant molecular clouds (GMCs) composed of are the major formation sites of stars in galaxies (e.g., Blitz 1993; Fukui & Kawamura 2010). Global star formation rates of galaxies are observed to be well correlated with surface mass densities of interstellar gas (e.g., Schmidt 1959; Kennicutt 1998). Dust can originate from stellar winds of AGB stars (e.g., Ferrarotti & Gail 2006; Zhukovska et al. 2008) and supernovae (e.g., Kozasa et al. 1991; Nozawa et al. 2003), and therefore the production rate of dust in a galaxy can be determined by the star formation history that controls the formation rates of AGB stars and supernovae. Thus, the evolution processes of dust, gas, and stars are mutually related, and detailed investigation of these coevolution processes can lead us to the better understanding of galaxy formation and evolution.
Recent observational studies by infrared space telescopes have revealed physical properties of dust, their spatial distributions, and their correlations with their host galaxy properties in nearby and distant galaxies (e.g., Draine et al. 2007; Meixner et al. 2010; Roman-Duval et al. 2010; Takagi et al. 2010; Dunne et al. 2011; Kaneda et al. 2011; Cortese et al. 2012; Skibba et al. 2012; Smith et al. 2012). For example, Draine et al. (2007) have investigated the total dust mass, the mass fraction of the dust contributed by PAHs, and the correlation between gas-phase oxygen abundance (=12 +log(O/H)) and the dust-to-gas ratio () for 65 nearby galaxies and found that the average PAH fraction in galaxies with is 3.55%. Smith et al. (2012) have found a significant difference in the dust-to-stellar-mass ratio between late-type spirals and S0s and thus provided a new clue to the origin of S0s. Meixner et al. (2010) and Skibba et al. (2012) have derived the detailed 2D maps of , dust temperature, and PAH fraction in the Large Magellanic Cloud (LMC).
Recent multi-wavelength observational studies of nearby galaxies have investigated physical correlations between surface densities of star formation (), neutral hydrogen (H i; ), and () and discussed key parameters that control global star formation in galaxies (e.g., Bigiel et al. 2008; Leroy et al. 2008). These observation have also provided data sets for radial gradients of H i and gas, which are quite useful for discussing what can determine the H i and gas mass fractions in galaxies. High-resolution observational studies of GMCs for galaxies in the Local Group (e.g., LMC and M33) have provided vital clues to how individual GMCs composed of form from local H i and how star formation proceeds within GMCs (e.g., Rosolowsky et al. 2003; Kawamura et al. 2009). A number of recent observational studies have investigated correlations between properties of dust (e.g., and ) and gas (e.g., chemical abundances and ) in galaxies (e.g., Leroy et al. 2011).
These observational results have raised the following three key questions on the origin of dust and gas in galaxies. The first is what physical processes are responsible for the observed spatial variation of dust properties within galaxies (e.g., radial variation of and PAH-dust mass fraction; Meixner et al. 2010). The majority of previous theoretical studies of dust formation and evolution in galaxies are based on one-zone (or multi-zone) chemical evolution models (e.g., Dwek 1998, D98; Lisenfeld & Ferrara 1998; Hirashita 1999; Edmunds 2001; Calura et al. 2008; Piovan et al. 2011). Although such previous models provided theoretical explanations for a number of key observational results on dust properties in galaxies (e.g., relation), they did not allow astronomers to discuss the spatial distributions of dust properties and their correlations with other galaxy properties (e.g., Hubble morphological types). Therefore, it is largely unclear in these previous studies what physical mechanisms are responsible for the observed spatial distributions of dust properties in galaxies.
The second question pertains to the determinant factors for properties and their correlations with galaxy properties (e.g., luminosities and metallicities). Previously, Elmegreen (1993) theoretically discussed the importance of the pressure and radiation field of the interstellar medium in the transition from H to in galaxies. Blitz & Rosolowsky (2004) also investigated the importance of gas pressure in transition based on observational data from nearby 28 galaxies. Recent numerical simulations have incorporated the formation process from H i (e.g., Pelupessy et al. 2006, P06; Robertson & Kravtsov 2008, RK08; Gnedin et al. 2009; Christensen et al. 2012), which means that theoretical studies will soon contribute to the solution of the above problem. The formation model dependent only on gaseous metallicities and densities proposed by Krumholz, McKee & Tumlinson (2009, KMT09) is practically useful for investigating formation and star formation from in galaxies and thus used in recent semi-analytic models (e.g., Fu et al. 2010; Lagos et al. 2012) and numerical simulations (Kuhlen et al. 2012, K12). However, these recent formation models assume that dust abundances are linearly proportional to metallicities (i.e., dust-to-metal ratio, , is constant), which is inconsistent with observations (e.g., Galamex et al. 2011) which show a large dispersion in for a given (i.e., significantly different ). Furthermore, such an assumption of constant is incompatible with dust evolution models that predict significant evolution with time in galaxies (e.g., Inoue 2003; Calura et al. 2008). Thus we need to improve formation models by incorporating dust formation and evolution in order to discuss the second question in a more quantitative manner.
| Properties | Physical meanings | References 111 ‘Prediction’ means that only predicted properties are presented: observational results are yet to be obtained. Only one representative reference is given. A full list of relevant papers is given in the main text. |
|---|---|---|
| Correlations between gas-phase oxygen abundance () and dust-to-gas ratios () | Galametz et al. (2011) | |
| Correlations between and PAH-to-dust ratios () | Draine et al. (2007) | |
| The dependences of on in local ISM | Prediction | |
| Correlations between local surface densities of dust () and those of total gas () | Leroy et al. (2011) | |
| Correlations between local surface densities of dust () and those of () | Leroy et al. (2011) | |
| Radial gradients of | Pappalardo et al. (2012) | |
| Radial gradients of | Meixner et al. (2010) | |
| Correlations between total dust masses () and total gas masses () | Corbelli et al. (2012) | |
| Correlations between dust-to-star mass ratios () and total stellar masses () | Cortese et al. (2012) | |
| The dependences of local on local stellar surface densities () | Prediction |
The third question is on the origin of the observed correlations between dust and galaxy properties (e.g., dust-to-stellar mass ratio along the Hubble morphological types; Cortese et al. 2012) and between dust and gas properties (e.g., gas surface densities dependent on dust surface densities; Leroy et al. 2011). In order to discuss this third question in a quantitative manner, theoretical studies need to model both (i) the time evolution of dust/gas contents and star formation rates in galaxies and (ii) the dynamical evolution of galaxies in a self-consistent manner. Only a few previous models included the formation and destruction of dust and formation on dust grains in a self-consistent manner and thereby discussed the time evolution of dust properties (e.g., Hirashita & Ferrara 2002; Yamasawa et al. 2011). Since they did not explicitly include dynamical evolution of galaxies in their models, the above-mentioned correlations were not addressed at all.
Chemodynamical simulations are useful and powerful tools for investigating both the spatial distributions of stellar and gaseous abundances and galaxy scaling relations simultaneously (e.g., Theis et al. 1992; Bekki & Shioya 1999; Kawata 2001; Revaz & Jablonka 2012; RJ12) and thus should be also useful for theoretical studies on spatial distributions and scaling relations of dust and properties: we can not discuss the above key problems related to dust and distributions without performing chemodynamical simulations. However, even the latest chemodynamical simulations with more sophisticated models for the time evolution of variously different chemical abundances (e.g., Rahimi & Kawata 2012, RK12; Bekki et al. 2012; B12) did not explicitly include the formation and evolution of dust. Although recent hydrodynamical simulations have incorporated formation on dust grains (e.g.,P06), they did not incorporate the time evolution of dust properties in a self-consistent manner. Thus it is high time for us to develop a new chemodynamical model with dust and formation and thereby to try to answer the above three key questions.
The three purposes of this paper are as follows. Firstly, we describe the details of the new simulation methods by which we can investigate 3D distributions of dust, , and stars of galaxies in a self-consistent manner. Secondly, we present the preliminary results on the time evolution of dust and contents and star formation histories of disk galaxies and their dependences on the model parameters of the simulations. Thirdly, we discuss recent observational results for dust and properties of galaxies and their correlations with their host galaxy properties based on the present simulation results; several of these observations to be compared with the present simulations are summarized in Table 1. It should be stressed that these observations of the spatial distributions of dust and and their correlations with galaxy properties can be appropriately addressed only by chemodynamical simulations with dust evolution such as the present one. This is the first paper of a series of papers on the coevolution of dust, gas, and stars in galaxies. We therefore focus exclusively on the details of the new numerical methods and the preliminary results. We discuss other important issues such as the evolution of dust composition, the important influences of dust on star formation and chemical evolution histories of galaxies, and the derivation of spectra energy distributions from the results of chemodynamical simulations in our future papers.
The plan of the paper is as follows: In the next section, we describe our new chemodynamical model with the formation and evolution of dust and . In §3, we present the numerical results on the long-term evolution of physical properties of dust and and their correlations (e.g., relation) in disk galaxies. In this section, we also discuss the dependences of the results on the adopted model parameters. In §4, we discuss the latest observational results on dust and properties of galaxies derived mainly from the and telescopes. We also compare the predicted dust scaling relations with the corresponding observed relations in this section. We summarize our conclusions in §5.
2 The chemodynamical model
We mainly investigate the time evolution of dust and properties in forming disk galaxies embedded in massive dark matter halos with their physical properties (i.e., radial density profiles) consistent with predictions of a Cold Dark Matter (CDM) cosmology (e.g., Navarro et al. 1996; NFW). The present chemodynamical model incorporates chemical evolution of variously different elements (e.g., He, C, N, O, Mg, and Ca), chemical enrichment by Type Ia, Type II, and aspherical supernovae (SNIa, SNII, and ASN respectively) and AGB stars, supernova feedback effects of SNIa and SNII, formation and destruction of dust, formation, metallicity-dependent radiative cooling, and -regulated star formation. Therefore the present model is a much improved version of those used in investigating chemodynamical evolution of galaxy mergers (Bekki & Shioya 1999) and disk galaxy evolution in groups (Bekki & Couch 2011).
In order to perform numerical simulations on GPU clusters, we have revised our previous chemodynamical code (‘GRAPE-SPH’; Bekki 2009) that can be run on the special computer for gravitational dynamics (GRavity PipE; Sugimoto et al. 1990). In the present paper, we describe only the key ingredients of the code; the full details of the new code (including the code performance) will be described in our forthcoming paper (Bekki 2013). Recent numerical simulations with -regulated star formation (P06; R08; K12), the results of which are compared with those of this paper, do not include the important feedback effects of ASN on the interstellar mediums (ISM) of galaxies, which are investigated in B12. We therefore disable the code’s function of feedback effects and chemical enrichment by ASN in the present study. For convenience, physical meanings of symbols often used in the present study are summarized in Table 2.
2.1 Chemical enrichment
Chemical enrichment through star formation and metal ejection from SNIa, II, and AGB stars is considered to proceed locally and inhomogeneously. SNe and AGB stars are the production sites of dust, and some metals ejected from these stars can be also accreted onto dust grains in the ISM of galaxies. We investigate the time evolution of the 11 chemical elements of H, He, C, N, O, Fe, Mg, Ca, Si, S, and Ba in order to predict both chemical abundances and dust properties in the present study. The mean metallicity for each th stellar particle is represented by . The total mass of each th () chemical component ejected from each th stellar particles at time is given as
| (1) |
where is the mass of the th stellar particle, is the mass of each th chemical component ejected from stars per unit mass at time , and represents the time when the th stellar particle is born from a gas particle. is given equally to neighbor SPH gas particles (with the total number of ) located around the th stellar particle. Therefore, the mass increase of each th chemical component for th gas particle at time () is given as
| (2) |
where is the total number of neighbor stellar particles whose metals can be incorporated into the th gas particle.
We consider the time delay between the epoch of star formation and those of supernova explosions and commencement of AGB phases (i.e., non-instantaneous recycling of chemical elements). Therefore, the mass of each th chemical component ejected from each th stellar particle is strongly time-dependent. In order to derive the mass-dependent lifetimes of stars that become SNe Ia, SNe II, and AGB stars, we estimate the main-sequence turn-off mass () for stellar particles. We do so by using the following formula (Renzini & Buzzoni 1986):
| (3) |
where is in solar units and time in years.
We adopt the ‘prompt SN Ia’ model in which the delay time distribution (DTD) of SNe Ia is consistent with recent observational results by extensive SN Ia surveys (e.g., Mannucci et al. 2006; Sullivan et al. 2006). In this prompt SN Ia mode, there is a time delay () between the star formation and the metal ejection for SNe Ia. We here adopt the following DTD ()) for 0.1 Gyr 10 Gyr, which is consistent with recent observational studies on the SN Ia rate in extra-galaxies (e.g., Totani et al. 2008; Maoz et al. 2010, 2011):
| (4) |
where is a normalization constant that is determined by the number of SN Ia per unit mass (which is controlled by the IMF and the binary fraction for intermediate-mass stars for the adopted power-law slope of ). This adoption is pointed out to be necessary to explain the observed chemical properties of the LMC (Bekki & Tsujimoto 2012)
The fraction of the stars that eventually produce SNe Ia for 3–8 has not been observationally determined and thus is regarded as a free parameter, . It is confirmed that the present results on dust and properties do not depend so strongly on for in the present study. We therefore show the results of the models with , which is a reasonable value for investigating luminous disk galaxies like the Galaxy (e.g., Tsujimoto et al. 2010). The chemical yields adopted in the present study are the same as those used in Bekki & Tsujimoto (2012) except those from AGB stars. We adopt the nucleosynthesis yields of SNe II and Ia from Tsujimoto et al. (1995; T95) and AGB stars from van den Hoek & Groenewegen (1997; VG97) in order to estimate in the present study.
2.2 Dust model
The present dust model is essentially the same as that adopted in the previous multi-zone model by D98, which reproduced reasonably well the observed chemical and dust properties of the Galaxy in a self-consistent manner. The dust model consists of the following four components: (i) production in stellar winds of SNe Ia and SNe II and AGB stars, (ii) accretion of metals of ISM on dust grains, (iii) destruction of dust by energetic SN explosions, and (iv) PAH formation. The present model is somewhat idealized in that it does not include coagulation of small dust grains and time evolution of dust sizes that have been recently investigated in some one-zone models (e.g., Hirashita 2012). In the present paper, we focus exclusively on the most important processes related to dust formation and evolution in galaxies. The influences of dust coagulation and dust size evolution will therefore be investigated in our forthcoming paper.
| Symbol | Physical meaning |
|---|---|
| gas-phase oxygen abundances | |
| dust-to-gas ratio | |
| mass fraction of molecular hydrogen () | |
| PAH-to-dust mass ratio | |
| surface mass density of | |
| surface mass density of gas (H i+) | |
| surface mass density of metals () | |
| surface mass density of dust | |
| surface mass density of PAH dust | |
| surface mass density of stars | |
| mass ratio of dust to star () | |
| initial dust-to-metal ratio in gas | |
| mass fraction of metals locked up in dust | |
| threshold gas density for star formation | |
| dust accretion timescale | |
| dust destruction timescale | |
| initial dark halo mass |
| Physical properties | Parameter values |
|---|---|
| Total Mass 222, where and are the total masses of dark matter halo and gas in a galaxy, respectively. | |
| Structure 333 The NFW profile with a virial radius () and a parameter is adopted for the structure of dark matter halo. | kpc, |
| Gas fraction | |
| Spin parameter | |
| Chemical yield | T95 for SN, VG97 for AGB |
| Initial metallicity | |
| Dust formation | Gyr, Gyr |
| PAH 444 is the mass fraction of PAH dust to total dust in the stellar ejecta of C-rich AGB stars. | |
| Dust yield | D98-type |
| Initial dust/metal ratio | 0.1 |
| Hubble-type | late-type disk (isolated) |
| Feedback 555 is the binary fraction of stars that can finally explode as SNe Ia. | SNIa () and SNII |
| SF 666 is the threshold gas density for star formation and interstellar radiation field (ISRF) is included in the estimation of mass fraction in this model. | -dependent, ISRF, cm-3 |
| IMF | Salpeter () |
| Particle number | , |
| Softening length | pc, pc |
| Gas mass resolution |
2.2.1 Production
The total mass of th component (=C, O, Mg, Si, S, Ca, and Fe) of dust from th type of stars ( = I, II, and AGB for SNe Ia, SNe II, and AGB stars, respectively) is described as follows;
| (5) |
where is the condensation efficiency (i.e., the mass fraction of metals that are locked up in dust grains) for each th chemical component from th stellar type, is the function that determines the total mass of metals that can be used for dust formation, and is the mass of th component ejected from th stellar type. The total mass of stellar ejecta is estimated by using stellar yield tables by T95 and VG97. For stars with the initial masses () larger than , is as follows:
| (6) |
In the above estimation of , the summation is done for Mg, Si, S, Ca, and Fe (i.e., ) and is the mass of th element in atomic mass units. This formula for SNe II is used for SNe Ia in the present study. and are 0.8 for =Mg, Si, S, Ca, and Fe and 0.5 for C.
For stars with and in the ejecta, is as follows:
| (7) |
The ejecta from these C-rich stars is assumed to have in the present study (i.e., the same value adopted by D98).
For stars with and in the ejecta, is as follows:
| (8) |
In the above estimation of , the summation is done for Mg, Si, S, Ca, and Fe (i.e., ). are 0.8 for Mg, Si, S, Ca, and Fe. Although a range of values could be adopted in the present study, we investigate mainly the models with the parameter values adopted above. These dust yield models are referred to as ‘D98-type yield’ for convenience in the present study. We discuss the total amount of dust and do not discuss the dust composition in detail.
For comparison, we also investigate some models in which the mass fraction () of dust among all gas (metals + dust) ejected from a star does not depend on the stellar mass. These models are referred to as ‘uniform yield’ for convenience. We investigate models with uniform yield, mainly because several earlier one-zone models adopted such models for their investigation on the origin of the observed relation. Although the dust mass fraction () is a (fixed) free parameter, we show the models with . This is because the models with can better explain the observed of galaxies. We mainly show the results of the models with D98-type yield rather than those with uniform one in the present study.
2.2.2 Accretion
Dust grains can grow by accretion of metals of ISM onto preexisting cores and this accretion process is included in previous models (D98). Following D98, we consider that the key parameter in dust accretion is the dust accretion timescale (). In the present study, this parameter can vary between different gas particles and is thus represented by for th gas particle. The mass of th component (=C, O, Mg, Si, S, Ca, and Fe) of dust for th gas particle at time () can increase owing to dust accretion processes. The mass increase is described as
| (9) |
where is the individual time step width for the th gas particle and is the fraction of the th chemical element that is locked up in the dust. Owing to this dust growth, the mass of th chemical component that is not locked up in the dust () can decrease, which is simply given as
| (10) |
As is clear in these equations, the total mass of th component in th gas particle () is . It should be stressed that the notation for dust mass here is for each particle whereas that for dust mass in §2.2.1 is for each star.
Although can be locally different and time-dependent owing to complicated chemical and dynamical evolution of galaxies, we adopt a fixed value for all gaseous particles in a simulation. The fixed value (denoted ) varies between different models. As described later, we need to choose carefully this in order to reproduce the observed dust properties (e.g., ) in disk galaxies. Thus we avoid introducing additional free parameters for possibly dependent on time and the ISM properties in the present study.
2.2.3 Destruction
Dust grains can be destroyed though supernova blast waves in the ISM of galaxies (e.g., McKee 1989) and the destruction process is parameterized by the destruction time scale () in previous one-zone models (e.g., Lisenfeld & Ferrara 1998; Hirashita 1999). Following the previous models, the decrease of the mass of th component of dust for th gas particle at time due to dust destruction process is as follows
| (11) |
where is the dust destruction timescale for th particle. The dust destroyed by supernova explosions can be returned back to the ISM, and therefore the mass of th chemical component that is not locked up in the dust increases as follows:
| (12) |
Although can possibly vary for different particles owing to different physical conditions of the local ISM, we adopt a fixed value (denoted as ) for all gas particles in the present study. We consider that a reasonable is 0.5 Gyr (D98) and show the results of the models with Gyr: As described later (§2.7), only a narrow range of is allowed for reproducing observational results. The dust destruction can occur only for gas particles that are located in the surrounding regions of SNe Ia and SNe II only for a timescale of in the present study.
Thus the equation for the time evolution of th component of metals for th gas particle are given as
| (13) |
Likewise, the equation for dust evolution is given as
| (14) |
Dust is locked up in stars as metals are done so, when gas particles are converted into new stars. This means that star formation process itself has an effect of destroying dust in the present study.
2.2.4 PAH
A growing number of observational studies on PAH properties have been accumulated for galaxies within and beyond the Local Group (e.g, Draine et al. 2007; Meixner et al. 2010; Takagi et al. 2010; Sandstrom et al. 2012). It is accordingly timely for the present study to discuss the origin of the observed PAH properties in galaxies by using the new chemodynamical model. The most promising formation site of interstellar PAH dust is C-rich AGB stars, though direct observation supporting PAH formation in stellar winds of AGB stars is very weak (e.g., Tielens 2008 for a recent review). We consider that some fraction of carbon dust produced by C-rich AGB stars () can finally become PAH dust and thereby investigate the PAH properties in the present study. The mass fraction of PAH dust to total carbon dust in the ejecta of C-rich AGB stars is a parameter denoted as . Using low-resolution simulations with different , we find that can better explain observations (described later in §2.7). We therefore show the results of the models with in the present study.
2.3 formation and dissociation
Previous different numerical simulations estimated the mass fractions of to total hydrogen gas () in galaxies by using different formation models (P06; R08; K12). The model adopted in the present study is essentially similar to that used in P06 in the sense that is determined by local far-UV (FUV) radiation fields and gas densities. One of the important differences between P06 and the present study is that the time evolution of dust abundances and compositions are explicitly followed and used for estimating formation rates of local regions of galaxies in the present study. for each local region in a galaxy is determined by the balance between formation and dissociation by FUV radiation. The formulas used in Goldshmidt & Sternberg (1995) and Draine (2009) are adopted in deriving .
2.3.1 formation on dust grains
The formation on dust grains via grain catalysis has been extensively investigated by many authors (e.g., Gould & Salpeter 1963; Hollenbach & Salpeter 1971; Cazaux & Tielens 2002). A key parameter for the process is the total grain geometric cross section per H nucleon and is defined as
| (15) |
where , , and are the sizes of dust grains, the size distribution, and the hydrogen number density, respectively (Draine 2009). is often denoted in units of cm2 H-1 (Spitzer 1978) for convenience (i.e., cm2 H-1). The formation rate is given as
| (16) |
where , , and are the number density of atomic hydrogen, molecular hydrogen, and the effective rate coefficient, respectively. is given as
| (17) |
where , , , and are the Boltzmann constant, the temperature of gas, the mass of a hydrogen atom, and the formation efficiency averaged over the grain surface area, respectively. Observationally, is determined ( cm3 s-1; Jura 1975) so that the product of and can be estimated (; Draine 2009).
We do not investigate the time evolution of the dust size distributions of galaxies in the present study. We assume therefore that is constant and thus is determined by the dust-to-gas ratio (). We adopt a reasonable value of for classical silicate and carbonaceous grains (Draine 2009), though the adopted value could be a lowest possible value for the grains with the sizes larger than m (Draine 2009). for th gas particle is determined as follows
| (18) |
where and are the temperature and the dust-to-gas ratio of th gas particle, respectively, and is the dust-to-gas ratio for the Galaxy (0.0064; Zubko et al. 2004).
2.3.2 Formation/destruction equilibrium
Goldshmidt & Sternberg (1995) adopted a plane-parallel equilibrium cloud model and thereby estimated the mass-ratios of to H by solving the following equation that describes the balance between formation and dissociation by FUV radiation fields:
| (19) |
where is the unattenuated photo-dissociation rate for a unit incident FUV photon flux within the 11.2 to 13.6 eV band, and is the FUV intensity scaling factor relative to the unit FUV field, is the self-shielding function, () is the column density of (H i), and is the optical depth for FUV continuum and given as , where is the dust absorption cross section per hydrogen nucleus in the FUV wavelength range.
By substituting and for and , respectively, in the above equation, a separate differential equation can be derived as follows
| (20) |
where (=) is fixed. By solving the above equation, the total column density () can be derived and written as a function of , , , , and , and as follows
| (21) |
where the dimensionless is described as
| (22) |
and is described as
| (23) |
We can estimate , , , and for each gas particle by using the local gas density, dust-to-gas ratio, and interstellar radiation field (ISRF) of the particle in the present simulations (described later). Therefore, by estimating for a reasonable function of , we can derive and for each gas particle (by using or ). Draine & Bertoldi (1996) derived an approximation for as follows
| (24) |
where and ( is the Doppler broadening parameter and equal to 3 km s-1). Although this is a reasonably accurate approximation (Draine 2009), we can not have an analytic formula for estimating (as a function of ), if we use this. Therefore, we adopt the following approximation from P06:
| (25) |
where is a characteristic column density of cm-2. Since , we can derive an analytic formula for in equation (23), which allows us to save computational time significantly in the present simulations.
2.3.3 ISRF
In order to estimate for each gas particle, we use the spectral energy distributions (SEDs) for stellar populations with different ages and metallicities derived by Bruzual & Charlot (2003; BC03). We first find stellar particles that are located within (i.e., gravitational softening length for gas particles) of a gas particle, then derive the total flux at 1000Å around the gas particle from the sum of the SEDs of the stellar particles by using the SEDs of BC03. Finally, we estimate the FUV flux density around the gas particle for the local volume (, where ) at each time step. We confirm that the present results do not depend on and discuss the results of the models with different in Appendix A. For consistency with the present IMF adopted for chemical evolution and star formation histories of galaxies, we use the SEDs of BC03 for the Salpeter IMF ().
2.3.4
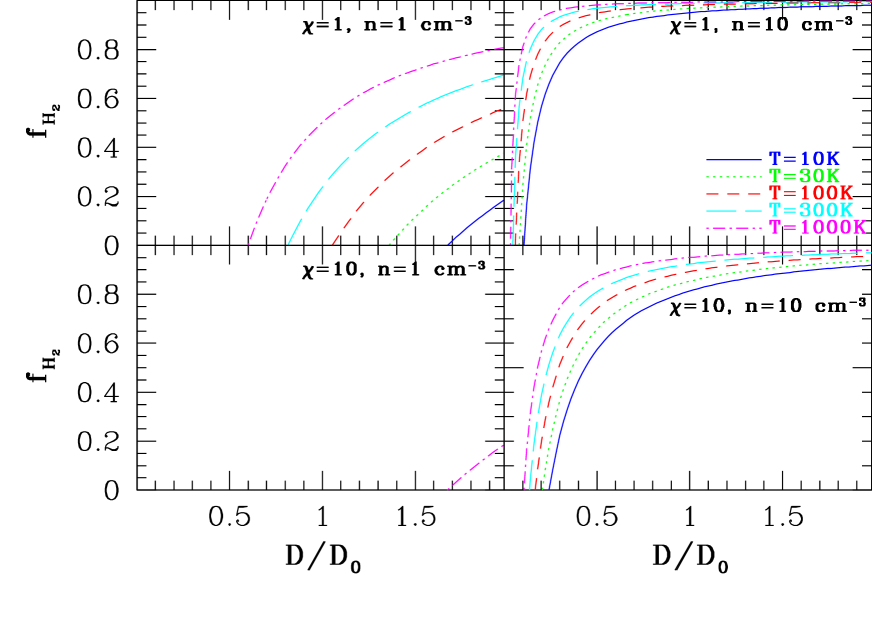
We can estimate (and ) and thus for th gas particle by substituting the values of the temperature (), dust-to-gas ratio (), ISRF (), and hydrogen gas density () in these equations (19), (21), (22), (23), and (25). Since the formation rate and dust absorption cross section () depend on (e.g., cm2), depends strongly on dust properties in the present study. In converting into for th gas particle, we use the local smoothing length () of the particle (i.e., ). Fig. 1 shows an example of -dependence of for a gas cloud size () of 100pc, or 10, or 10 cm-3 and five different (=10, 30, 100, 300, and 1000 K).
2.3.5 Z-dependent and star formation
Recent numerical simulations of galaxy formation and evolution with -regulated star formation (e.g., P06 and K12) assumed that dust abundances () of galaxies are linearly proportional to and the proportionality constant does not vary with time and location in galaxies. For convenience, the and SF models adopted in the present study and that in P06 and K12 are referred to as dependent and -dependent, respectively, for clarity. An important question here is how different the predicted properties of galaxies are between numerical simulations with Z-dependent (e.g., P06 & K12) and the present -dependent and star formation models.
We investigate this question by adopting the same star formation recipe (i.e., Z-dependent) used in KMT09 for our disk galaxy formation model with (the fiducial model). In estimating dust optical depth () for local regions in a galaxy, K12 used the cell’s column density in their adaptive mesh refinement simulation code. Since our code is not a mesh code, we estimate for each local region in a simulated galaxy by using the smoothing length of a SPH particle at the region. Since our main focus is not the Z-dependent model, we describe the results of only one Z-dependent model.
2.4 Star formation
We adopt the following two star formation (SF) recipes and compare between the results of models with the two recipes. One is the ‘H-dependent’ recipe in which star formation rate (SFR) around th gas particle depends simply on the total gas density (). This has been a standard recipe since Katz (1992) implemented this in galaxy formation simulations. The other is ‘-dependent’, in which the SFR depends on gas density rather than . This is more realistic and reasonable, given that star formation is ongoing within GMCs composed of gas (e.g., K12). We mainly investigate models with the -dependent SF recipe in the present study.
In the H-dependent SF recipe, a gas particle is converted into a new star if (i) the local dynamical time scale is shorter than the sound crossing time scale (mimicking the Jeans instability) , (ii) the local velocity field is identified as being consistent with gravitationally collapsing (i.e., div v), and (iii) the local density exceeds a threshold density for star formation (). Recent different models adopted different , for example, 0.1 cm-3 (RJ12), 1 cm-3 (RK12), 10 cm-3 (R08), and cm-3 (K12). We mainly investigate the models with cm-3, and briefly discuss how the present results depend on later. Owing to the adopted SF model with , gas densities can not become very high. For example, the maximum gas density and minimum dynamical time scale obtained for the fiducial model (described later) with a gas mass resolution of and cm-3 are cm-3 and yr, respectively. The maximum density can be as large as cm-3 in some models in which formation is severely suppressed.
Gas particles are converted into new stellar particles in the -dependent SF recipe described as follows. is estimated for each gas particle at each time step. A gas particle can be regarded as a ‘SF candidate’ gas particle if the above three SF conditions (i)-(iii) are satisfied. It could be possible to convert some fraction () of a SF candidate gas particle into a new star at each time step until the mass of the gas particle becomes very small. However, this SF conversion method can increase dramatically the total number of stellar particles, which becomes numerically very costly. We therefore adopt the following SF conversion method. A SF candidate gas particle is regarded as having a SF probability of . At each time step random numbers (; ) are generated and compared with . If , then the gas particle can be converted into a new stellar one.
Each th stellar particle is born with a fixed IMF and an initial mass . The stellar mass decreases with time owing to mass loss by SNe Ia, SNe II, and, AGB stars and the mass at time () can be significantly different from . The adopted IMF in number is defined as , where is the initial mass of each individual star and the slope corresponds to the Salpeter IMF. The normalization factor is a function of , (lower mass cut-off), and (upper mass cut-off):
| (26) |
where and are set to be and , respectively. We adopt for all models in the present study.
2.5 Gravitational dynamics, hydrodynamics, and feedback
Since the present code is a revised version of our GRAPE-SPH code (Bekki 2009; Bekki & Couch 2011), the calculation of gravitational interaction between particles is based on the direct summation of gravitational force of the particles (i.e., no usage of tree codes). The detail and performance (on GPU clusters) of the new code will be given in our future papers (Bekki 2013). The direct gravitational calculation is done by the GPU whereas other calculations related to gas dynamic, star formation, and chemical evolution are done by the CPU in the GPU clusters used by the present study.
One of key ingredients of the code is that the gravitational softening length () is chosen for each component in a galaxy (i.e., multiple gravitational softening lengths). Thus the gravitational softening length () is different between dark matter () and gas () and is determined by the initial mean separation of dark matter particles. Furthermore, when two different components interact gravitationally, the mean softening length for the two components is applied for the gravitational calculation. For example, is used for gravitational interaction between dark matter and gas particles. The total numbers for dark matter () and gas particles () is 900000 and 100000, respectively, in the fiducial model described later.
In the present study, is relatively large ( for a model with ), which might severely suppress the formation of substructures in baryonic components. However, we think that owing to (i) the adopted multi-softening lengths and (ii) initially virialized dark matter halo, such severe suppression of substructure formation, which could be regarded as a numerical artifact, is highly unlikely to occur. Indeed, clumpy structures of baryonic components can be formed in the present models, in particular, in distributions.
We consider that the ISM in galaxies can be modeled as an ideal gas with the ratio of specific heats () being 5/3. The basic methods to implement SPH in the present study are essentially the same as those proposed by Hernquist & Katz (1989). We adopt the predictor-corrector algorithm (that is accurate to second order in time and space) in order to integrate the equations describing the time evolution of a system. Each particle is allocated an individual time step width () that is determined by physical properties of the particle. The maximum time step width () is in simulation units, which means that yr in the present study. Although a gas particle is allowed to have a minimum time step width of in the adopted individual timestep scheme, no particle actually has such a short time step width owing to conversion from gas to star in high-density gas regions.
Each SN is assumed to eject the feedback energy () of erg and 90% and 10% of are used for the increase of thermal energy (‘thermal feedback’) and random motion (‘kinematic feedback’), respectively. The energy-ratio of thermal to kinematic feedback is consistent with previous numerical simulations by Thornton et al. (1998) who investigated the energy conversion processes of SNe in detail. The way to distribute of SNe among neighbor gas particles is the same as described in B12. The radiative cooling processes are properly included by using the cooling curve by Rosen & Bregman (1995) for K and the MAPPING III code for K (Sutherland & Dopita 1993).
| Parameters | () 777We mainly investigate the five representative models with , and for different . We also investigate a model with and to search for a lowest possible in low-mass disk galaxies. | 888 , and 0.06 are investigated. | (Gyr) 999 is fixed at 0.5 Gyr for all models. | SF recipe | (atom cm-3) | Dust yield 101010D98-type yield is used for most models. For uniform dust yield model, (dust mass fraction among metals from SNe and AGB stars) is set to be 0.1. |
| Range | H- or -dependent | D98-type or uniform |


2.6 Initial conditions of galaxy formation
Although we mainly investigate the evolution of forming disk galaxies embedded in massive dark mater halos, we also investigate physical properties of merger remnants that are morphologically similar to early E/S0 galaxies. This is because we discuss the observed differences in dust and properties between different Hubble morphological types.
2.6.1 Isolated disk galaxies
Disk galaxies form from slow accretion of halo gas embedded in virialized massive dark matter halos in the present study. The halo gas of a forming disk galaxy is initially in hydrostatic equilibrium determined by the mass distribution of the dark matter halo; the gas thereafter collapses and accretes onto the central region of the dark halo owing to radiative cooling processes. This disk formation model is essentially similar to those adopted by Kaufmann et al. (2007) for the detailed investigation of angular momentum transfer in disk galaxy formation and by RJ12 for dwarf galaxy formation.
The ratio of the dark matter halo mass () to gaseous halo mass () in a forming disk galaxy is fixed at 9 for most models. The initial total halo mass is denoted as (). We adopt the NFW profile for the density distribution of the dark matter halo suggested from CDM simulations:
| (27) |
where , , and are the spherical radius, the characteristic density of a dark halo, and the scale length of the halo, respectively. The -parameter (, where is the virial radius) is chosen for a given according to the predicted - relation in the CDM simulations (e.g., Neto et al. 2007).
The gaseous halo initially has the same spatial distribution as the dark matter and is assumed to be initially in hydrostatic equilibrium. The initial temperature of a halo gas particle is therefore determined by the gas density, total mass, and gravitational potential at the location of the particle via Euler’s equation for hydrostatic equilibrium (e.g., the equation 1E-8 in Binney & Tremaine 1987). Therefore gaseous temperature at radius from the center of a disk galaxy can be described as:
| (28) |
where , and are the proton mass, the gravitational constant, and the Boltzmann constant, respectively, and is the total mass within determined by the adopted mass distributions of dark matter and baryonic components in the forming disk galaxy.
The dark matter halo is dynamically supported by isotropic velocity dispersion and has no net angular momentum in the present study. The gas has a net angular momentum with the radial distribution of specific angular momentum () described as that is consistent with the prediction of CDM simulations (e.g., Bullock et al. 2001). The spin parameter () is a free parameter that controls the initial total amount of rotation and we mainly investigate in the present study. The angular rotation of a gas particle (with the rotating axis being the -axis) is determined by the adopted , , and the position of the particle.
2.7 The choice of dust parameters
Since no chemodynamical simulations have so far investigated variously different dust properties of galaxies, it is not so clear what a reasonable set of dust model parameters (i.e., and ) is for explaining the observed dust properties. We accordingly investigate many ‘low-resolution’ () models with different parameter values of and and thereby try to derive a reasonable set of the parameters that can explain observations. We then perform ‘high-resolution’ () simulations and investigate physical properties of gas, dust, and stars in galaxies by using the derived set of dust model parameters. The low-resolution simulations have and .
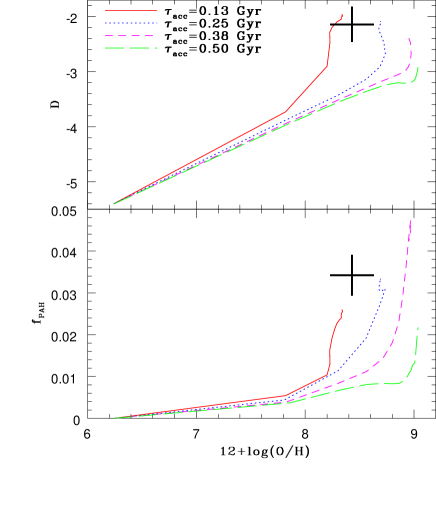
In determining reasonable and , we use the observed and of the LMC, because a growing number of observational data sets have been accumulated for the LMC (e.g., Meixner et al. 2010). We adopt the LMC-type models with , and variously different and and investigate the time evolution of and for 11.3 Gyr and compare the final and with the observations. Fig. 2 show the results for some of the models as well as the observed and with observational error bars. The observational data sets are from Meixner et al. (2010) and Leroy et al. (2011), and the error bars of 0.2 dex are shown for , as done in Leroy et al. (2011) for possible spatial variation of . In these models, Gyr and . The models with Gyr and 0.25 Gyr can better explain the observed location of the LMC on the plane than other ones. The model with Gyr, however, shows that is significantly lower than the observed value. The model with =0.25 Gyr shows that is consistent with the observed value.
Thus it is reasonable and realistic for the present study to adopt (,)=(0.25,0.5) Gyr in high-resolution simulations. It is confirmed that as long as (for Gyr), then the observed and can be reasonably well reproduced. Given that the above set of model parameters (,)=(0.25,0.5) Gyr) is consistent with those used for D98 that explains dust properties of the Galaxy self-consistently, we mainly investigate the models with (,)=(0.25,0.5) Gyr in the high-resolution simulations.
2.8 Parameter study
We mainly describe the results of the ‘fiducial’ model for which the model parameters are described in Table 3. This fiducial model has a total mass of that is similar to the mass of the LMC before its first passage of the Galaxy’s virial radius (i.e., before the loss of its initial mass; Bekki 2011 and 2012). We adopt this fiducial model, because recent observational studies have provided a rich amount of information on dust and properties of the LMC including 2D distributions of , , and across the LMC (e.g., Kawamura et al. 2009; Meixner et al. 2010), which can be compared with the fiducial model in detail. We also present the results of some representative models with different parameters and the range of model parameters investigated in the present study are shown in Table 4. For all models, the initial iron abundances ([Fe/H]) and dust-to-metal ratios for gas particles are set to be and 0.1, respectively. Owing to the adopted non-zero initial dust mass in gas, formation is possible from the very early stage of disk galaxy formation.
We investigate the time evolution of dust and properties for the last Gyr, which corresponds to the period of disk growth via gas accretion after virialization of the dark matter halos. The present simulations are therefore somewhat idealized in the sense that they can not describe the very early merging of sub-galactic clumps that formed stellar halos of disk galaxies. However, we consider that these simulations enable us to grasp some essential gradients of long-term dust and evolution in galaxies. We will adopt more realistic initial conditions of galaxy formation based on a CDM cosmology and thereby investigate physical properties of dust and in our forthcoming papers. In the following, in a simulation represents the time that has elapsed since the simulation started.
3 Results
3.1 The fiducial model
3.1.1 Time evolution of dust and
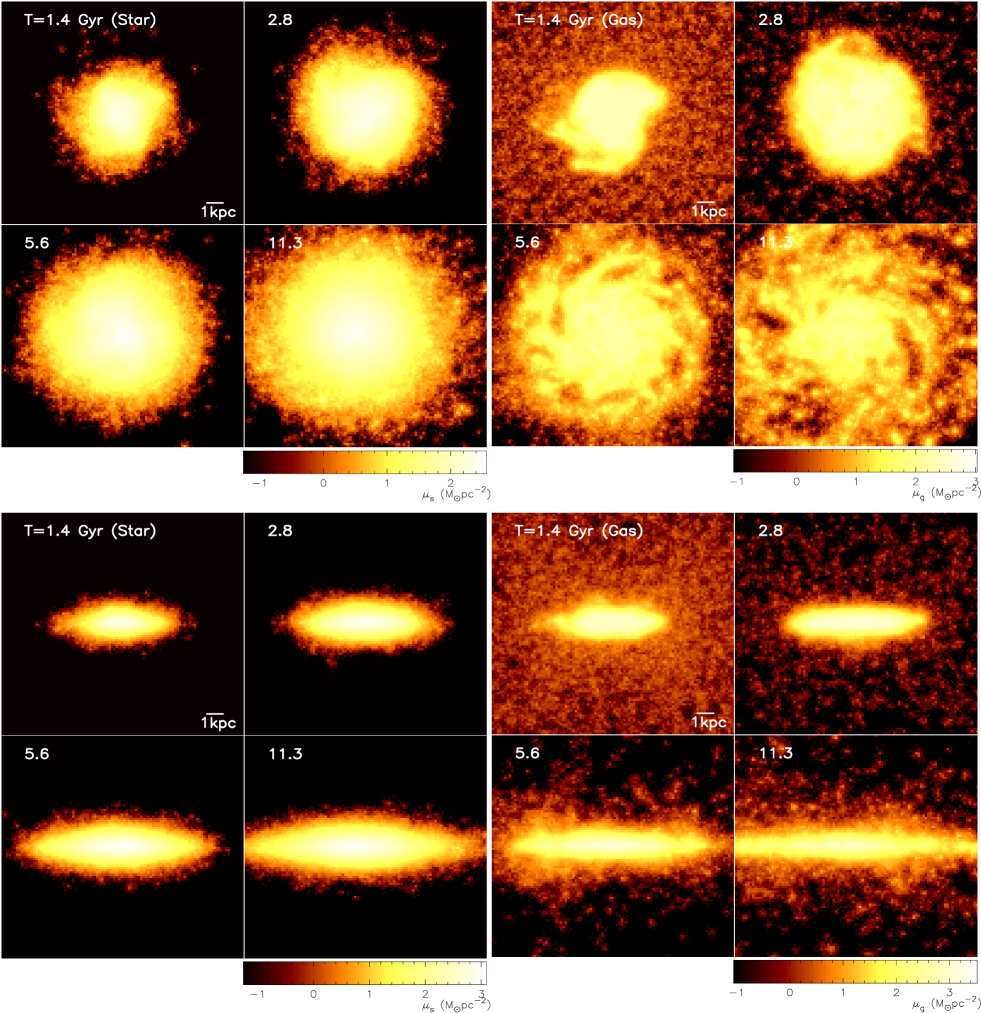
Figs. 3 and 4 show the time evolution of 2D distributions of gas, new stars, , and dust (, , , and , respectively) for the last 11.3 Gyr in the fiducial model. For clarity, the time evolution of surface mass densities (in a logarithmic scale) is shown for each component. As a gaseous disk forms through early rapid accretion of halo gas, new stars can form from the central high-density gaseous regions of the disk ( Gyr). Multiple explosions of SNe in the early burst phase can blow some fraction of the early gas disk so that numerous giant (kpc-sized) gaseous holes can be developed ( and 5.6 Gyr). As the disk grows by further gas accretion, star formation can occur in the outer part of the disk so that the disk size becomes larger ( and 11.3 Gyr). The giant holes can be still conspicuous in the outer part of the final disk owing to the presence of SN explosions ( Gyr). The final stellar disk has a disk-like structure with a higher density surrounded by a diffuse halo-like or thick disk-like stellar component. A strong stellar bar can not be formed during the Gyr evolution in this model.
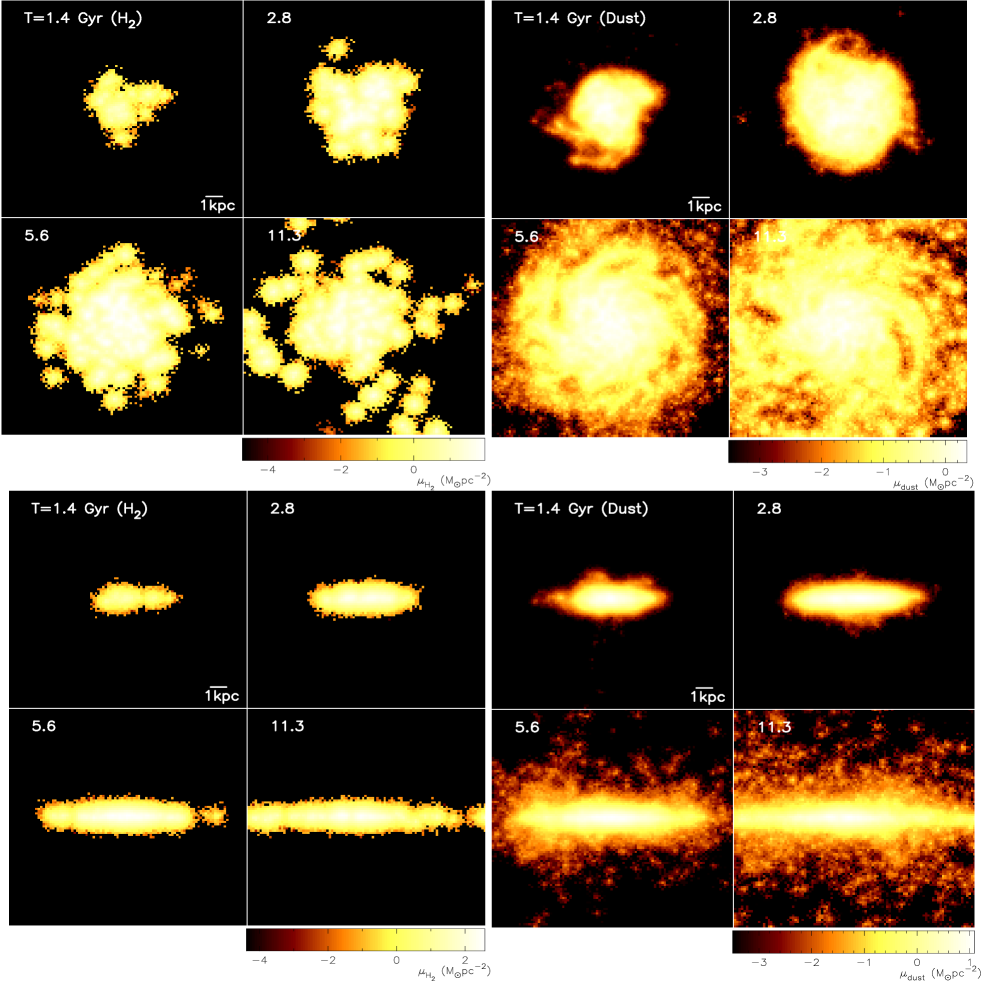
The formation of is possible from high-density gaseous regions of the central part of the disk in the early phase of the disk formation ( Gyr). The simulated gas shows clumpy structures, particularly, in later epochs (e.g., and 5.6 Gyr), and a more compact distribution in comparison with the total gas distribution. As stars form from gas across the forming disk, a larger amount of dust can be produced so that the formation efficiency of can increase. As a result of this, the distribution becomes more widespread and a larger amount of gas can be contained in the disk ( and 5.6 Gyr). Owing to the lack of a strong bar, the efficient gas-transfer to the central region of the disk through dynamical effects of the bar on gas does not occur. Consequently, a very strong concentration of gas can not be seen in this model, though is higher in inner regions of the disk. The simulated distribution of dust does not look so clumpy as that of gas throughout the disk formation and evolution. Clearly, the gas disk has significantly smaller surface dust densities in the outer regions.
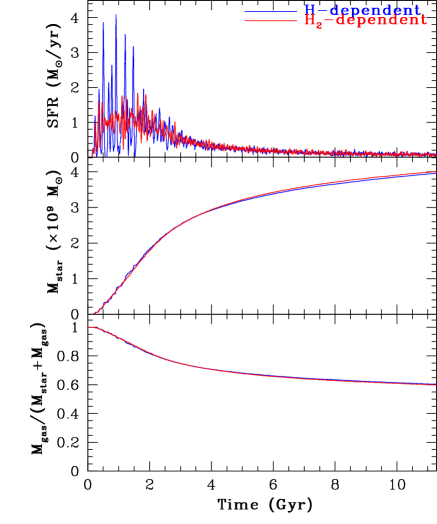
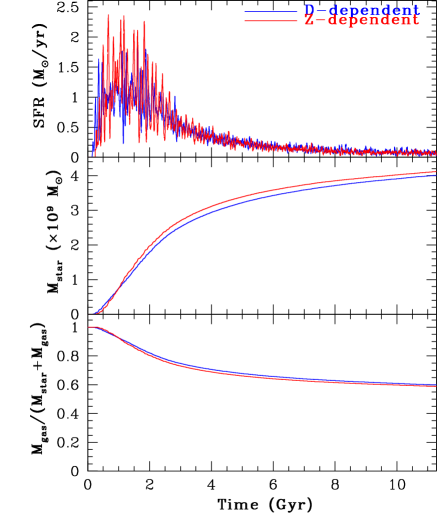
As shown in Fig. 5, SFR can rapidly increase during the first 1 Gyr evolution to reach as high as yr-1 in the disk. The SFR then decreases slowly to finally become less than yr-1. In this lower mass disk model, SN feedback effects play a vital role in suppressing star formation within the disk. Comparison between the fiducial model and the one with H-dependent SF recipe suggests that there is no remarkable difference in the long-term SF histories between the two models. However, there are some significant differences in SF histories between low-mass models () with H- and -dependent SF recipes, as described later in Appendix C. SFR can more violently change in the H-dependent SF model for the first few Gyr in comparison with the fiducial one. This violent change is due to the fact that stars can form in small high-density clumps in a bursty manner and then star formation can be truncated by strong supernova feedback effects. In the fiducial model with the -dependent SF, the SFRs in small high-density regions can not so steeply rise, because the densities are not so high (in spite of the high total gas densities). Slower consumption of gas in the clumps therefore ends up with the less violent change of the total SFR in the fiducial model. There are no major differences in the final total stellar mass () and gas mass fraction ()) between the models with H- and -dependent SF recipes.
Fig. 6 shows the time evolution of the disk galaxy on the and planes and the time evolution of the total dust () and masses () and mean and . Here the mean , , and values averaged among all gas particles are shown. of the disk evolves along a straight line () until and then very steeply increases to become . The origin of this steep rise in is explained as follows. In the late evolution phase of the disk (12+), the star formation rate can drop significantly owing to the lower gas density and thus the number of SN explosions becomes small. As a result of this, dust destruction by SNe can become much less efficient. On the other hand, the dust can still grow rapidly owing to accretion of gas-phase metals onto the pre-existing grains (i.e., at the expense of the metals). Accordingly the gas-phase abundance () can slightly decrease during this rapid increase. On the other hand, can very gradually increase until and then very steeply increases almost without changing .
Although can be rapidly produced during the first 0.5 Gyr evolution, the gas can be efficiently consumed by the first burst of star formation in the forming disk. can slowly increase after the early high SFR phase ( Gyr) and takes a peak value () around Gyr. After the peak, both and decrease slowly owing to gas consumption by star formation. The decrease for the last 5 Gyr is more clearly seen in in comparison with . Both and can slowly increase even after the peak formation phase of owing to dust mass growth via accretion of gas-phase metals in ISM.
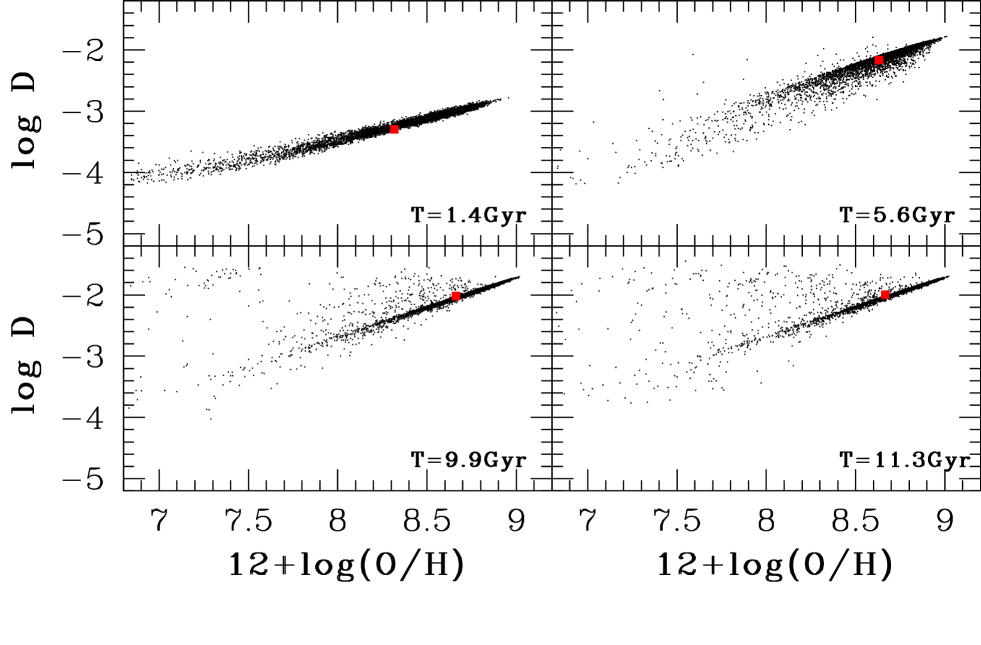
Fig.7 shows the distributions of gas particles on the plane at four different time steps (, 5.6, 9.9, and 11.3 Gyr). Only gas particles that are within the disk ( kpc) are plotted so that relations for the disk can be investigated. The particles initially form a narrow line, the slope of which is significantly shallower than the observed slope of the relation (; Gyr). As time passes by, the relation becomes steeper and gas particles become more widely spread on the plane ( Gyr). A larger number of metal-poor particles with can have higher (), because they are located where SN explosions are rare and therefore dust can more efficiently grow by accretion of gas-phase metals. The majority of stars can be finally located within a narrow line () on the plane at Gyr, though dispersions of for a given is large.
3.1.2 Radial gradients
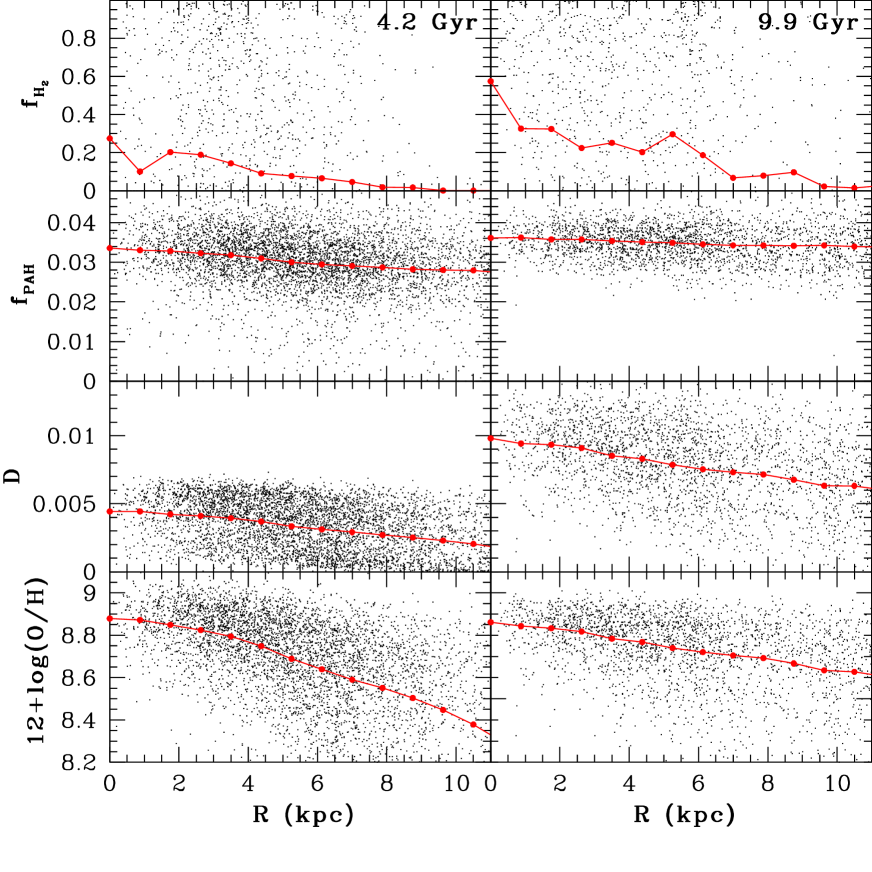
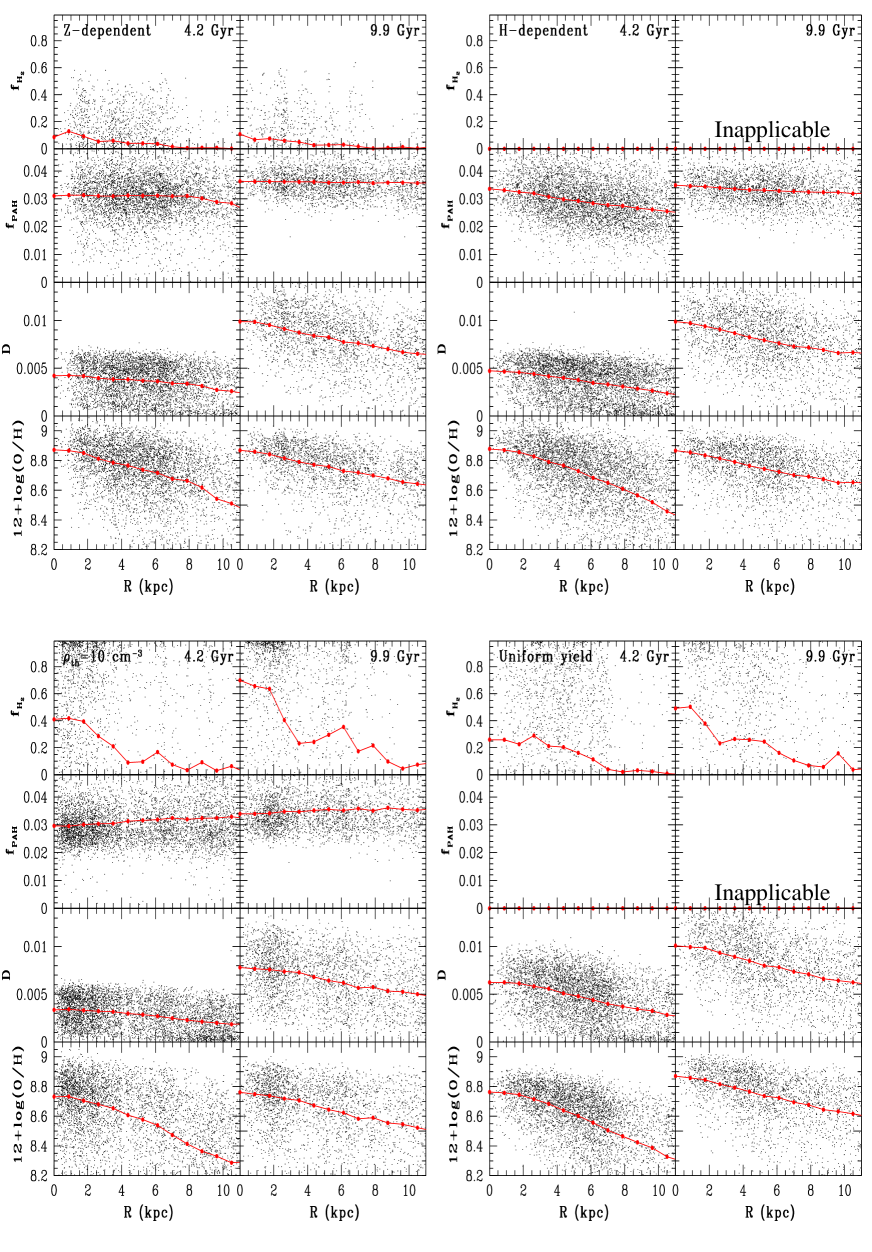
Fig. 8 shows that the radial gradients of , , , and evolve significantly with time. Dust abundances can more rapidly increase in the inner disk regions owing to their more rapid star formation and chemical evolution histories, which end up with more rapid increases of formation rates in the inner regions. Consequently, the radial gradient of becomes steeper between and 9.9 Gyr, and the gradients are always negative (i.e., higher in the inner regions). A weak negative radial gradient of ( kpc-1) can be seen at Gyr, and this gradient becomes even weaker ( kpc-1) at Gyr. The dispersion for a given appears to be larger at Gyr than at Gyr. The almost lack of gradient is discussed later in terms of the recent observational results of PAH dust in the LMC.
The disk galaxy shows a negative radial gradient at =4.2 and 9.9 Gyr ( kpc-1 and kpc-1, respectively) and the gradient becomes steeper at later epochs. A negative radial gradient (i.e., gas-phase metallicity gradient) can be clearly seen at the two epochs; the gradient becomes shallower at later epochs. Dispersions of four properties, , , , and are large for a given radius, which reflects the fact that chemical evolution and star formation histories can be quite different between different local regions. The derived characteristic negative radial gradients of , , and can be seen in other models, though the amplitudes of the gradients depend on model parameters.
3.1.3 Dust-gas-star correlations
Fig. 9 shows that there are clearly positive correlation of and with in the final disk ( Gyr), though the correlation appears to be weaker. The almost constant () reflects the mean of the disk and therefore the slope of the relation depends strongly on the dust abundances of simulated disk galaxies (and thus on their chemical and dust evolution histories). Leroy et al. (2011) investigated correlations of surface densities of dust () with those of total gas () and gas derived from CO for galaxies in the Local Group. They found that a stronger correlation can be more clearly in the LMC in comparison with correlation. These observational results are consistent at least qualitatively with the present results shown in Fig. 9.
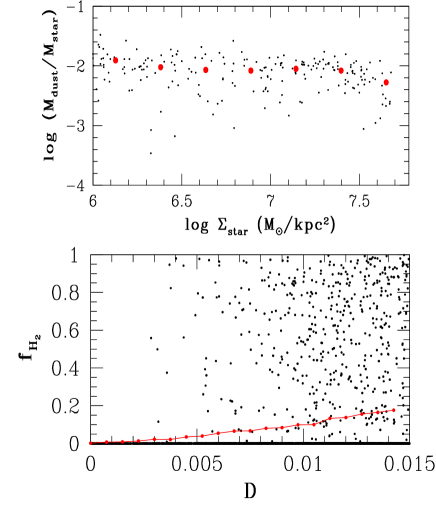
Fig. 10 shows that there is no/little correlation between (local stellar density) and (dust-to-star mass ratio) in local regions of the final disk: this could be regarded as a very weak correlation in the sense that local regions with higher have smaller . This very weak correlation for kpc-1 can be seen in other disk models. However, the remnants of gas-rich major mergers shows a slightly different relation for higher (Bekki 2013), which could be an important difference between late- and early-types galaxies.
Fig. 10 also shows that there is a positive correlation between and in local regions of the final disk, though dispersion in is large for a given . The derived larger for higher (or higher in more -rich ISM) is reasonable, given that a larger amount of can be produced owing to higher for higher in the present formation model. This result has an important implication on the evolution of radial gradients of galaxies in clusters of galaxies, which is discussed later.
3.2 Parameter dependences
Here we briefly summarize the governing dependences of dust and properties, and their correlations with other key model parameters (e.g., and ).
3.2.1 Dust parameters
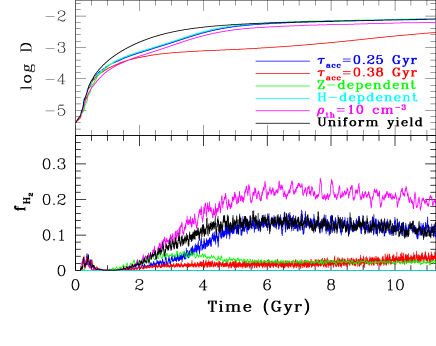
The time evolution and final values of and depend strongly on . As shown in Fig. 11, although the very early evolution of and ( Gyr) is not different between the two models with and 0.38 Gyr, the model with shorter (i.e., more rapid dust growth) shows more efficient production of dust and and thus has larger values of and . For these two models, a factor of difference in ends up with a factor of difference in and . This strong -dependence of and implies that the modeling of dust growth is very important for the formation and evolution of dust and : needs to be carefully chosen when in galaxies is investigated by using numerical simulations with dust. D98 suggested that ISM-phase averaged dust accretion timescale can be as long a yr, which is roughly consistent with the adopted reasonable value of .
Fig. 11 shows that there are no significant differences in the evolution of and between the fiducial models with D98-type and the model in which uniform dust yields are adopted (i.e., no PAH dust production), as long as is adopted as in previous one-zone models. Fig. 12 also shows that the final disks in the two models have very similar radial profiles of , , and (See Fig. 8 for comparison). These results imply that the evolution of and dust is not sensitive to the inclusion of of dependence to dust production rate and dust composition on stellar masses. A reasonable value of , however, should be carefully chosen in a simpler model with uniform dust yields.
3.2.2 SF recipes
The models with yet different SF recipes and SF threshold gas densities are investigated. The three principle results on the dependences of the time evolution and final values of and on SF recipes, which are shown in Figs. 11 and 12, are summarized as follows. First, there are no major differences in the evolution between the models with the D-dependent (i.e., fiducial model) and H-dependent SF recipes, which suggests that evolution is relatively insensitive to the modeling of global star formation in galaxies.
Second, although evolution is essentially the same between the models with the D-dependent (i.e., fiducial model) and Z-dependent SF recipes, the evolution is significantly different between the two in the sense that is significantly lower in the model with the Z-dependent SF recipe. The origin of the lower is discussed later in §4.1. Third, a factor of 10 difference in ( atom cm-3) can yield a factor of difference in in the present study. However, the evolution and the final value of do not depend so strongly on : is only slightly smaller in the model with higher owing to stronger suppression of star formation that produces dust.

3.2.3 Galaxy mass and spin parameter
Fig. 13 shows that is larger in more massive galaxies (i.e., larger ) for . This relation is not clearly seen in more luminous disk galaxies with : the relation is quite flat. The final depends weakly on such that is larger for larger . The derived relation may well be approximated as . Since more massive galaxies have higher chemical abundances in the present study, this result means that galaxies with higher can have higher . High-mass galaxies have higher metallicities so that can be higher. The time evolution of for high-mass () and low-mass () disk galaxies is given and briefly discussed in Appendix C.
The dust-to-star mass ratio () depends on such that it is smaller for larger . Also, the relation appears to be different below and above : depends more strongly on for . The final disks in the models with higher () show lower , , , and , mainly because larger disks with lower mass densities can be formed in the models. Negative radial gradients of dust and properties and dust- correlations clearly seen in the fiducial model can be also seen in the models with different and .
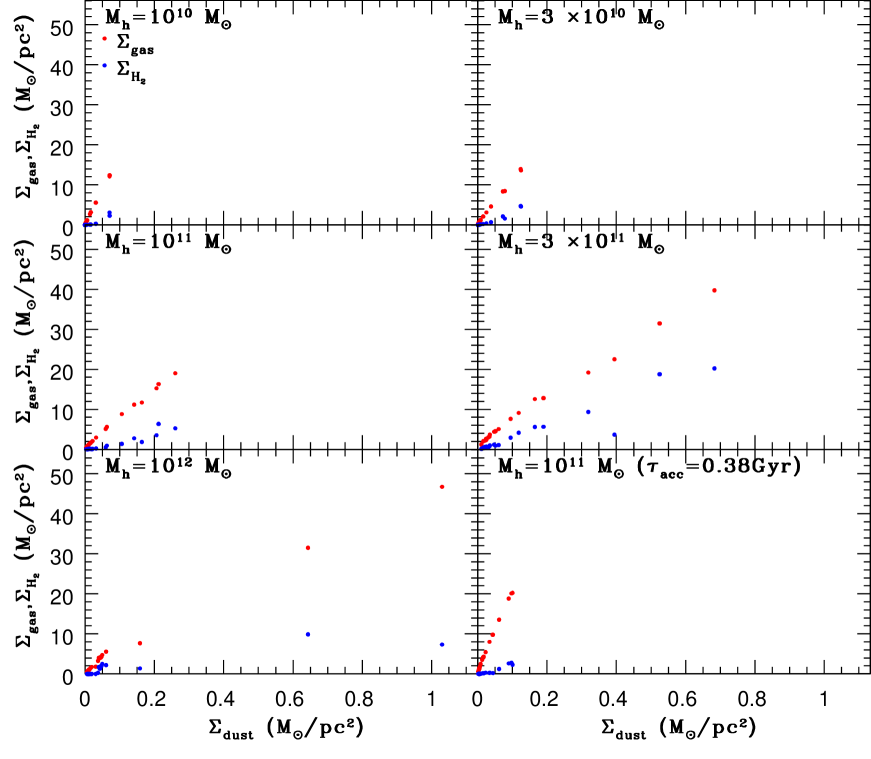
Fig. 14 shows that irrespective of galaxy halo masses (), final positively correlate with (i.e., ) in disk galaxies. The slopes of the correlations are steeper in galaxies with lower owing to their lower dust-to-gas ratios, and the maximum is larger for larger . Positive correlations between and can be seen, though they are significantly weaker in comparison with the relations. The derived stronger correlations in the relations are consistent with observations by Leroy et al. (2011). The comparative model with Gyr, in which dust growth is slower, shows a steeper slope in the relation and a smaller maximum value of . These results for the comparative model imply that dust accretion processes can be a key parameter that controls and relations in disk galaxies.
4 Discussion
4.1 Necessary to model dust evolution in predicting star formation histories ?
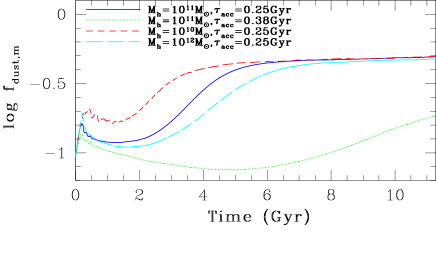
Previous chemical evolution models clearly showed that dust-to-metal ratios () of galaxies evolve with time especially in the early evolution phases of galaxies (e.g., Hirashita 1999; Inoue 2003; Calura et al. 2008). These previous models are one-zone, in which star formation models are rather idealized (e.g., non-inclusion of formation models) and dynamical evolution controlling star formation processes is not explicitly included. Therefore it is important for the present study to investigate how the mass fraction of metals that are locked up in dust () can evolve with time in the present chemodynamical model. Fig. 14, showing the evolution for four representative models with different and , confirms that can rapidly change in the early evolution of galaxies ( Gyr), though the means by which changes depends on the model parameters. This result strongly suggests that the total amount of dust in galaxies can not be linearly proportional to their metallicities () especially in early galaxy formation phases.
Recent numerical simulations of galaxy formation and evolution with -regulated star formation (e.g., P06 and K12) assumed that dust abundances () of galaxies are linearly proportional to and the proportionality constant does not vary with time and location in galaxies. The results shown in Fig. 14 suggests that this assumption is not realistic, especially, in the early formation phases of galaxies. An important question here is how different the predicted properties of galaxies are between numerical simulations with Z-dependent (e.g., P06 & K12) and the present D-dependent star formation models. Fig. 15 shows the time evolution of star formation rates and dust properties ( and ) in the two models with and - and dependent star formation recipes. Although the SFR can more violently change with time in the first Gyr evolution for the model with the Z-dependent SF recipe, the overall SFR is very similar between these two models. As a result of this, the time evolution of dust properties is very similar between the two models. This similarity in the time evolution of SFR, D, and can be seen in models with greater ().
These results imply that the Z-dependent SF recipe is reasonable and realistic enough to investigate the time evolution of SFRs (regulated by formation and evolution) in galaxies, given that additional new parameters such as and should be considered in the -dependent SF recipe. One might not have to adopt this recipe, unless one wishes to investigate dust properties such as radial gradients of and in detail. One of advantages of the present chemodynamical model is that we can discuss the observed gas-phase metallicities, dust properties, and dynamical properties of galaxies in a fully self-consistent manner. Thus we can make the most of the present chemodynamical model when we investigate correlations between physical properties of dust, gas, and stars in galaxies.
However, as shown in Fig. 11, the final is significantly lower in the Z-dependent SF model than in the D-dependent one. The derived low () is not consistent with fractions observed in less luminous disk galaxies like the LMC (e.g., ; van den Bergh 2000). Dust-to-metal ratios can increase during chemical evolution of galaxies so that production on dust grains can become more efficient. Since the Z-dependent model does not include this evolutionary effect, it can underpredict in the present SPH simulations. This does not mean that the Z-dependent model has a problem in predicting . The time evolution of depends on the adopted (i.e., optical depth) and the fixed initial dust-to-metal ratio in the Z-dependent SF model (KMT09). If different values of these two parameters are chosen in the Z-dependent model, the final might well become more similar to that derived in the D-dependent model and thus to the observed one. Accordingly, we do not regard the significant difference between the two models as a serious problem: depending on which model we adopt, we need to carefully chose the model parameters (e.g., and etc).
4.2 Origin of dust scaling relations
We here discuss the observed three key dust scaling relations: correlations between and (e.g., Galametz et al. 2011; Leroy et al. 2011), between and (e.g., Corbelli et al. 2012; Cortese et al. 2012), and between and (Corbelli et al. 2012).
4.2.1 relation
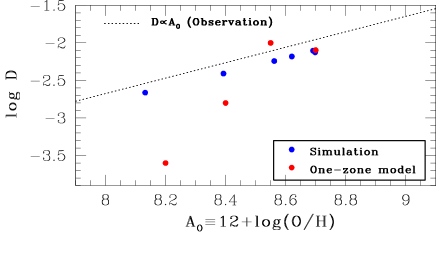
Recent observational studies have confirmed that galaxies with higher are more likely to show higher , which is approximated roughly as (e.g., Galametz et al. 2011; Leroy et al. 2011). Although the observed relation is not strong and the observational estimation of dust masses of galaxies has some uncertainties, it is important for the present study to confirm whether the relation can be well reproduced by the present new model with dust formation and evolution. Fig. 17 shows the locations of six simulated disk galaxies different () on the plane. For comparison, the location of the Galaxy in the one-zone model by D98 and those of dwarf galaxies at , 8.4, and 8.6 in the best one-zone model with the parameter being 30 by Lisenfeld & Ferrara (1998) are plotted in this figure.
Clearly, the simulated galaxies have a relation very similar to the observed relation, though the simulated is slightly smaller than the observed one for a given . Given the possible observational errors in the estimation of , this similarity suggests that the present new model can explain very well the observed relation. The present simulations predict systematically higher for a given for lower () in comparison with the one-zone models. The observed large dispersion in at lower for a given has not been well reproduced by the present models and thus needs to be investigated in our future studies.
In the present model, supernova feedback effects play a vital role in determining global star formation histories of galaxies and thus the total amount of gas that is converted into new stars in galaxies. Supernova feedback effects can less strongly suppress star formation in more massive galaxies owing to deeper gravitational potential wells. As a result of this chemical enrichment, dust production can proceed more efficiently in more massive galaxies. Therefore, more massive galaxies can finally have higher metallicities, , and mass-ratios of final stars to initial gas. The simulated relation due to this effectiveness of supernova feedback is strongly dependent on . Thus the present study is the first chemodynamical simulation that has successfully reproduced the observed relation.
4.2.2 relation
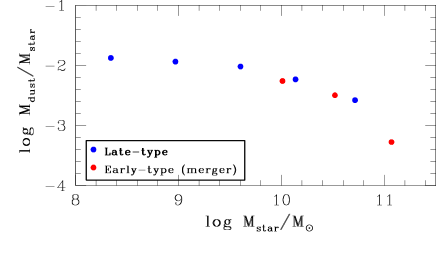
Recently Cortese et al. (2012) have found an interesting dust scaling relation that galaxies with larger are more likely to have higher . They have also found that is systematically lower in early-type E/S0 galaxies in comparison with late-type disk galaxies. Although these correlations of with and galactic morphologies show larger dispersions, they could have valuable physical meanings of galaxy formation and evolution. We have thus investigated the relation for a number of representative models with different parameters. In order to discuss the dust properties of early-type galaxies, we have taken the relation of early-type galaxies from our another work on E/S0 formation by gas-rich mergers (Bekki 2013). Fig. 18 shows that (i) is lower for larger and (ii) this relation appears to be steeper for ) larger than 9.6. These simulated trends are qualitatively similar to the observed ones (Cortese et al. 2012), which implies that the present model is quite good at grasping some essential ingredients of the formation process of this relation. However, the present disk formation models can not reproduce the observed galaxies with very low (), in particular, those with luminous galaxies with .
This failure of the disk formation models may reflect the limitation of the models in which violent merger events are not explicitly included. However, the major merger models, in which two late-type disk galaxies can be transformed into early-type E/S0 ones, can show significantly lower (Bekki 2013). Fig. 18 shows of the remnants of three luminous major merger models with prograde-prograde orbital configurations for . As shown in Fig. 18, the remnant with shows , which implies that early-type galaxies should have lower , if they are formed from major merging. It should be here noted that recent simulations of gas-rich major galaxy mergers by Hayward et al. (2011) suggested that the low of a galaxy is due simply to consumption of metal-enriched gas. A minor fraction of galaxies have extremely low (), which can not be reproduced by any model in the present study. These galaxies might have experienced some environmental effects (e.g., dust stripping by hot intra-cluster medium) or evaporation of dust by some hot radiation sources. The origin of these galaxies will be explored in our forthcoming papers.
4.2.3 relation
Corbelli et al. (2012) have recently investigated the total masses of dust, , and in late-type Virgo cluster galaxies and found and relations (where ) for the galaxies. The best-fit relation between and and between and are described as
| (29) |
and
| (30) |
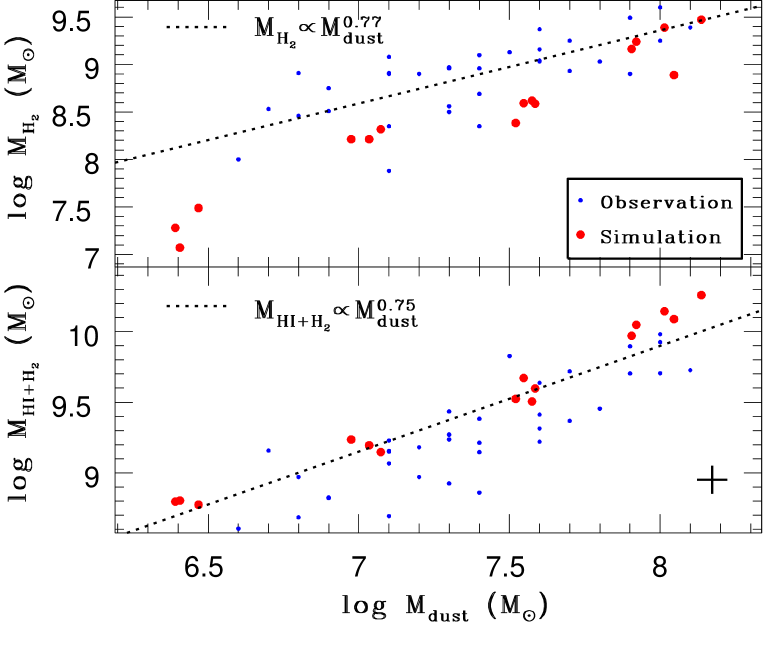
respectively. The metallicity-dependent CO-to- conversion factor is used for the total mass estimation of 35 galaxies in deriving the above relations. Fig. 19 shows these two observational relations as well as the results from the present models with different and for comparison.
Clearly, the simulated relation is quite similar to the observed relation, although the locations of the simulated massive disk galaxies ( or ) are slightly above the observed relation. The locations of the simulated less massive galaxies with on the plane are appreciably ( dex) below the observed relation. However, given the observed large error (0.9 dex) for the relation, the discrepancy between the simulation and the observation can not be serious. Instead, the present model appears to do a good job in reproducing the relation as well as . The present results also suggest that the relation can become steeper for . The slightly under-abundant for a given derived in the present study would need to be re-investigated in our future simulations with more realistic initial conditions of galaxy formation.
4.3 Radial gradients of and
Recent observational studies have revealed radial gradients of (UV attenuation), dust surface densities, and in galaxies (e.g., Boissier et al. 2004; Pappalardo et al. 2012; P12). Recent theoretical works have investigated the time evolution of radial gradients of and for different models of dust growth and destruction (e.g., Mattsson et al. 2012). The present study has clearly shown that luminous disk galaxies can have negative gradients (i.e., higher in inner regions), which is qualitatively consistent with the observational results by P12 for non-HI-deficient galaxies in the Virgo cluster of galaxies. The slightly steeper gradients of in comparison with in P12 appears to be also consistent with our model predictions.
One of interesting recent results on radial gradients (P12) is that the gradients appear to be different between galaxies with different HI-deficiency parameters (): The parameter is defined as the difference between the observed H i mass (in logarithmic units) and that expected for a galaxy of the same linear diameter and morphological type in a comparison sample of isolated objects (Roberts & Haynes 1994). Galaxies with (i.e., non-deficient) show negative gradients whereas those with (i.e., strongly HI-deficient) show slightly positive ones (Fig. 13 in P12). Given that no model in the present study shows such positive gradients, this observation needs to be discussed in the context of environmental effects on galaxies. If H i gas in the outer parts of galaxies can be more efficiently stripped by some environmental effects (e.g., ram pressure or tidal stripping) in comparison with dust, then might well can increase in the outer parts after this stripping process. On the other hand, if the inner parts remain intact during the stripping process, of the inner parts would not change. Therefore, this more efficient stripping of H i gas in the outer parts of galaxies could end up with positive radial gradients.
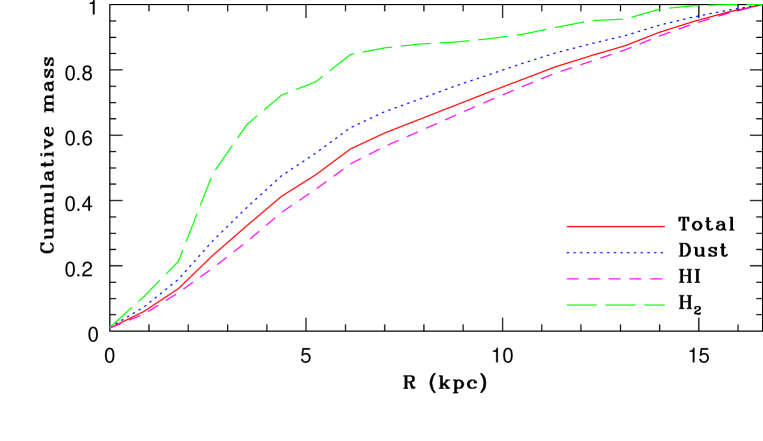
It appears to be theoretically unclear whether and why this more efficient stripping of H i gas could be possible. However, Fig. 10, which demonstrates a larger amount of dust in gas with higher mass fractions, suggests the following scenario for the more efficient H i stripping. A larger amount of dust in the outer parts of disks can be locked up in GMCs in comparison with H i gas (as shown in Fig. 10). Therefore, if gas stripping process is more efficient for H i gas, then could increase after gas stripping. Fig. 20 shows the cumulative mass distributions for H i, , dust, and total gas (i.e., H i+) in the fiducial model. The more compact distribution in Fig. 20 strongly suggests that H i can be more efficiently stripped by tidal or ram pressure stripping in the outer parts of disks. Therefore, the above scenario seems to be reasonable and realistic. Given that no previous studies have so far investigated the above scenario, it is our intention in future studies to confirm that the origin of the observed positive gradients is really related to more efficient H i stripping of disk galaxies in clusters of galaxies.
4.4 Origin of PAH dust properties
The present study has shown that the PAH-to-dust mass ratio () is higher for luminous (or massive) disk galaxies with higher metallicities (). This correlation is qualitatively consistent with recent observational results by Draine et al. (2007), which shows (which is equivalent to their ) is 1% for metal-poor galaxies with and 3.55% for metal-rich galaxies with . Interestingly, their results show a lack of galaxies with higher and . This is also consistent with the present PAH formation models which show a rapid rise of only after (i.e., very steep slope of the simulated relations for ; See Fig. 2). It should be noted, however, that the present models can not show very low () for the present galaxies with (i.e., the simulated galaxies show low only in their early evolution).
The present study has shown that the radial gradients of the present disk galaxies with total masses similar to that of the LMC can be only slightly negative ( kpc-1). This almost flat radial gradients appears to be inconsistent with the recent observation by Meixner et al. (2010), which has revealed a possible enhancement of in the central region of the LMC. The LMC could have experienced central starburst events owing to the LMC-SMC-Galaxy tidal interaction in the last several Gyr (e.g., Bekki & Chiba 2005), which might enhance the in the central regions and consequently enhance the radial gradient. The simulated disk galaxies of the present study do not experience tidal interaction with other galaxies and thus keep the almost flat gradients. Accordingly, the above apparent inconsistency could be due largely to differences in the evolution of PAH gradients between isolated and interacting galaxies (rather than some problems of PAH modeling). The present study thus implies that radial gradients of disk galaxies could have some fossil information about the past interaction histories with other galaxies.
4.5 Comparison with other models
The present chemodynamical model incorporated, for the first time, the evolution of different chemical components, dust formation and destruction, and formation on dust grains in a self-consistent manner. Previous simulations, however, included formation (but not dust) with different models. By assuming that dust abundances are proportional to metals () in galaxies, P06 incorporated formation on dust grains and destruction by ISRF in SPH hydrodynamical simulations of galaxies for the first time. RK08 adopted (i) a different model for formation and (ii) a more sophisticated ISRF model based on the photoionization code CLOUDY in their SPH simulations of galaxies, and discussed global star formation histories of galaxies. Cosmological simulations by Gnedin et al. (2009) and Christensen et al. (2012) adopted a model of formation that is essentially similar to that by P06.
Chemical evolution of variously different components (e.g., Mg and Fe) and dust evolution are not included in these previous models. The dust-to-gas ratios (), which are key parameters in formation on dust grains, are simply assumed to be proportional to gas-phase metallicities () in previous models ( constant). As both observational and theoretical studies showed that is not simply proportional to (i.e., there is large dispersion in for a given ; Galametz et al. 2011), the adopted assumption in previous models is neither reasonable nor realistic in a strict sense. However, as shown in the present study, the time evolution of SFRs and dust properties does not depend strongly on whether the evolution of dust is fully self-consistently included or not. Thus, the present study suggests that adopting a constant in numerical simulations can be a good approximation for investigating what really occurs in real galaxy evolution.
4.6 Future directions
Theis & Orlova (2004) incorporated dust-gas interaction in hydrodynamical simulations of gas-rich disk galaxies and thereby investigated how pressure-free cold dust components, which are assumed to be coupled to the gas by a drag force, can influence the gas dynamics of disk galaxies. They found that if the dust mass fraction exceeds 2% in disk galaxies, then the disk can become destabilized by the dust-gas coupling. Although their results suggest dust-gas coupling through a drag force could influence the gas dynamics of disk galaxies, such a possibly important effect is not included in the present study. Accordingly, it is our intention to incorporate the dust-gas coupling through a drag force in more sophisticated chemodynamical simulations.
The destruction processes of dust grains by sputtering in the reverse shock of a single SN remnant have been investigated by hydrodynamical models in detail (e.g., Silvia et al. 2010). In comparison with these models on the detailed physical processes of dust destruction by a single SN, the present model for dust destruction could be fairly crude, because only the dust destruction time scale is a key parameter for the dust destruction processes. More sophisticated parameterization for dust destruction processes will be necessary so that the time evolution of dust contents can be more precisely predicted in our future chemodynamical simulations.
5 Conclusions
We have investigated the time evolution of dust, gas, and star formation rates
in galaxies by using our new chemodynamical simulations with
a self-consistent model for the formation and evolution of dust and
molecular hydrogen ().
In this first of a series of papers,
we have focused particularly on spatial distributions of dust, gas-to-dust ratios
(), molecular hydrogen fraction (),
gas-phase abundances (12+log(O/H)), PAH-to-dust ratios (),
surface mass densities for dust (), total gas (),
and stars (),
and dust-to-stellar mass ratios ().
We have also investigated
correlations and scaling-relations between these properties and
the dependences of dust and
properties on the halo and stellar masses ( and ,
respectively) of galaxies.
The principle results are summarized as follows.
(1) Dust can play a vital role in regulating global star formation histories of galaxies, mainly because the time evolution of formation efficiencies depends strongly on dust evolution. Galactic star formation histories thus can depend on model parameters for dust formation and evolution, in particular, the accretion time scale of dust (). The observed () in luminous disk galaxies can be reproduced if Gyr, which is similar to that used in previous one-zone chemical evolution models with dust. The adopted dust-dependent star formation model is particularly important for low-mass disk galaxies with .
(2) Different local regions of a disk galaxy can have significantly different and owing to their different star formation and chemical evolution histories within the galaxy. The local regions, however, show a correlation () and the correlation evolves with time. The spatial distributions of dust show negative radial gradients of and (i.e., higher and in inner regions) in the simulated disk galaxies.
(3) rapidly increases owing to more efficient production of dust in the first several Gyr of disk galaxy formation. The distributions of show negative radial gradients (i.e., larger in inner regions) and the gradients evolve with time. Local regions with higher are more likely to show higher . The spatial distributions of gas in disk galaxies are more compact than those of dust, and the distributions of dust are more compact than those of H i gas.
(4) can strongly correlate with () in local regions of a disk galaxy. However, correlations are less clearly seen in comparison with . is also well correlated with and . very weakly correlates with in a galaxy such that is higher for lower . is higher in early-type E/S0s formed by merging in comparison with isolated late-type disks.
(5) If about 5% of dust formed from gaseous ejecta of C-rich AGB stars can become PAH dust, then the present models can reproduce the observed typical fraction () in luminous disk galaxies. The time evolution of is more rapid than that of , and does not change significantly in the last several Gyr. Weak radial gradients of can be seen in the simulated disk galaxies only for the first several Gyr evolution, which means that the present galaxies are highly likely to have flat or only slightly negative gradients.
(6) Time evolution of SFRs and is
investigated for the fiducial model with
dust-dependent and metallicity-dependent star formation recipes. It is found
that there are no major differences in the time evolution
of SFRs and between the models.
These results imply that the evolution of SFRs and dust properties
are not sensitive to whether a dust model is self-consistently included
or not for luminous
galaxies with .
It should be stressed, however, that the metallicity-dependent
star (and ) formation model
could possibly underestimate , because it does not include the increase
of dust-to-metal ratios ()
(thus the higher probability of conversion from H i to )
during chemical evolution.
Preliminary results on the dependences of dust and properties
on model parameters (e.g., and )
are summarized as follows.
(1) The present chemodynamical model can reproduce reasonably well the observed relation (), though the simulated for a given is slightly smaller than the observed one. Galaxies with larger () can have higher , , and owing to more efficient chemical enrichment (i.e, more efficient dust production) in more massive galaxies.
(2) The final (i.e., present) values of depend strongly on (and ) such that galaxies with larger (and larger ) have lower . Early-type galaxies transformed from late-type disks via galaxy merging can have lower in comparison with late-type disks. Thus, the present study suggests that morphological transformation of galaxies can cause significant evolution of .
(3) Disk galaxies with larger are more likely to have higher . The final can be very low in low-mass disk galaxies with for , because star formation is more severely suppressed in these low-mass disks (i.e., a smaller amount of dust is produced and used for formation).
(4) Disk galaxies with larger have larger () and the simulated relation is consistent reasonably well with the observed one (). The relation derived for the simulated disk galaxies is slightly steeper than the observed relation ().
6 Acknowledgment
I (Kenji Bekki; KB) am grateful to the referee for constructive and useful comments that improved this paper. Numerical simulations reported here were carried out on the three GPU clusters, Pleiades, Fornax, and gSTAR kindly made available by International Center for radio astronomy research (ICRAR) at The University of Western Australia, iVEC, and the Center for Astrophysics and Supercomputing in the Swinburne University, respectively. This research was supported by resources awarded under the Astronomy Australia Ltd’s ASTAC scheme on Swinburne with support from the Australian government. gSTAR is funded by Swinburne and the Australian Government’s Education Investment Fund. KB is grateful to Cameron Yozin-Smith for his reading this paper and giving useful comments to me. KB acknowledges the financial support of the Australian Research Council throughout the course of this work.
References
- (1) Bekki, K., 2009, MNRAS, 399, 2221
- (2) Bekki, K., 2011, MNRAS, 416, 2359
- (3) Bekki, K., 2013, in preparation
- (4) Bekki, K., Shioya, Y., 1999, ApJ, 513, 108
- (5) Bekki, K., & Chiba, M. 2005, MNRAS, 356, 680
- (6) Bekki, K., Couch, W. J., 2011, MNRAS, 415, 1783
- (7) Bekki, K., Tsujimoto, T., 2012, ApJ, in press
- (8) Bekki, K., Shigeyama, T., Tsujimoto, T., 2012, MNRAS, in press (B12)
- (9) Bigiel, F., Leroy, A., Walter, F., Brinks, E., de Blok, W. J. G., Madore, B., Thornley, M. D., 2008, ApJ, 136, 2846
- (10) Blitz, L., 1993, in Protostars and planets III, p125
- (11) Blitz, L., Rosolowsky, E., 2004, ApJ, 612, L29
- (12) Boissier, S., Boselli, A., Buat, V., Donas, J., Milliard, B., 2004, A&A, 424, 465
- (13) Bruzual, G., Charlot, S., 2003, MNRAS, 344, 1000
- (14) Bullock, J. S., Dekel, A., Kolatt, T. S., Kravtsov, A. V., Klypin, A. A., Porciani, C., Primack, J. R., 2001, ApJ, 555, 240
- (15) Calura, F., Pipino, A., Matteucci, F., 2008, A&A, 484, 107
- (16) Cazaux, S., Tielens, A. G. G. M., 2002, ApJ, 575, 29
- (17) Christensen, C., et al., 2012, MNRAS, 425, 3058
- (18) Corbelli, E., 2012, A&A, 542, 32
- (19) Cortese, L., Catinella, B., Boissier, S., Boselli, A., Heinis, S., 2011, MNRAS, 415, 1797
- (20) Cortese, L., et al. 2012, A&A, 540, 52
- (21) Draine, B. T., 2009, Physics of the interstellar and intergalactic medium
- (22) Draine, B. T., Bertoldi, F., 1996, ApJ, 468, 269
- (23) Draine, B. T., et al., 2007, ApJ, 663, 866
- (24) Dunne, L., et al. 2011, MNRAS, 417, 1510
- (25) Dwek, E., 1998, ApJ, 501, 643 (D98)
- (26) Edmunds, M., 2001, MNRAS, 328, 223
- (27) Elmegreen, B. G., 1993, ApJ, 411, 170
- (28) Ferrarotti, A. S., Gail, H.-P., 2006, A&A, 447, 553
- (29) Fu, J., Guo, Q., Kauffmann, G., Krumholz, M. R., 2010, MNRAS, 409, 515
- (30) Galametz, M., Madden, S. C., Galliano, F., Hony, S., Bendo, G. J., Sauvage, M., 2011, A&A, 532, 56
- (31) Gnedin, N. Y., Tassis, K., Kravtsov, A. V., 2009, ApJ, 697, 55
- (32) Gould, R. J., Salpeter, E. E., 1963, ApJ, 138, 393
- (33) Goldshmidt, O., Sternberg, A., 1995, ApJ, 439, 256
- (34) Hayward, C. C., Keres, Ds., Jonsson, P., Narayanan, D., Cox, T. J., Hernquist, L., 2011, ApJ, 743, 159
- (35) Hernquist, L., & Katz, N., 1989, 70, 419
- (36) Hirashita, H., 1999, ApJ, 522, 220
- (37) Hirashita, H., 2012, MNRAS, 422, 1263
- (38) Hirashita, H.; Ferrara, A., 2002, MNRAS, 337, 921
- (39) Hollenbach, D., Salpeter, E. E., 1971, ApJ, 163, 155
- (40) Hopkins, P. F., Quataert, E., Murray, N., 2011, MNRAS, 417, 950
- (41) Inoue, A. K., 2003, PASJ, 55, 901
- (42) Jura, M., 1975, ApJ, 197, 575
- (43) Kaneda, H. et al., 2011, PASJ, 63, 601
- (44) Katz, N., 1992, ApJ, 391, 502
- (45) Kawamura, A., 2009, ApJS, 184, 1
- (46) Kawata, D., 2001, ApJ, 558, 598
- (47) Kaufmann, T., ; Mayer, L., Wadsley, J., Stadel, J., Moore, B., 2007, MNRAS, 375, 53
- (48) Kennicutt, R. C., Jr., 1998, ApJ, 498, 541
- (49) Kozasa, T.; Hasegawa, H.; Nomoto, K.
- (50) Krumholz, M. R., McKee, C. F., Tumlinson, J., 2009, ApJ, 693, 216 (KMT09)
- (51) Kuhlen, M., Krumholz, M. R., Madau, P., Smith, B. D., Wise, J., 2012, ApJ, 749, 36 (K12)
- (52) Lagos, C. P., Lacey, C. G., Baugh, C. M., 2012, in prepring (arXiv1210.4974)
- (53) Leroy, A. K., Walter, F., Brinks, E., Bigiel, F., de Blok, W. J. G., Madore, B., Thornley, M. D., 2008, AJ, 136, 2782
- (54) Leroy, A. K., et. al., 2011, ApJ, 737, 12
- (55) Lisenfeld, U., Ferrara, A., 1998, ApJ, 498, 145
- (56) Mckee, C. F., 1989, in IAU Symp. 135, Interstellar Dust, Edited by Louis J. Allamandola and A. G. G. M. Tielens, p431
- (57) Mannucci, F., Della Valle, M., Panagia, N., 2006, MNRAS, 370, 773
- Maoz et al. (2010) Maoz, D., Sharon, K., Gal-Yam, A., 2010, ApJ, 722, 1879
- (59) Maoz, D., Mannucci, F., Li, W., Filippenko, A. V., Della Valle, M., Panagia, N., 2011, MNRAS, 412, 1508
- (60) Mattsson, L., Andersen, A. C., Munkhammar, J. D., 2012, MNRAS, 423, 26
- (61) Meixner, M., et al. 2010, A&A, 518, L71
- (62) Navarro, J. F., Frenk, C. S., White, S. D. M., 1996, ApJ, 462, 563
- (63) Neto A. F. et al., 2007, MNRAS, 381, 1450
- (64) Nozawa, T., Kozasa, T., Umeda, H., Maeda, K., Nomoto, K., 2003, ApJ, 598, 785
- (65) Pappalardo, C., et al., 2012, A&A, 545, 75 (P12)
- (66) Pelupessy, F. I., Papadopoulos, P. P., van der Werf, P., 2006, ApJ, 645, 1024 (P06)
- (67) Piovan, L., Chiosi, C., Merlin, E., Grassi, T., Tantalo, R., Buonomo, U., Cassara, L. P., 2011, in preprint (arXiv1107.4541)
- (68) Rahimi, A., Kawata, D., 2012, MNRAS, 422, 2609 (RK12)
- (69) Renzini, A. Buzzoni, A., 1986, in Spectral evolution of galaxies, (Dordrecht, D. Reidel Publishing Co.), p.195
- (70) Revaz, Y., Jablonka, P., 2012, A&A, 538, 822 (RJ12)
- (71) Roberts, M. S., Haynes, M. P. 1994, ARA&A, 32, 115
- (72) Robertson, B. E., Kravtsov, A. V., 2008, ApJ, 680, 1083 (R08)
- (73) Roman-Duval, J., et al. 2010, A&A, 518, L74
- (74) Rosen, A., Bregman, J. N., 1995, ApJ, 440, 634
- (75) Rosolowsky, E., Engargiola, G., Plambeck, R., & Blitz, L., 2003, ApJ, 599, 258
- (76) Sandstrom, K. M. et al., 2012, ApJ, 744, 20
- (77) Schmidt, M., 1959, ApJ, 129, 243
- (78) Silvia, D. W., Smith, B. D., Shull, J. M., 2010, ApJ, 710, 1575
- (79) Skibba, R., et al., 2012, ApJ, 761, 42
- (80) Smith, D. J. B., 2012, MNRAS, 427, 703
- (81) Spitzer, L. Jr., 1978, Physical Processes in the Interstellar Medium
- (82) Sugimoto, D., Chikada, Y., Makino, J., Ito, T., Ebisuzaki, T., Umemura, M., 1990, Nat, 345, 33
- (83) Sutherland, R. S., Dopita, M. A., 1993, ApJS, 88, 253
- (84) Takagi, T., et al. 2010, A&A, 514, 5
- (85) Theis, C., Burkert, A., Hensler, G., 1992, A&A, 265, 465
- (86) Theis, C., Orlova, N., 2004, A&A, 418, 959
- (87) Thornton, K., Gaudlitz, M., Janka, H.-Th., Steinmetz, M., 1998, ApJ, 500, 95
- (88) Tielens, A. G. G. M., 2008, ARA&A, 46, 289
- (89) Totani, T., Morokuma, T., Oda, T., Doi, M., Yasuda, N., 2008, PASJ, 60, 1327
- (90) Tsujimoto, T., Nomoto, K., Yoshii, Y., Hashimoto, M., Yanagida, S., Thielemann, F.-K., 1995, MNRAS, 277, 945 (T95)
- (91) Tsujimoto, T., Bland-Hawthorn, J., & Freeman, K. C. 2010, PASJ, 62, 447
- (92) van den Hoek, L. B.; Groenewegen, M. A. T., 1997, A&AS, 123, 305 (VG97)
- (93) van der Bergh, S., Th Galaxies in the Local Group
- (94) Yamasawa, D., Habe, A., Kozasa, T., Nozawa, T., Hirashita, H., Umeda, H., Nomoto, K., 2011, ApJ, 735, 44
- (95) Zhukovska, S., Gail, H.-P., Trieloff, M., 2008, A&A, 479, 453
- (96) Zubko, V., Dwek, E., Arendt, R. G., 2004, ApJS, 152, 211
Appendix A Numerical tests for subgrid physics
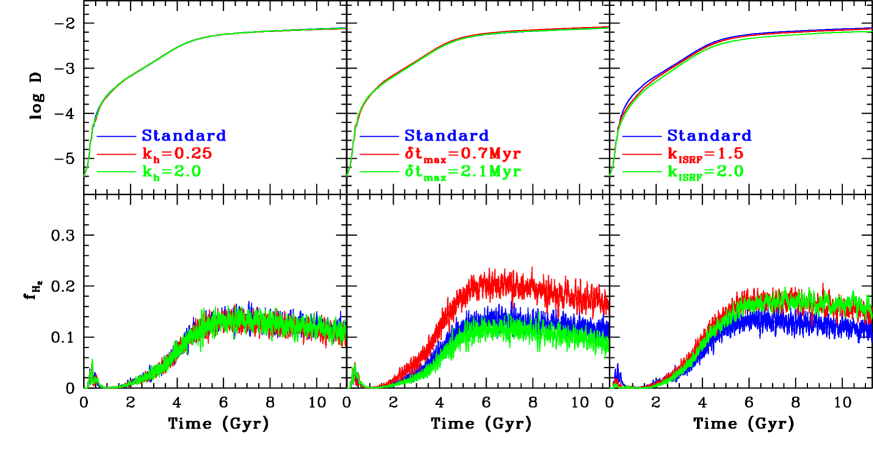
| model | 111111 The parameter is used for determining column densities of neutral and molecular hydrogen: for neutral hydrogen. | 121212 The parameter is used for determining the local volume () of the surrounding region of a gas particle. | 131313 The maximum time step width in units of yr. |
|---|---|---|---|
| fiducial | 1.0 | 1.0 | 1.4 |
| T1 | 0.5 | 1.0 | 1.4 |
| T2 | 2.0 | 1.0 | 1.4 |
| T3 | 1.0 | 1.0 | 0.7 |
| T4 | 1.0 | 1.0 | 2.1 |
| T5 | 1.0 | 1.5 | 1.4 |
| T6 | 1.0 | 2.0 | 1.4 |
In the present study, formation on dust grains and destruction by ISRF are estimated for each SPH particle at a given time step by using the smoothing length () and the gravitational softening length (). For example, we estimate the column density of H i gas (which is necessary to estimate formation) as follows:
| (31) |
where is set to be 1 in all models described in the main text. Accordingly we need to demonstrate that the present results do not depend on the resolution of simulations (i.e., ).
ISRF for a gas particle is estimated for the local volume that is defined as;
| (32) |
where is the gravitational softening length for the gas particle and is set to be 1 for all models described in the main text. Such local estimation of ISRF implies that stellar radiation from stars that are located outside (for ) is completely ignored. Although, the radiation density would not change significantly even if a larger volume is used, we need to demonstrate that the present results do not depend on . Hopkins et al. (2011) have discussed a similar resolution problem related to the estimation of the total amount of radiation from massive stars in their simulations. Also, the present results could possibly depend on the maximum time step width (), though timescales of key physical processes (e.g., ) are much longer than the adopted for models described in the main text.
We thus investigate the models in which model parameters are the same as those adopted in the fiducial model except , , and . The parameter values for these test models (T1T6 as well as the fiducial model) are summarized in Table A1. Key results on the time evolution of and , which are shown in Fig. A1, are summarized as follows. First, the time evolution and final values of and do not depend on for . This result means that the present results are insensitive to the method to estimate column densities of neutral and molecular hydrogen. Second, the final value in the model with Myr (a finer time step width) is 34% larger than that in the fiducial model, though there are no significant differences in between the two. The final in the model with Myr is 25% smaller than that in the fiducial model.
Gas densities can become higher in the model with smaller so that the probability of conversion from neutral to molecular hydrogen can become higher. As a result of this, can become larger. The derived dependences of on imply that can be better predicted by using models with smaller . However, a larger amount of calculation time is required for completing numerical simulations with smaller . Thus, if one has a limited amount of allocated time for performing numerical simulations (on GPU clusters or supercomputers), one would need to compromise on the accuracy of the predicted .
Fig. A1 also shows that the final and do not depend so strongly on : is slightly higher in the models with larger , probably because ISRF (i.e., radiation density) can be somewhat weaker for a larger volume (i.e., more efficient formation due to weaker ISRF). These results imply that the present results are not so sensitive to the adopted method to estimate ISRF (i.e., non-inclusion of the contribution of distant stellar particles to ISRF).
Appendix B SF histories of low-mass disks
Fig. B1 shows the time evolution of SFRs in the low-mass model with for the and dependent SF recipes. Although the fiducial model shows only slight differences in SFRs between the two different SF recipes, this model shows more remarkable differences in the early SF histories. The model with the dependent SF shows systematically higher SFR for Gyr in comparison with that with the dependent SF. This suppression of SF in early phase of the disk formation in the -dependent SF model is due largely to the lower fraction in the low-mass disk model. Such suppression can be seen in other low-mass models with the dependent SF recipe (). These results imply that the adoption of dependent SF recipe is important for SF histories of low-mass disk galaxies. Severe suppression of SF has been already reported by K12 in which -regulated SF models are adopted.
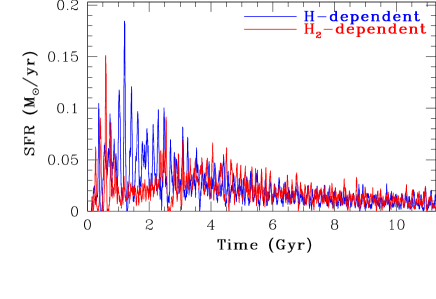
Appendix C Lower in galaxies with lower total masses
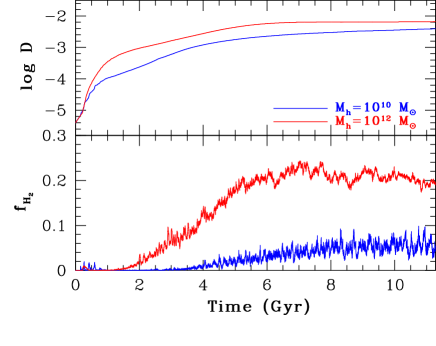
In the present model, formation efficiencies depend strongly on dust abundances (). Therefore, it is expected that more massive galaxies, where chemical enrichment proceeds more efficiently, can have larger and thus larger . Fig. C1 shows the time evolution of and in the low-mass disk model with and the high-mass one with . Clearly, both final and are higher in the high-mass model, and the evolution of is more rapid in the high-mass model. In the present formation model, the final in disks with can be very low (), which has important implications of gas contents in dwarf galaxies. We will discuss such implications in detail in our forthcoming papers.