Search for Pressure Induced Quantum Criticality in YbFe2Zn20
Abstract
Electrical transport measurements of the heavy fermion compound YbFe2Zn20 were carried out under pressures up to 8.23 GPa and down to temperatures of nearly 0.3 K. The pressure dependence of the low temperature Fermi-liquid state was assessed by fitting with = 2 for . Power law analysis of the low temperature resistivities indicates = 2 over a broad temperature range for GPa. However, at higher pressures, the quadratic temperature dependence is only seen at the very lowest temperatures, and instead shows a wider range of power law behavior in the low temperature resistivities. As pressure was increased, diminished from K at ambient pressure to K at 8.23 GPa. Over the same pressure range, the parameter increased dramatically with a functional form of with GPa being the critical pressure for a possible quantum critical point.
pacs:
62.50.-p,72.15.Eb,72.15.Qm,75.20.Hr,75.30.KzI Introduction
Strongly correlated electron systems manifest a rich variety of electronic and magnetic properties that have fascinated scientists for decades; Mott insulators,Mott (1990) exotic superconductors,Bennemann and Ketterson (2008); Norman (2011) and heavy fermionsStewart (1984, 2001, 2006) continue to be topics of intense study. Heavy fermions are a subset of materials known as Kondo lattices. In a Kondo lattice system, near the characteristic Kondo temperature, , the moment bearing ions in the lattice each act as a Kondo impurity, with which the conduction electrons hybridize and create a screening cloud of dynamically polarized electrons. At lower temperatures, the conduction electrons become coherent and manifest Fermi-liquid (FL) behavior. This leads to a myriad of novel features in measurements of the Kondo lattice’s thermodynamic and transport properties at and below : the susceptibility, which has a local moment-like, paramagnetic behavior at high temperatures, shows a loss of local moment behavior below ; in measurements of specific heat, a large Sommerfeld coefficient for points to a large effective electron mass; resistivity measurements for are Fermi-liquid-like and are consistent with a large electronic density of states at the Fermi energy.
The YbTM2Zn20 (TM = Fe, Co, Ru, Rh, Os, and Ir) compounds form a family of Yb-based heavy fermions where subtle changes in the hybridization of the Yb local moment with the conduction electrons can be achieved by changing the transition metal (TM) element. These materials show classical heavy fermion behavior in their physical properties.Torikachvili et al. (2007); Canfield et al. (2008); Jia et al. (2009); Jia (2008); Mun et al. (2012) Of this series, YbCo2Zn20 seems to be an outlier with much lower than those of the other five members ( = 33, 30, 16, 20, and 21 K for TM = Fe, Ru, Rh, Os, and Ir, respectively, and = 1.5 K for TM = Co).Torikachvili et al. (2007) Specific heat measurements yielded large Sommerfeld constants ( = 520, 580, 740, 580, 540 mJ/mol K2 for TM = Fe, Ru, Rh, Os, and Ir, respectively, and an exceptionally large value of 7200 mJ/mol K2 for YbCo2Zn20).Torikachvili et al. (2007) Magnetic susceptibility measurements show Curie-Weiss behavior at high temperatures and a broad maximum at low temperatures, signalling a Kondo screened local moment. When the magnetic component of the resistivity is isolated by subtracting from it the resistivity of the non-magnetic counterpart LuTM2Zn20, the resistivities of all members of the YbTM2Zn20 series show a local maximum near . Below , the coherent scattering of electrons decreases the resistivity until at very low temperatures, a wide temperature range of behavior signals the onset of Fermi-liquid behavior.Coleman (2007)
Although no indication of low temperature, local moment order was found for any of the YbTM2Zn20 compounds,Torikachvili et al. (2007); Canfield et al. (2008); Jia et al. (2009); Jia (2008); Mun et al. (2012) by combining the idea of the basic Doniach modelDoniach (1977) with simple steric arguments, it is anticipated that the application of pressure will stabilize local-moment-like states in Yb-based Kondo lattic systems. Indeed under pressure, indications of a magnetic instability were seen in YbCo2Zn20. When a modest pressure of GPa was applied, the resistivity measurement showed an anomaly, possibly magnetic in origin, at K.Saiga et al. (2008); Matsubayashi et al. (2010) Given the drastic difference in Kondo temperatures between YbCo2Zn20 and YbFe2Zn20 a significantly larger amount of pressure is expected to be needed to drive the YbFe2Zn20 system to a magnetically ordered state at low temperature. For YbCo2Zn20, at the critical pressure needed to induce an ordered state, the temperature of the local maximum of the magnetic component of the resistivity (), was at its minimum value. A similar minimum was also seen in pressure measurements on YbRh2Zn20 and YbIr2Zn20 at GPa,Matsubayashi et al. (2010, 2009) however, no features signalling magnetic ordering were seen down to 2 K for these compounds. This is not surprising considering the magnetic ordering temperature for YbCo2Zn20 was, at most, K at 2.37 GPa. If indeed both YbRh2Zn20 and YbIr2Zn20 with = 16 and 21 K, respectively, have critical pressures near 3 GPa, then it is expected that for YbFe2Zn20, which has a higher Kondo temperature of = 33 K,Torikachvili et al. (2007) the critical pressure for a pressure induced QCP will be GPa. On the other hand, YbFe2Zn20 may well manifest a higher magnetic ordering temperature than YbCo2Zn20. A comparison of the relative ordering temperatures of GdCo2Zn20 and GdFe2Zn20Jia et al. (2007, 2009) combined with de Gennes scaling suggests that if an RKKY interaction induces a magnetically ordered state for the Yb system, a magnetic transition temperature, as high as K may be found for YbFe2Zn20 under pressure. Moreover, other members of the family of RFe2Zn20, namely R = Gd-Tm manifest ferromagnetic ordering which suggests that the ordered state in YbFe2Zn20, if it can be stabilized, may be more complex than simple AFM order.
II Experimental methods
Starting with a high temperature melt of stoichiometry: Yb:Fe:Zn = 2:4:94, single crystals of YbFe2Zn20 were grown out of excess Zn. A detailed description of this process is described elsewhere.Torikachvili et al. (2007); Jia et al. (2007); Canfield et al. (2008); Jia et al. (2009); Canfield (2010)
For resistivity measurements, the single crystals were polished down to appropriate dimensions for the two types of pressure cells used: mm3 for the piston cylinder cell ( 2 GPa)Torikachvili et al. (2008, 2009) and typically for the modified Bridgman anvil cells (mBAC) (2.85 GPa).Colombier and Braithwaite (2007) The small sizes of the samples used in these pressure cells lead to relatively large geometric errors in the resistivity values. Therefore, all resistivity measurements were normalized to that of a single measurement on a large sample which was used in a previous study on the transport properties of Yb-based heavy fermions.Jia (2008); Jia et al. (2009) The normalization was done by multiplicatively matching the resistivity at ambient pressure and at 298 K, then applying the same multiplicative value to the rest of the resistivity measurements under pressure. Given that these materials have cubic unit cells,Torikachvili et al. (2007); Jia et al. (2007); Canfield et al. (2008); Jia (2008); Jia et al. (2009) this normalization procedure is considered to be quite reliable.
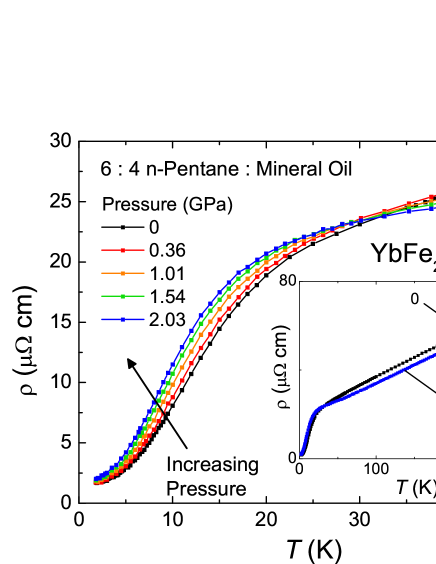
The piston cylinder cell was used for pressure measurements up to about 2 GPa.Torikachvili et al. (2008, 2009) This cell was designed to be used in a Quantum Design Physical Properties Measurement System (PPMS) with the dc resistivity option. The cell was fitted with a NiCrAl inner core and the pressure medium was a mixture of 6 : 4 n-pentane : mineral oil. At room temperature, the pressure inside the cell was monitored by using the resistance of a Manganin wire and at low temperatures, the superconducting transition temperature of a lead sample was used.Eiling and Schilling (1981)
A modified Bridgman anvil cell was used for resistivity measurements at pressures up to about 8.2 GPa. This cell has been designed to work inside a PPMS and has been modified to use a liquid pressure medium.Colombier and Braithwaite (2007) For this study, two pressure media were used with the mBAC: a mixture of 1 : 1 n-pentane : iso-pentane and a mixture of 1 : 1 Fluorinert 70 : Fluorinert 770 (1 : 1 FC70 : FC770).Piermarini et al. (1973); Klotz et al. (2009); Varga et al. (2003); Sidorov and Sadykov (2005) Despite the the lower pressure of solidification at room temperature of the latter liquid medium, its lower compressibility allowed higher pressures to be more readily achieved. As in the piston cylinder cell, the superconducting transition temperature of a lead sample was used as a pressure gauge within the mBAC sample space.
At ambient pressure, YbFe2Zn20 samples had residual resistivity ratios that varied from 18 to 38. The low-temperature resistivity follows with the value of having an average of cm K2 and the crossover temperature, , below which this form fits the data, has an average value of K. With two different pressure cells and three different liquid media, there are clear, albeit small, differences between the various pressure dependent data sets, that may (in part) be attributed to cell to cell and/or sample to sample differences but these are small compared to the much larger changes due to pressure (see Fig. 8 below and associated discussion).
For low temperature measurements, down to nearly 0.3 K, a CRYO Industries of America 3He system was used to measure samples under pressure with the mBAC.
For most pressure cells, one cycle of cooling and warming causes a pressure cell to thermally contract and expand. One subtlety of pressure measurements with the mBAC is that this thermal cycling can induce a modest pressure increase within the pressure cell. This is the origin of the slight pressure differences between subsequent measurements with the PPMS (used for measurements down to 2 K) and the 3He system (used for measurements down to nearly 0.3 K). An example of this effect is seen below in Fig. 3.
III Results
Temperature dependent resistivity measurements of YbFe2Zn20, at ambient pressure and under pressures up to 2.03 GPa, are shown in Fig. 1. These measurements were taken using a piston cylinder cell. As temperature is decreased from 300 K (inset of Fig. 1) the resistivity decreases in a near-linear manner until, near 30 K, a broad shoulder-like drop appears. Below this shoulder, the resistivity decreases rapidly with temperature and at the lowest temperatures manifests behavior. As the applied pressure is increased, the shoulder shifts to lower temperatures and the resistivity data for temperatures just above the shoulder flattens.
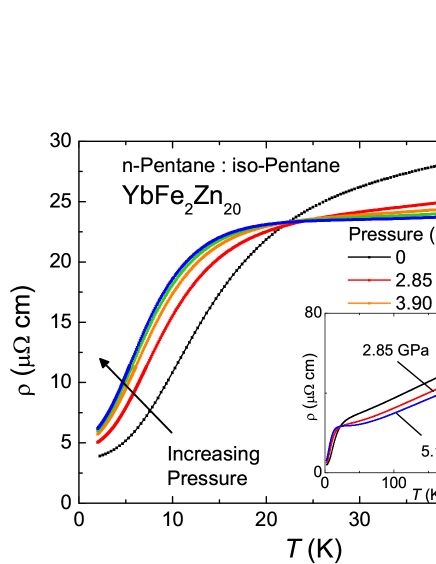
For measurements at higher pressures, the mBAC was used with both the 1 : 1 n-pentane : iso-pentane mixture and the 1 : 1 FC70 : FC770 mixture. Figure 2 shows resistivity measurements with an mBAC for pressures up to 5.14 GPa using 1 : 1 n-pentane : iso-pentane as the liquid pressure medium. As pressure is applied, a local maximum in the resistivity above the shoulder grows as the shoulder itself shifts to lower temperatures.
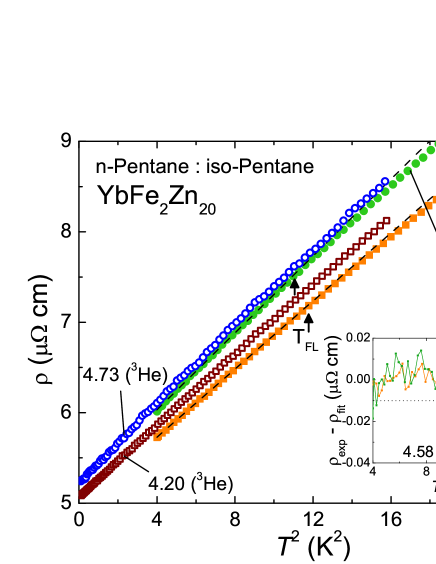
The behavior that persisted up to about 11 K at ambient pressure is diminished to a lower temperature range and the upward curvature becomes steeper as pressure is increased. Measurements with the PPMS down to 2 K show quadratic behavior up to K at 4.58 GPa (Fig. 3). was defined as the temperature at which the difference between experimental resistivity data, , and linear fits to the versus data, , became greater than 0.01 cm. For pressures where behavior was still observable above 2 K, was determined from measurements with the PPMS. For lower than 2 K, 3He data were used for the quadratic fits.
In order to explore the possibility of magnetic ordering at lower temperatures, measurements of resistivity down to nearly 0.3 K for 4.20 and 4.73 GPa were taken using a 3He cryostat, shown in Fig. 3. These measurements revealed no resistive anomalies down to almost 0.3 K and confirmed that behavior persists down to our lowest temperatures.
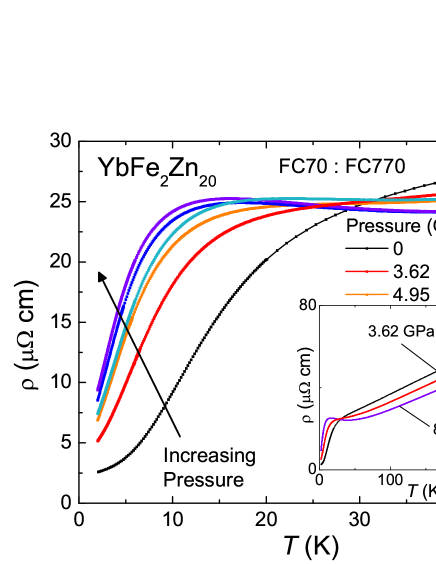
In order to achieve higher pressures, the 1 : 1 FC70 : FC770 liquid medium was used with the mBAC. Figure 4 shows selected resistivity curves for pressures up to 8.23 GPa from two different packings of the pressure cell (each using one half of the same crystal as a sample). The resistivity in the high temperature region, between 30 and 300 K, continues to decrease with temperature (inset of Fig. 4) in a near-linear fashion. The broad shoulder once again changes into a broad maximum with pressure and further increases up to 8.23 GPa reveal this maximum sharpening.
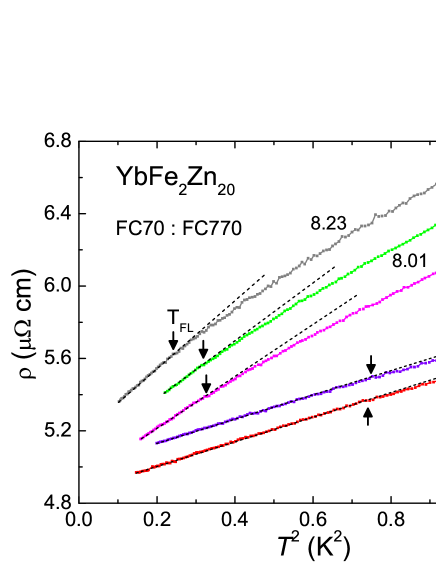
Measurements down to nearly 0.3 K were also conducted with 1 : 1 FC70 : FC770 as the liquid medium in the mBAC (Fig. 5). No features associated with magnetic ordering were seen in the data for pressures up to 8.23 GPa. Above 5 GPa, the range of behavior is suppressed to below 2 K. This decrease in continues with pressure and, at 8.23 GPa, the behavior is found only up to K ( K2).
IV Discussion
The application of pressure to Yb-based heavy fermion systems can shift the system from being dominated by the Kondo effect and manifesting low-temperature FL behavior, to being more local-moment like and even, in some cases, to manifesting long-range order.Alami-Yadri et al. (1998); Knebel et al. (2001); Trovarelli et al. (2002); Winkelmann et al. (1998) In resistivity measurements of a Kondo lattice system, the logarithmic rise of resistivity due to the Kondo effect is countered by the coherent scattering of the electrons at lower temperatures, creating a local maximum in the resistivity. Since the Kondo temperature, , sets an energy scale for a crossover from a local moment to a Kondo-screened moment state and is not correlated with any sharp features in physical measurements, it becomes necessary to isolate the magnetic contribution from the resistivity data in order to help determine, or set limits on, . It is expected that the position of this local maximum scales with .Yoshimori and Kasai (1983); Coleman (1987); Bauer et al. (1993)
The total resistivity of YbFe2Zn20 can be described as a combination of non-correlated, normal metal resistivity and a magnetic contribution to the resistivity. The normal metal resistivity, can be approximated by the temperature-dependent resistivity of LuFe2Zn20, which, with a full 4 shell, is a non-magnetic analogue to YbFe2Zn20. Both Yb and Lu curves are shown in the inset of Fig. 6. By taking the difference, , the partially filled 4 shell contribution to the resistivity can be effectively isolated. This is shown for several measurements under pressure in Fig. 6. For the subtraction, only the ambient pressure resistivity values of LuFe2Zn20 were used and is the likely cause of the negative values at higher temperatures.
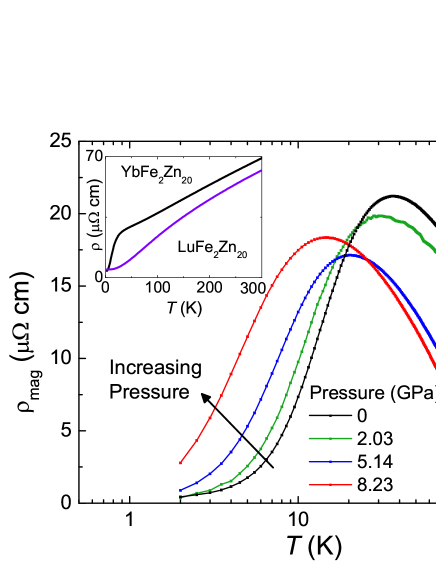
It is apparent that the low temperature maximum in the magnetic component of the resistivity decreases with pressure. For Kondo lattice systems, the electrons participating in the spin-dependent screening in the region of the Kondo temperature are intimately related to the Fermi-liquid quasiparticles at low temperatures. With previous results for YbCo2Zn20 having shown indications of a magnetic transition when was suppressed,Saiga et al. (2008); Matsubayashi et al. (2010) it is expected that a quantum critical point will also be reached when in YbFe2Zn20 has been driven to zero.
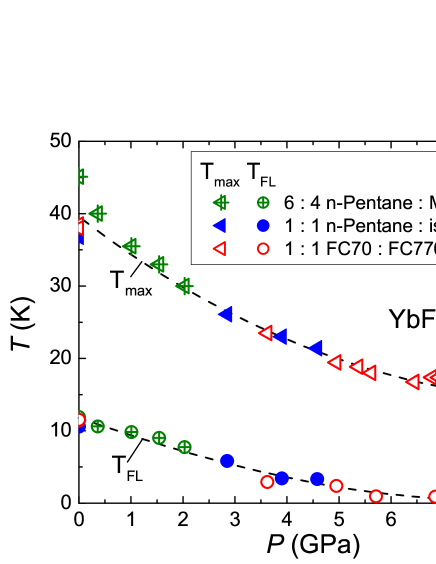
The suppressions of and with pressure for YbFe2Zn20 are shown in Fig. 7. If the minimum of is indeed an indicator that the system will manifest magnetic ordering,Matsubayashi et al. (2010) then for YbFe2Zn20, the critical pressure may well be at a slightly higher pressure than the maximum achieved in this study. Furthermore, the Fermi-liquid state is almost completely suppressed by 8.23 GPa, another indicator that the system should be near its critical pressure value.
The influence of pressure on the Fermi-liquid behavior of YbFe2Zn20 is shown more clearly in Fig. 8. In Fig. 8(a), the spread of values seen at ambient pressure is small compared to the overall change in over the 8 GPa pressure range. Although has not been driven to zero by our maximum pressure, extrapolation of () suggests that this will occur at higher pressures in the range of 9-10 GPa. The plot of the coefficient, , as a function of pressure (Fig. 8(b)) shows divergent behavior with pressure, consistent with the diminishing and closeness to a quantum critical point.
The divergence of is very clearly quantified in Fig. 8(c) where the progression of with pressure is shown. A linear fit to the data, denoted by the black dashed line, shows that will go to zero (indicating an infinitely large value) at GPa. These data indicates that with GPa. It should be noted that data for (not shown) does gradually increase from to 8.23 GPa, effectively doubling in value from ambient to highest pressure.
At our highest pressures, increases rapidly indicating a proximity to a quantum critical point near GPa. As pressure increases from atmospheric pressure to GPa, we anticipate that the low temperature electronic specific heat, , increases. By using the Kadowaki-Woods plot in Fig. 4 of Ref. Torikachvili et al., 2007, we can predict an increase in from 520 mJ/mol K2 to mJ/mol K2 or greater at 8.23 GPa depending on whether all crystalline electric field split levels are comparable or lower than .
For GPa, long-range magnetic ordering is expected. Such behavior was speculated to be seen with YbCo2Zn20, where at GPa, a small anomaly in the resistivity appeared near 0.15 K.Saiga et al. (2008) The large difference in the pressure needed to drive these systems to a quantum critical point is attributed to their large difference in ambient pressure Kondo temperatures ( = 1.5 K for YbCo2Zn20 and = 33 K for YbFe2Zn20).Torikachvili et al. (2007); Matsubayashi et al. (2009) This is also reflected in the value of for YbRh2Zn20 and YbIr2Zn20 which is suggested to be 3 GPa, where = 16 and 21 K, respectively.Torikachvili et al. (2007); Matsubayashi et al. (2009) To estimate the hypothetical magnetic ordering temperature for trivalent Yb in YbFe2Zn20 and YbCo2Zn20, the ordering temperature for the Gd counterparts, GdFe2Zn20 and GdCo2Zn20, can be scaled by the de Gennes factor. The de Gennes factor correlates the magnetic ordering temperature with the strength of the interaction between the local rare earth moment and the polarized conduction electrons.Jia et al. (2007, 2009) Using this method, YbFe2Zn20 and YbCo2Zn20 would be expected to order at 1.75 and 0.12 K, respectively. For YbCo2Zn20, this is relatively close to the value of 0.15 K measured under pressure,Saiga et al. (2008) suggesting that magnetic ordering in YbFe2Zn20 might be found as high as K for GPa.
Furthermore, RFe2Zn20 compounds, for R = Gd-Tm, manifest ferromagnetic ordering with the Curie temperature, , for Gd as high as 86 K.Jia et al. (2007, 2009) The enhanced ’s of these compounds are thought to be associated with the near Stoner nature of YFe2Zn20 and LuFe2Zn20.Jia et al. (2007); Jia (2008); Jia et al. (2009) This then raises the possibility that the magnetic ordering that evolves with pressure from the Fermi-liquid state of YbFe2Zn20 might be more complex than simple antiferromagnetic order.
To further investigate the possibility that a QCP is being approached, an analysis of the progression of the power law behavior at low temperatures and high pressures was done. Figure 9 shows the results for pressures where measurements down to K were taken. Data from base temperature to 3 K are results from measurements in the 3He cryostat and above 3 K, results from measurements in the PPMS. In this analysis, the lowest temperature from a fit was used for both sets of measurements.
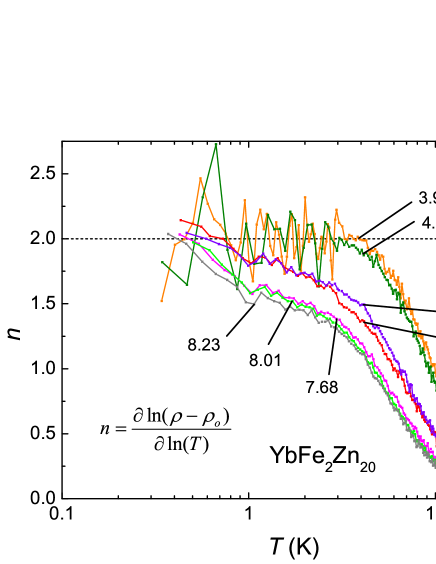
As expected, low pressure measurements show at base temperatures across a decade of temperature. The large noise in the low temperature data for 3.90 and 4.58 GPa is restricted to one particular packing of the pressure cell (with higher noise) as the higher pressure values (from different pressure cell packings) do not suffer from such large noise. For pressures above 4.58 GPa, for a short range at low temperatures then gradually decreases as temperature increases. For the highest pressures where GPa, for only the lowest temperatures and instead shows close to 1.5 for a significant temperature range. Since at our highest pressure, 8.23 GPa, is still below the expected GPa, it is still possible that by 9.8 GPa, the system will manifest an power law behavior over a wider temperature range. If AFM order does arise at the critical pressure, this would be consistent with the results for spin fluctuation theories by Hertz and Millis as well as MoriyaHertz (1976); Millis (1993); Moriya and Takimoto (1995) where an = 1.5 power law is predicted for a 3D AFM system. On the other hand, if ferromagnetic ordering occurs, or 1.67 is predicted by MoriyaMoriya and Takimoto (1995) for 2D or 3D systems, respectively.
Another possibility is that instead of a QCP, we may be approaching a quantum critical region where neither Fermi-liquid behavior nor magnetic ordering exists and instead another exotic ground state may stabilize which is then followed by, at higher pressure, a magnetically ordered state.Bud’ko et al. (2004, 2005a, 2005b); Custers et al. (2010); Schmiedeshoff et al. (2011); Mun et al. (2013) It is evident that higher pressure measurements are necessary to further explore these possibilities.
V Conclusion
The resistivity of YbFe2Zn20 was measured under pressure up to 8.23 GPa and down to temperatures of almost 0.3 K. Increasing pressure drives the characteristic Kondo temperature, , to lower temperatures and diminishes the range of Fermi-liquid behavior. The dramatic enhancement of as pressure increases to 8.23 GPa suggests a close proximity of YbFe2Zn20, at our highest pressure, to a quantum critical point where the system may develop a new magnetic ground state. Although not reached in this study, the critical pressure for YbFe2Zn20 can be inferred from to be GPa.
Acknowledgements.
The authors would like to thank S. Jia and E. Mun for growing the YbFe2Zn20 samples used in this study and H. Hodovanets, V. Taufour, for technical assistance and fruitful discussions. This work was carried out at Ames Laboratory, US DOE, under Contract # DE-AC02-07CH11358 (S.K.K., S.L.B. and P.C.C.). Part of this work was performed at the Iowa State University and supported by the AFOSR-MURI Grant # FA9550-09-1-0603 and also by the National Science Foundation under Grant # DMR-0805335 (M.S.T.). S.L.B. acknowledges partial support from the State of Iowa through Iowa State University.References
- Mott (1990) N. Mott, Metal-Insulator Transitions: Second Edition (Taylor & Francis, 1990).
- Bennemann and Ketterson (2008) K. Bennemann and J. Ketterson, Superconductivity: Novel superconductors (Springer-Verlag Berlin Heidelberg, 2008).
- Norman (2011) M. R. Norman, Science 332, 196 (2011).
- Stewart (1984) G. R. Stewart, Rev. Mod. Phys. 56, 755 (1984).
- Stewart (2001) G. R. Stewart, Rev. Mod. Phys. 73, 797 (2001).
- Stewart (2006) G. R. Stewart, Rev. Mod. Phys. 78, 743 (2006).
- Torikachvili et al. (2007) M. S. Torikachvili, S. Jia, E. D. Mun, S. T. Hannahs, R. C. Black, W. K. Neils, D. Martien, S. L. Bud’ko, and P. C. Canfield, Proc. Natl. Acad. Sci. 104, 9960 (2007).
- Canfield et al. (2008) P. Canfield, S. Jia, E. Mun, S. Bud’ko, G. Samolyuk, and M. Torikachvili, Physica B 403, 844 (2008).
- Jia et al. (2009) S. Jia, N. Ni, S. L. Bud’ko, and P. C. Canfield, Phys. Rev. B 80, 104403 (2009).
- Jia (2008) S. Jia, Ph.D. thesis, Iowa State University (2008).
- Mun et al. (2012) E. D. Mun, S. Jia, S. L. Bud’ko, and P. C. Canfield, Phys. Rev. B 86, 115110 (2012).
- Coleman (2007) P. Coleman, Heavy Fermions: Electrons at the Edge of Magnetism (John Wiley & Sons, Ltd, 2007), chap. 2, pp. 95–148.
- Doniach (1977) S. Doniach, Physica B+C 91, 231 (1977).
- Saiga et al. (2008) Y. Saiga, K. Matsubayashi, T. Fujiwara, M. Kosaka, S. Katano, M. Hedo, T. Matsumoto, and Y. Uwatoko, J. Phys. Soc. Jpn. 77, 053710 (2008).
- Matsubayashi et al. (2010) K. Matsubayashi, Y. Saiga, T. Matsumoto, and Y. Uwatoko, J. Phys.: Conf. Ser. 200, 012112 (2010).
- Matsubayashi et al. (2009) K. Matsubayashi, Y. Saiga, T. Matsumoto, and Y. Uwatoko, J. Phys.: Conf. Ser. 150, 042117 (2009).
- Jia et al. (2007) S. Jia, S. L. Bud’ko, G. D. Samolyuk, and P. C. Canfield, Nat. Phys. 3, 334 (2007).
- Canfield (2010) P. C. Canfield, Solution growth of intermetallic single crystals: a beginner’s guide (World Scientific, 2010), vol. 2 of Book Series on Complex Metallic Alloys, chap. 2, pp. 93–111.
- Torikachvili et al. (2008) M. S. Torikachvili, S. L. Bud’ko, N. Ni, and P. C. Canfield, Phys. Rev. B 78, 104527 (2008).
- Torikachvili et al. (2009) M. S. Torikachvili, S. L. Bud’ko, N. Ni, P. C. Canfield, and S. T. Hannahs, Phys. Rev. B 80, 014521 (2009).
- Colombier and Braithwaite (2007) E. Colombier and D. Braithwaite, Rev. Sci. Instrum. 78, 093903 (2007).
- Eiling and Schilling (1981) A. Eiling and J. S. Schilling, J. Phys. F 11, 623 (1981).
- Piermarini et al. (1973) G. J. Piermarini, S. Block, and J. Barnett, J. Appl. Phys. 44, 5377 (1973).
- Klotz et al. (2009) S. Klotz, J.-C. Chervin, P. Munsch, and G. L. Marchand, J. Phys. D 42, 075413 (2009).
- Varga et al. (2003) T. Varga, A. P. Wilkinson, and R. J. Angel, Review of Scientific Instruments 74, 4564 (2003).
- Sidorov and Sadykov (2005) V. A. Sidorov and R. A. Sadykov, J. Phys.: Condens. Matter 17, S3005 (2005).
- Alami-Yadri et al. (1998) K. Alami-Yadri, H. Wilhelm, and D. Jaccard, Solid State Commun. 108, 279 (1998).
- Knebel et al. (2001) G. Knebel, D. Braithwaite, G. Lapertot, P. C. Canfield, and J. Flouquet, J. Phys.: Condens. Matter 13, 10935 (2001).
- Trovarelli et al. (2002) O. Trovarelli, J. Custers, P. Gegenwart, C. Geibel, P. Hinze, S. Mederle, G. Sparn, and F. Steglich, Physica B 312-313, 401 (2002).
- Winkelmann et al. (1998) H. Winkelmann, M. M. Abd-Elmeguid, H. Micklitz, J. P. Sanchez, C. Geibel, and F. Steglich, Phys. Rev. Lett. 81, 4947 (1998).
- Yoshimori and Kasai (1983) A. Yoshimori and H. Kasai, J. Magn. Magn. Mater. 31-34, Part 1, 475 (1983).
- Coleman (1987) P. Coleman, J. Magn. Magn. Mater. 63-64, 245 (1987).
- Bauer et al. (1993) E. Bauer, R. Hauser, E. Gratz, K. Payer, G. Oomi, and T. Kagayama, Phys. Rev. B 48, 15873 (1993).
- Hertz (1976) J. A. Hertz, Phys. Rev. B 14, 1165 (1976).
- Millis (1993) A. J. Millis, Phys. Rev. B 48, 7183 (1993).
- Moriya and Takimoto (1995) T. Moriya and T. Takimoto, J. Phys. Soc. Jpn. 64, 960 (1995).
- Bud’ko et al. (2004) S. L. Bud’ko, E. Morosan, and P. C. Canfield, Phys. Rev. B 69, 014415 (2004).
- Bud’ko et al. (2005a) S. L. Bud’ko, E. Morosan, and P. C. Canfield, Phys. Rev. B 71, 054408 (2005a).
- Bud’ko et al. (2005b) S. L. Bud’ko, V. Zapf, E. Morosan, and P. C. Canfield, Phys. Rev. B 72, 172413 (2005b).
- Custers et al. (2010) J. Custers, P. Gegenwart, C. Geibel, F. Steglich, P. Coleman, and S. Paschen, Phys. Rev. Lett. 104, 186402 (2010).
- Schmiedeshoff et al. (2011) G. M. Schmiedeshoff, E. D. Mun, A. W. Lounsbury, S. J. Tracy, E. C. Palm, S. T. Hannahs, J.-H. Park, T. P. Murphy, S. L. Bud’ko, and P. C. Canfield, Phys. Rev. B 83, 180408 (2011).
- Mun et al. (2013) E. D. Mun, S. L. Bud’ko, C. Martin, H. Kim, M. A. Tanatar, J.-H. Park, T. Murphy, G. M. Schmiedeshoff, N. Dilley, R. Prozorov, et al., Phys. Rev. B 87, 075120 (2013).