The Curious Radial Distributions of Horizontal Branch Stars in NGC 6441
Abstract
NGC 6441 is one of the most massive and most metal-rich globular clusters in the galaxy, and is noted for an unusual extended horizontal branch which reaches past the instability strip. We find evidence that there are two different populations of stars within the heavily-populated red clump. Once a differential reddening correction is applied, a large but compact group of stars is found at the faint red end of the clump in the color magnitude diagram. Brighter, bluer stars in the clump are found to be more centrally concentrated within the cluster at very high level of significance. Curiously, the blue horizontal branch stars show a more complex distribution, and are not more centrally concentrated than the brighter red clump stars. The spatial distributions of clump stars is in agreement with the idea that the the brighter bluer part of the clump is a helium-enriched second generation. The blue horizontal branch stars may be showing evidence that they are being dynamically evaporated.
1 Introduction
Globular clusters (GCs) have long been seen as examples of simple stellar populations, though the current puzzle of multiple populations began with the discovery of “chemical anomalies” within GCs over thirty years ago (see Kraft 1994 for a review of early studies). Many studies have shown that while generally homogeneous in Fe-peak elements, GC stars can exhibit internal spreads in light element abundances (a more recent review can be found in Gratton et al. 2004). These anomalies have been observed at both the turnoff and along the subgiant branch (Gratton et al., 2001), and so the stars must have formed with at least some of the chemical anomalies.
High-precision photometric data have provided the means to identify broader evidence for multiple populations. Bedin et al. (2004) used Hubble Space Telescope (HST) data to show that the main sequence (MS) in Centauri is split into two components. Surprisingly, the bluer MS has twice the metallicity of the red component (Piotto et al., 2005), which can only be explained by helium enrichment of the more metal-rich component. Piotto et al. (2007) found that the MS of NGC 2808 is split into three components, and concluded this is probably also evidence of stellar populations with differing helium abundance. Splits on the subgiant branch (SGB) of multiple clusters have also been reported, including Cen, NGC 1851, NGC 2808, and NGC 6388 (Piotto, 2009). However, the oldest photometric evidence involves the unusual distribution of stars along the horizontal branch (HB). In this area, the clusters NGC 6388 and NGC 6441 are particularly noteworthy. Both clusters have high metallicity ([Fe/H] and , respectively; Carretta et al. 2009b), yet have extended horizontal branches that continue past the instability strip to K. The RR Lyrae variables in both clusters have unusually long periods (Pritzl et al., 2000), putting them in a third Oosterhoff class. These features may all be produced by populations of differing He enrichment (Caloi & D’Antona, 2007; D’Antona & Caloi, 2008).
While the HB of NGC 6441 has been studied several times before (Yoon et al., 2008; Busso et al., 2007; Caloi & D’Antona, 2007; Raimondo et al., 2002; Rich et al., 1997), two subjects have not been addressed: 1) although the signature of differential reddening in the cluster has been seen, researchers have not attempted to remove its effect on the CMD, and 2) the spatial distribution of the stars throughout the cluster has not been examined. If a second generation of stars forms from gas enriched by a previous generation, and the gas has had a chance to cool and collect in the gravitational potential of the cluster, the second generation of stars is expected to have a more concentrated distribution. This effect seems to have been observed in several clusters, as in the two MS populations of Cen (Bellini et al., 2009), the giant branch of NGC 3201 (Carretta et al., 2010), and potentially many others (Carretta et al., 2009a). In a massive and old cluster, however, dynamical effects like mass segregation may affect the stellar distribution. We therefore set out to examine NGC 6441 more closely.
2 Data
NGC 6441 is a massive bulge cluster with (McLaughlin & van der Marel, 2005). We rereduced HST WFPC2 archival data taken as part of proposal IDs 5667, 6095, 8251, and 8718, and ACS HRC data taken in proposal ID 9835. These datasets, which contain optical and some near-UV observations, were selected in order to obtain nearly complete samples of HB stars over a large fraction of the cluster’s mass. The data cover from the center of the cluster to a radius of 120, representing 3 half-light radii (; McLaughlin & van der Marel 2005), or about 15 core radii ().
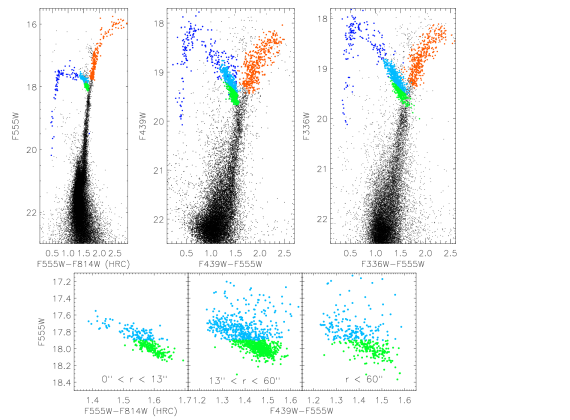
The WFPC2 images were analyzed using the HSTPhot package (Dolphin, 2000), and stars were cross-identified among the multiple pointings. Median internal magnitude error estimates were 0.02-0.03 mag at the level of the horizontal branch for the images (from proposal 8251) covering the largest portion of the field discussed here. The ACS HRC images were processed using the ACS module of DOLPHOT (dolphin2002). Populations were primarily identified via the color-magnitude diagrams (CMDs) shown in Fig. 1 — primarily ACS F555W versus F555W-F814W for the cluster core, and WFPC2 F439W versus F439W-F555W elsewhere. A different procedure was needed for fainter blue HB stars (as discussed below). The HB star group contains 2125, while the combined red giant/asymptotic giant (RGB/AGB) group 912 stars. The HB can be subdivided into the red clump (RC; 1754 stars) and the “blue” HB (BHB; 371 stars). The identification of the BHB sample deserves some additional explanation. The sample described here includes RR Lyrae variables (identified from Pritzl et al. 2003 and Corwin et al. 2006) and some red HB stars bluer than the clump, but does not include extreme HB stars () as those stars were found to have significant incompleteness. The BHB stars were validated using near-UV data from proposal 8718 (PI Piotto) and 5667 (PI Margon; F336W filter only) when available because crowding of star images is reduced in the UV where cooler giants and main sequence stars emit less. UV data was only available for two mostly overlapping WFPC2 pointings, and so did not cover the entire extent of the optical data. Importantly though, it does cover the center of the cluster where blending with brighter cluster stars is the most likely to cause BHB stars to be lost in optical photometry. In the F255W filter for example, the blue HB stars are among the brightest cluster sources, and crowding effects are negligible. Outside of the fields covered by the UV images, the F439W filter plays a similar role by enhancing the brightess of BHB stars relative to the numerous faint RGB and MS stars. Our artificial star tests indicate that incompleteness among our BHB sample is less than 3% in the central regions.
Nataf et al. (2011) and Milone et al. (2012) have shown that structure within the RC of 47 Tuc can also reflect population differences within a cluster. Because the RC population in NGC 6441 is large, it provides an excellent probe of the radial structure of the cluster even when subdivided. In light of this, we examined several different ways of bisecting the RC population: by magnitude, by line parallel to the slope of the HB, and by line perpendicular to the slope of the HB. In this way we can look for signs of population differences somewhat independent of theoretical expectations. Because the results of subdividing the clump could be affected by the cluster’s differential reddening (see Fig. 7 of Raimondo et al. 2002 or Fig. 4 of Busso et al. 2007), we corrected for this by determining the median color shift of lower RGB stars () from a mean line in the CMD. The correction was determined for each HB star from RGB stars within or depending on the number of RGB stars available. In the center of the cluster, we relied on the high resolution photometry from the ACS HRC (proposal 9835, PI Drukier) to reduce incompleteness and also to minimize the effects of blending in the photometry. If uncorrected, this allows some clump stars to be measured as too bright and allows some red giants to masquerade as clump stars when blended with fainter stars. Our artificial star tests indicate that our incompleteness for clump stars is less than 1% across the entire HRC field, and the median magnitude offset between input and output stars was approximately 0.002 mag.
Sky coordinates were determined using the METRIC task in the STSDAS IRAF package Before examining the radial distributions of stars in the cluster, we recalculated the cluster centroid using a method similar to that used by Montegriffo et al. (1995), and found to be and , or about from that of Harris (1996).
3 Results
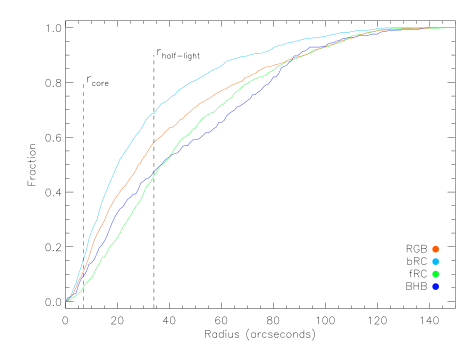
We used Kolmogorov-Smirnov (KS) test statistics to calculate the probabilities that the cumulative radial distributions (CRDs) of different subpopulations were drawn from the same underlying distributions (Fig. 2). In our analysis, the RGB/AGB group was used as a stand-in for the cluster as a whole as this portion of the CMD does not show multiple populations as clearly.
When examining subdivisions of the red clump, we found that cuts parallel to the HB did not produce radial distributions of the bright and faint components that were significantly different. Cuts perpendicular to the HB and cuts by F555W magnitude both resulted in groups that had significant differences in their radial distributions, and the results of KS tests were essentially equivalent. (This is perhaps expected given the steep slope of the HB at the location of the RC.) For the lack of a strong reason for selection, we concentrate on cuts made at a F555W magnitude of 17.9 for the rest of this study, and designate the subpopulations the bright red clump (bRC) and faint red clump (fRC). As seen in Fig. 2, the bRC is quite significantly more centrally concentrated than the fRC, with the probability that the two are drawn from the same underlying distribution being . The bRC is also more centrally concentrated than the RGB/AGB.
A closer examination of the clump reveals clues to why this is. After the clump has been corrected for differential reddening, the color extent of the clump is similar in the three radial bins we selected, indicating that the issue has been largely removed. In the innermost bin, there are few stars at the faint red end of the clump (). There is a strong concentration of stars at that end of the clump in the middle radius bin, but in the outermost bin the stars are distributed nearly uniformly across the clump. This behavior can be seen in the CMD array in Fig. 4 of Busso et al. (2007) as well — there is a tendency for the clump to appear stubbier and more concentrated in color outside the centralmost part of the cluster.
The BHB shows yet another pattern in its radial distribution. Overall, the CRD (Fig. 2) indicates that the BHB is less centrally concentrated than both the bRC and the RGB/AGB. Comparison of the BHB and RGB/AGB distributions produces a KS probability (that they derive from the same underlying radial distribution) of . But it is also interesting that the slope of the distribution between 25 and 60, is lower than those for other populations. The shallower slope perhaps suggests that the radial distribution of BHB stars is bimodal, though more weakly than is often seen in blue straggler studies (Ferraro et al., 2004, e.g.).
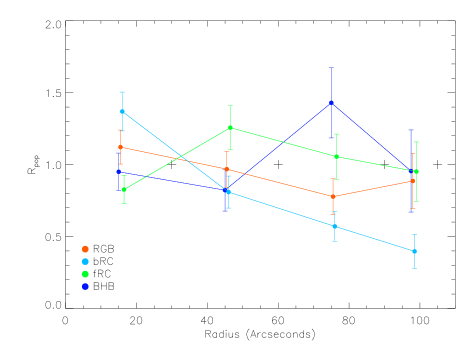
To clarify the situation further, we have compared the stellar populations with the cluster light distribution using doubly-normalized ratios from blue straggler studies (Ferraro et al., 1993). We calculated the sampled luminosity using a King model with structural parameters taken from McLaughlin & van der Marel (2005) that fits the surface brightness distribution of the cluster. The ratio is calculated in annular radial bins centered on the cluster, and is designed to equal 1 if the stellar population matched the light distribution (see Fig. 3). In the ratios, the BHB stars show an enhancement in numbers in the third radial bin () that is significant at the level. The bRC stars show the most significant deviations from following the light, with the population ratio steadily decreasing moving outward from the center.
Before discussing the physical meaning of these distributions, it is worth commenting on possible complicating factors. Although others have concluded that differential reddening is not responsible for the slope of the the clump (Busso et al., 2007; Raimondo et al., 2002; Sweigart & Catelan, 1998), we applied a correction as described in §2 to eliminate the majority of its effect. The referee wondered whether blending could produce the strong central concentration seen in the bRC population. This idea is contradicted by the fact that strong central concentration among the brighter clump stars is still seen when the clump is split along a line perpendicular to the HB (more like a color cut) while the concentration disappears when the cut is made parallel to the HB (more like a magnitude cut). It could also be imagined that incompleteness might be an issue in the population of BHB stars (particularly among the faint blue tail in the optical CMD), but there are several ways to see this is a minor consideration. First, in the core where incompleteness is the biggest issue, our star selections made use of near-UV photometry — this reveals the hottest HB stars even when very close to redder HB stars and giants, and crowding issues are negligible in the near UV. Second, the blue tail of the BHB is a small fraction (about 13%) of the stars in the BHB sample. So while we may have lost some (3) of the hottest HB stars (faintest in the optical) to incompleteness, this would not affect conclusions about the radial distributions.
4 Discussion
The impression from the red clump stars in NGC 6441 is that the bluest and brightest of the red clump stars are considerably more centrally concentrated than the stars at the faint red end of the clump, which are found in a small area of the CMD. However, the even hotter BHB stars are less centrally concentrated than the bRC stars and show a radial distribution of different character. These indications of three HB populations with differing radial distributions in NGC 6441 are difficult to fit into a consistent picture.
Cluster self-enrichment is the current leading explanation for multiple populations in globular clusters, involving a second generation of stars formed from gas polluted in helium and some heavier elements by ejecta from a group of stars such as intermediate-mass asymptotic giant branch stars (Ventura & D’Antona, 2008) or rapidly-rotating massive stars (Decressin et al., 2007) in the first generation (FG). There are several factors that affect the radial distribution of the second generation (SG), although one of the primary predictions is that the formation of the second generation only begins once gas has cooled and concentrated in the potential well of the cluster. SG stars are thus expected to be more centrally concentrated than the FG, although later dynamical evolution of the cluster could modify this.
Caloi & D’Antona (2007) produced synthetic models of NGC 6441 HB stars using this picture with the fRC representing FG stars (helium abundance , and having a compact distribution in the CMD), while the bRC contained SG stars reaching helium abundances of at least . BHB stars in the models involved a combination of stars with even higher abundances (up to ) and stars that had evolved from the bright end of the clump (large helium abundances result in large blueward excursions during HB evolution). They estimated that the enriched HB population contained 60% of the stars, although they based their study on a smaller sample of stars and did not account for differential reddening, which smears out the peak at the faint end. This last factor also influences whether or not a gap in between FG and SG stars is inferred (see their Fig. 7)
On the basis of the CMD, there is good evidence of two populations. However, the radial distributions paint a more complex picture. Specifically, the BHB stars do not not continue the trend that hotter HB stars (presumably even more helium enriched) are also centrally concentrated.
Though the second generation may be born with a more centrally concentrated distribution, simple physics tells us two-body interactions must occur, causing the SG stars to diffuse outward over time. This effect would be enhanced by the fact that helium-enriched stars are expected to be less massive than stars of normal composition because they can evolve off the main sequence more quickly (D’Antona & Caloi, 2008). Two-body interactions in a cluster lead the stars toward equipartition of kinetic energy, “heating” the SG stars and giving them a more extended distribution (Carretta et al., 2009a). This process is expected to act within a Hubble time (D’Ercole et al., 2008), affecting the innermost part of the distribution most quickly. Over time, the cluster core should begin to be depleted of the progenitors of BHB stars, while stars on larger orbits would be less affected.
As an exercise, we can calculate the radius at which the dynamical relaxation timescale equals the lifetime of the cluster. We again use cluster structural parameters from McLaughlin & van der Marel (2005) and the following equation from Binney & Tremaine (2008), which describes a stellar system that is a singular isothermal sphere:
| (1) |
and find that the relaxation radius is 60. This falls within the part of the BHB radial distribution that has shallower slope than the rest of the stellar groups. Qualitatively, the BHB distribution shows the signatures of dynamical modifications.
Other mechanisms such as gas expulsion (Decressin et al., 2010) can affect the dynamical evolution of the cluster, so that more detailed models will be needed to verify whether the radial distributions are consistent with expected masses for helium-enriched populations. Examination of other dynamically interesting populations, such as blue stragglers, would also clarify the state of the cluster structure. In the more massive blue straggler star populations of many clusters, there is a bimodal radial distribution, where the “zone of avoidance” corresponds well to the area expected to be cleared out dynamical friction. However, in NGC 6388, a cluster similar to NGC 6441 in many respects, blue stragglers still populate that area, making the cluster appear dynamically young (Dalessandro et al., 2008).
References
- Bedin et al. (2004) Bedin, L. R., Piotto, G., Anderson, J., Cassisi, S., King, I. R., Momany, Y., & Carraro, G. 2004, ApJ, 605, L125
- Bellini et al. (2009) Bellini, A., Piotto, G., Bedin, L. R., King, I. R., Anderson, J., Milone, A. P., & Momany, Y. 2009, A&A, 507, 1393
- Binney & Tremaine (2008) Binney, J., & Tremaine, S. 2008, Galactic Dynamics: Second Edition, by James Binney and Scott Tremaine. ISBN 978-0-691-13026-2 (HB). Published by Princeton University Press, Princeton, NJ USA, 2008
- Busso et al. (2007) Busso, G. et al. 2007, A&A, 474, 105
- Caloi & D’Antona (2007) Caloi, V., & D’Antona, F. 2007, A&A, 463, 949
- Carretta et al. (2010) Carretta, E., Bragaglia, A., D’Orazi, V., Lucatello, S., & Gratton, R. G. 2010, A&A, 519, A71
- Carretta et al. (2009a) Carretta, E., et al. 2009, A&A, 505, 117
- Carretta et al. (2009b) Carretta, E., Bragaglia, A., Gratton, R., D’Orazi, V., & Lucatello, S. 2009, A&A, 508, 695
- Corwin et al. (2006) Corwin, T. M., Sumerel, A. N., Pritzl, B. J., et al. 2006, AJ, 132, 1014
- Dalessandro et al. (2008) Dalessandro, E., Lanzoni, B., Ferraro, F. R., et al. 2008, ApJ, 677, 1069
- D’Antona & Caloi (2008) D’Antona, F., & Caloi, V. 2008, MNRAS, 390, 693
- Decressin et al. (2007) Decressin, T., Meynet, G., Charbonnel, C., Prantzos, N., & Ekström, S. 2007, A&A, 464, 1029
- Decressin et al. (2010) Decressin, T., Baumgardt, H., Charbonnel, C., & Kroupa, P. 2010, A&A, 516, A73
- D’Ercole et al. (2008) D’Ercole, A., Vesperini, E., D’Antona, F., McMillan, S. L. W., & Recchi, S. 2008, MNRAS, 391, 825
- Dolphin (2000) Dolphin, A. E. 2000, PASP, 112, 1383
- Dolphin et al. (2002) Dolphin, A. E., Saha, A., Claver, J. 2002, AJ, 123, 3154
- Ferraro et al. (2004) Ferraro, F. R., Beccari, G., Rood, R. T., et al. 2004, ApJ, 603, 127
- Ferraro et al. (1993) Ferraro, F. R., Pecci, F. F., Cacciari, C., et al. 1993, AJ, 106, 2324
- Gratton et al. (2001) Gratton, R. G., et al. 2001, A&A, 369, 87
- Gratton et al. (2004) Gratton, R., Sneden, C., & Carretta, E. 2004, ARA&A, 42, 385
- Harris (1996) Harris, W.E. 1996, AJ, 112, 1487
- Kraft (1994) Kraft, R. P. 1994, PASP, 106, 553
- Montegriffo et al. (1995) Montegriffo, P., Ferraro, F. R., Fusi Pecci, F., & Origlia, L. 1995, MNRAS, 276, 739
- McLaughlin & van der Marel (2005) McLaughlin, D. E., & van der Mar‘¡el, R. P. 2005, ApJS, 161, 304
- Milone et al. (2012) Milone, A. P., Piotto, G., Bedin, L. R., et al. 2012, ApJ, 744, 58
- Nataf et al. (2011) Nataf, D. M., Gould, A., Pinsonneault, M. H., & Stetson, P. B. 2011, ApJ, 736, 94
- Piotto (2009) Piotto, G. 2009, IAU Symposium, 258, 233
- Piotto et al. (2005) Piotto, G., et al. 2005, ApJ, 621, 777
- Piotto et al. (2007) Piotto, G., et al. 2007, ApJ, 661, L53
- Pritzl et al. (2000) Pritzl, B., Smith, H. A., Catelan, M., & Sweigart, A. V. 2000, ApJ, 530, L41
- Pritzl et al. (2003) Pritzl, B. J., Smith, H. A., Stetson, P. B., et al. 2003, AJ, 126, 1381
- Raimondo et al. (2002) Raimondo, G., Castellani, V., Cassisi, S., Brocato, E., & Piotto, G. 2002, ApJ, 569, 975
- Rich et al. (1997) Rich, R. M., Sosin, C., Djorgovski, S. G., et al. 1997, ApJ, 484, L25
- Sweigart & Catelan (1998) Sweigart, A. V., & Catelan, M. 1998, ApJ, 501, L63
- Ventura & D’Antona (2008) Ventura, P., & D’Antona, F. 2008, MNRAS, 385, 2034
- Yoon et al. (2008) Yoon, S.-J., Joo, S.-J., Ree, C. H., Han, S.-I., Kim, D.-G., & Lee, Y.-W. 2008, ApJ, 677, 1080