Planetary Nebula Spectrograph survey of S0 galaxy kinematics. II. Clues to the origins of S0 galaxies
Abstract
The stellar kinematics of the spheroids and discs of S0 galaxies contain clues to their formation histories. Unfortunately, it is difficult to disentangle the two components and to recover their stellar kinematics in the faint outer parts of the galaxies using conventional absorption line spectroscopy. This paper therefore presents the stellar kinematics of six S0 galaxies derived from observations of planetary nebulae (PNe), obtained using the Planetary Nebula Spectrograph. To separate the kinematics of the two components, we use a maximum-likelihood method that combines the discrete kinematic data with a photometric component decomposition. The results of this analysis reveal that: the discs of S0 galaxies are rotationally supported; however, the amount of random motion in these discs is systematically higher than in comparable spiral galaxies; and the S0s lie around one magnitude below the Tully–Fisher relation for spiral galaxies, while their spheroids lie nearly one magnitude above the Faber–Jackson relation for ellipticals. All of these findings are consistent with a scenario in which spirals are converted into S0s through a process of mild harassment or “pestering,” with their discs somewhat heated and their spheroid somewhat enhanced by the conversion process. In such a scenario, one might expect the properties of S0s to depend on environment. We do not see such an effect in this fairly small sample, although any differences would be diluted by the fact that the current location does not necessarily reflect the environment in which the transformation occurred. Similar observations of larger samples probing a broader range of environments, coupled with more detailed modelling of the transformation process to match the wide range of parameters that we have shown can now be measured, should take us from these first steps to the definitive answer as to how S0 galaxies form.
keywords:
galaxies: elliptical and lenticular – galaxies: evolution – galaxies: kinematics and dynamics.1 Introduction
The origin of lenticular, or S0, galaxies, and in particular whether they are more closely related to spiral galaxies or elliptical galaxies, remains obscure. They display the bulge-plus-disc morphology that we associate with spiral galaxies, but they lack the young stars in spiral arms that we associate with such systems, and tend to be more dominated by their spheroidal bulge components, making it tempting to associate them with elliptical galaxies.
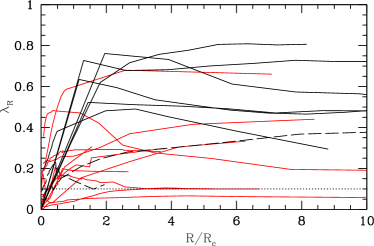
Moving away from purely morphological considerations, we might hope that kinematic information can help to ascertain which other galaxies are S0s closest cousins, since the traditional view is that disc-dominated spiral galaxies will reflect that morphology in rotationally-dominated kinematics, while elliptical galaxies are largely supported by random motions. However, more recent data suggests that the situation is somewhat subtler. The importance of rotation was quantified by Emsellem et al. (2007), who defined the quantity , the cumulative specific angular momentum of galaxies as a function of radius, seeking to draw a distinction between disc- and bulge-dominated systems via this parameter. Unfortunately, they show that there is no clear dichotomy in this quantity, with a broad spectrum of degrees of rotational support. Coccato et al. (2009) calculate the same quantity for a sample of elliptical galaxies, but using PNe as tracers of the velocity field and, in this way, exploring a wider range of radii. They show that the recovered smoothly join the quantity obtained with the SAURON data, which describe the central regions of the galaxies, where PNe are not detectable. This radially-extended reconstruction of the specific angular momentum for a sample of elliptical (Coccato et al., 2009) and S0 (Cortesi et al., 2011) galaxies, shown in Figure 1, displays the same continuous range of profiles, seemingly unrelated to the galaxy morphology. It also presents a surprising degree of variation in profile shape at the large radii probed by PNe, with some dropping dramatically, apparently changing from rotationally-supported systems to being dominated by random motions in their outermost parts.
We first encountered this phenomenon in an analysis of the S0 galaxy NGC 1023, where a pilot study of PNe with the Planetary Nebula Spectrograph (PN.S) showed a major decrease in rotational motion at large radii (Noordermeer et al., 2008). This drop in angular momentum was initially interpreted as evidence that a normal rotationally-supported stellar disc had been dramatically heated into random motion by a merger in its outer parts. However, by more careful modelling of separate bulge and disc components, we were able to show that this behaviour was in fact caused simply by the superposition of a cold rotating disc and a hot spheroidal component, whose relative contributions to the observed kinematics varied with both radius and azimuth around the galaxy (Cortesi et al., 2011).
This discovery underlined the importance of treating S0 galaxies as multi-component systems (see also Kormendy & Bender (2012)), and taking care to separate out the distinct stellar bulge and disc elements kinematically as well as photometrically. Once this decomposition has been performed properly, we have access to a range of diagnostics that can be used to provide clues to the formation history of these galaxies. For example, if they are simply spiral galaxies that have quietly ceased forming stars, one would expect their stellar discs to have the same kinematic properties as those in spirals; if, on the other hand, a more violent event such as a minor merger led to the transition from spiral to S0, one might expect the disc, if not destroyed in the process, to at least have had its random motions increased significantly (Bournaud, Jog & Combes, 2005). Equally, with reliable kinematic parameters for the individual components, we can see where they lie relative to the usual kinematic scaling relations followed by spirals and ellipticals, to see if they could plausibly have evolved from such progenitors.
In this paper, we therefore apply the kinematic bulge–disc decomposition technique developed in Cortesi et al. (2011) to the sample of six S0s with suitable PNe data presented in Cortesi et al. (2013). This sample was selected to span a range of environments in order to see if the evolutionary properties depend systematically on surroundings: NGC 7457 and NGC 3115 are isolated; NGC 1023 and NGC 2768 are the dominant galaxies of two small groups (5-6 members); while NGC 3384 and NGC 3489 are satellite galaxies of the Leo Group (30 members). The Hubble types of these galaxies and the adopted distance moduli are listed in Table 1.
The remainder of this paper is laid out as follows. In Section 2, we present the photometric bulge–disc decomposition that underlies the analysis, and confirms the nature of these galaxies as composite S0 systems. Section 3 then uses this decomposition to model the spheroid and disc kinematics of each system, and Section 4 looks at the characteristic kinematics of the separate components for indications as to their origins. Section 5 brings this evidence together to present the emerging picture as to the steps leading to the formation of a lenticular galaxy.
2 Photometric decomposition
In order to correctly assign each PN’s observed velocity to disc or bulge kinematics, we must first calculate the relative contributions of disc and bulge to the total light at its location. To do so, we follow the same photometric decomposition procedure described in Cortesi et al. (2011), briefly summarised here for completeness.
| Name | Type | Distance modulus | Archive | Band | Angular scale | Zero point |
|---|---|---|---|---|---|---|
| [mag] | [” per pixel] | [mag] | ||||
| NGC 3115 | S0-edge-on | 2MASS | ||||
| NGC 7457 | SA(rs)0- | 2MASS | ||||
| NGC 2768 | E6 | 2MASS | ||||
| NGC 1023 | SB(rs)0- | 2MASS | ||||
| NGC 3489 | SAB(rs)0+ | SDSS | ||||
| NGC 3384 | SB(s)0- | 2MASS |
Where possible, the galaxies’ images used for the decomposition are -band data from the 2MASS survey (Skrutskie et al., 2006), since these near infrared images minimize the influence of any modest amounts of dust extinction present in these S0 systems. For NGC 3489, the 2MASS image did not go deep enough to carry out the decomposition, so we instead used the reddest SDSS optical image, and for NGC 1023 we also employed a deep R-band image (Noordermeer et al., 2008), which allowed us to mask the companion galaxy NGC 1023A while performing the decomposition (Cortesi et al., 2011). The details of the images and other input data used in the fitting process are presented in Table 1.
| Disc | Spheroid | B/T | |||||||||
| Name | |||||||||||
| [mag] | [arcs] | [deg] | [deg] | [mag] | [arcs] | [deg] | |||||
| NGC 3115 | |||||||||||
| NGC 7457 | |||||||||||
| NGC 2768 | |||||||||||
| NGC 1023 | |||||||||||
| NGC 3489 | |||||||||||
| NGC 3384 | |||||||||||
|
|
|
|
|
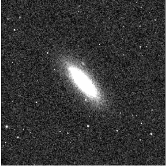
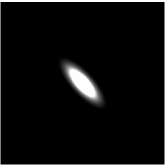
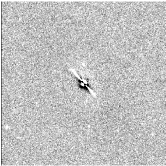
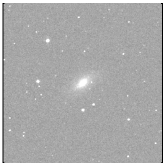
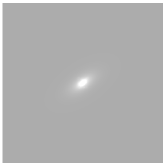
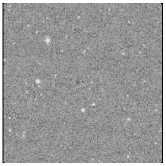
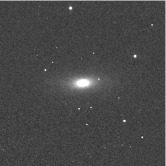
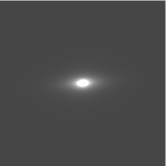
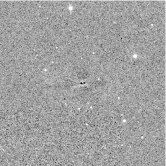
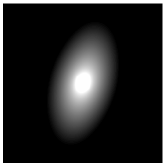
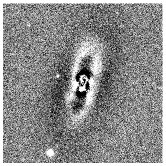
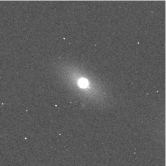
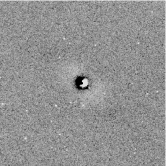
The images were modeled using GALFIT (Peng et al., 2002) to fit an exponential disc and a Sersic profile spheroid. For most galaxies, a satisfactory fit was obtained by fixing the Sersic profile index at the conventional de Vaucouleurs law value of , but in the case of NGC 2768 this produced a poor fit, so the index was left as a free parameter. The resulting fits to the images are presented in Figure 2, and the associated values for the best fit parameters are given in Table 2. As is apparent from Figure 2, in some cases this simple two component model fits the galaxy very well, while in others systematic residuals indicate that the system is somewhat more complex. In particular, we find:
-
•
NGC 3115 contains an additional very thin disc-like structure as well as the thicker disc component that we have fitted. In addition, the de Vaucouleurs fit is not perfect for the bulge at very small radii.
-
•
NGC 3489 contains a faint but significant ring structure.
-
•
NGC 3384 shows a central dipolar structure in the residuals, seemingly indicative of an off-centre nucleus.
Although all these features are interesting, and tell us that even the plainest looking S0 galaxy can be quite complex, they are all either localized in regions of high surface brightness where we do not detect the PNe used in this kinematic analysis, or they are of low surface brightness compared to the main bulge and disc components. Accordingly, they do not compromise our ability to use the simple two component fit to determine the relative contributions of disc and spheroid to the light at each point in the galaxy.
 |
 |
 |
 |
 |
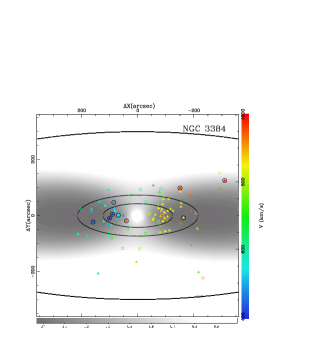 |
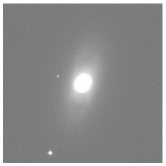
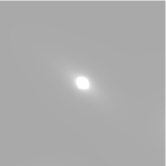
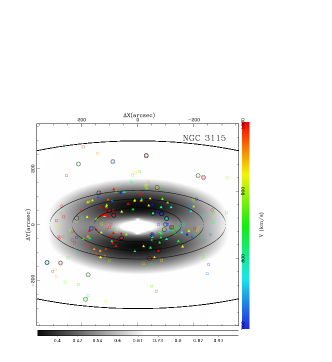
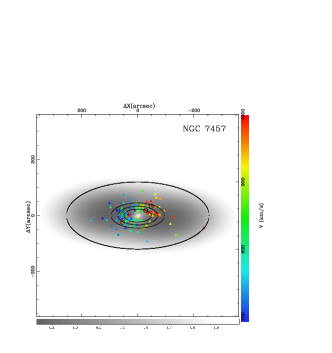
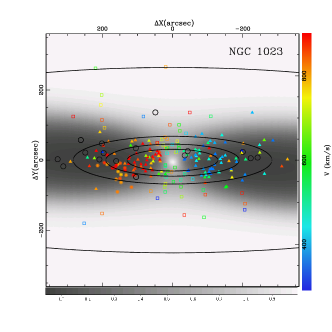
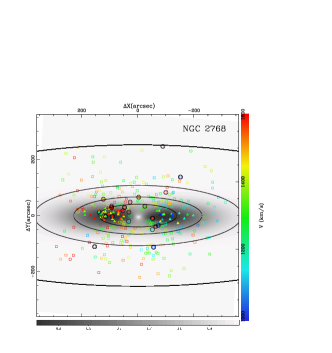
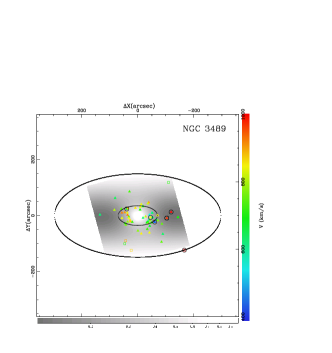
To illustrate the assignment of PNe to the two components, Figure 3 shows a greyscale image of the spheroid-to-total light at each point in the model. The PNe are also plotted and identified by whether they lie in a region where spheroid or disc dominates, but note that, in the kinematic likelihood analysis below, each is assigned an exact value from this image, such that it has a probability that it comes from the spheroidal component and that it comes from the disc component (Cortesi et al., 2011).
3 disc and spheroid kinematic profiles
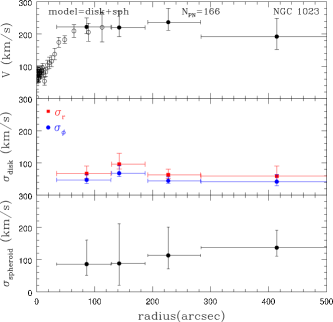
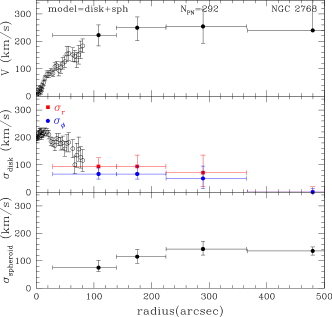
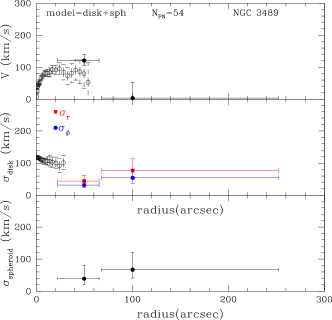
Having obtained the disc–spheroid light decomposition for each galaxy, we can now fit all the line-of-sight velocities for the PNe shown in Figure 3 using a maximum likelihood fit. The method, described in detail in Cortesi et al. (2011), essentially involves fitting in radial bins using a model comprising a simple Gaussian spheroid line-of-sight velocity distribution plus a similar Gaussian velocity distribution for the disc component. For the disc component, we allow a non-zero mean velocity to fit rotation, varying with azimuth as geometrically required for a rotating disc, and also incorporate the fact that its line-of-sight velocity dispersion is a different projection of the disc’s coupled radial and tangential velocity dispersions, and respectively, at different azimuths. We neglect the contribution of the -component of the velocity dispersion: it is intrinsically smaller, and its modest projection along the line of sight further reduces its significance in these inclined systems. We also assume that the disc is not too hot, so we can invoke the epicycle approximation to couple the values of and . This fitting process thus solves for a simplified model of both disc and spheroid kinematics, and also allows us to identify and reject PNe that do not fit the model, based on their individual contributions to the total likelihood.
 |
 |
 |
 |
 |
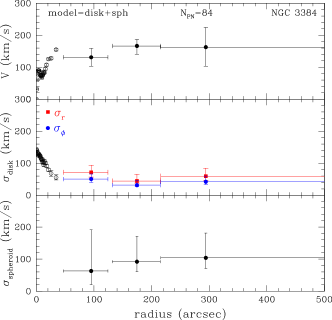 |
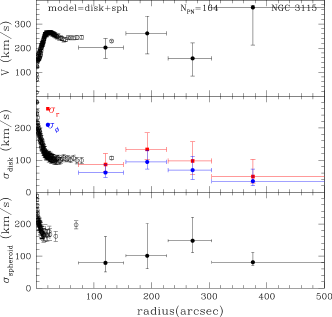
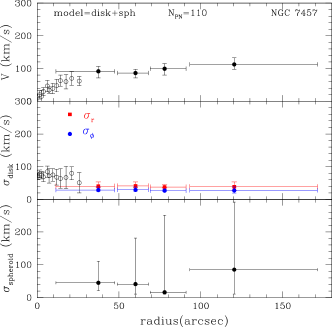
Any PNe rejected in this process are highlighted in Figure 3, and the final resulting best-fit kinematic parameters as a function of radius are shown in Figure 4. In each case, the radial bins have been chosen to ensure that each contains at least 30 PNe, as found to be a suitable minimum in Cortesi et al. (2011), which is why the bin sizes and number vary from galaxy to galaxy. The resulting elliptical bin boundaries are shown in Figure 3. For comparison, Figure 4 also shows conventional absorption-line kinematics along the major axes from various sources (Caon, Macchetto & Pastoriza, 2000; Simien & Prugniel, 1997; Norris, Sharples & Kuntschner, 2006; Debattista, Corsini & Aguerri, 2002). Since the disc light dominates in this region, we compare these data to the derived disc kinematics. In one case there is also published minor-axis data (Norris, Sharples & Kuntschner, 2006) where the bulge light dominates, so the absorption-line dispersion profile is compared to the bulge kinematics that we derive. In all cases, the agreement between the two methods is good, but the comparison underlines how conventional absorption-line spectroscopy is typically limited to the bright inner parts of each galaxy.
One simplification that we have made in this analysis is in assuming that the spheroidal component is non-rotating. In general, there is not sufficient data to allow us to relax this assumption, but in the case of NGC 2768 Forbes et al. (2012) found that the larger number of PNe allowed this extra degree of freedom to be introduced. However, the resulting spheroidal component was found to be completely dominated by random motions, so the difference was negligible, justifying the assumption in the case of this galaxy and rendering it plausible for the other galaxies where there were not sufficient data to test it directly. This assumption also fits with the findings in spiral galaxies, where classical bulges tend to be very slowly rotating (MacArthur, González & Courteau, 2009) while pseudo-bulges with low Sersic indices display more rotational support (Fabricius et al., 2012); the high Sersic indices for these galaxies (see Table 2) suggests we might expect a corresponding lack of rotation.
One further assumption we made is that the galaxies have only two components, a disc and a spheroid. As discussed above, the images show some departures from this simple model, although in most cases these extra features are fairly minor. The only exception is NGC 3115, which seems to contain two discs of different thickness. This object would clearly be interesting to study in its own right with a more sophisticated model, but for the current analysis, it makes more sense to treat it in a manner consistent with the other galaxies, fitting only the spheroid and the brighter disc. It is interesting to note that this model results in more PNe being rejected from the fit than in other galaxies, which once again illustrates the power of the likelihood approach to reject discrepant objects and home in on the components being fitted, as was originally seen in Cortesi et al. (2011).
As is apparent from Figure 4, this analysis reveals a remarkably consistent kinematic picture amongst these galaxies. The one exception seems to be NGC 3489, although it is notable that this galaxy contains the smallest number of available kinematic tracers, which may be compromising the results somewhat. However, apart from this galaxy, all the systems here display kinematics with many features in common: the spheroidal components have a dispersion that varies very little with radius, and the disc components rise to flat rotation curves with ordered motions dominating over random velocities at all radii. It is interesting to compare this situation with the much more heterogeneous picture presented in Figure 1; it would appear that at least some of the variety in that plot arose from the net effect of superimposing multiple kinematic components whose respective contributions vary from galaxy to galaxy. This new consistency provides some confidence in the analysis, but also offers at least the possibility that these galaxies are sufficiently homogeneous for some common underlying formation mechanism to exist.
4 Analyzing the characteristic kinematics
| Name | ||||
|---|---|---|---|---|
| [km/s] | [km/s] | [km/s] | ||
| NGC 3115 | ||||
| NGC 7457 | ||||
| NGC 2768 | ||||
| NGC 1023 | ||||
| NGC 3489 | ||||
| NGC 3384 |
4.1 Deriving characteristic values
Having determined the kinematic profiles of the spheroid and disc components of these S0 galaxies, we can now start to use these data to seek archaeological evidence as to how they formed. As a starting point, we translate these profiles into characteristic values for the kinematics of each component. For the disc, we determine the mean streaming motion, , and the two components of velocity dispersion, and , at three disc scale lengths as determined by the photometric parameters (see Table 2), since by this radius they seem to have settled to their asymptotic values. The only exception is NGC 3489, where the limited amount of kinematic data restricts us to calculating these quantities at ; in practice this makes little difference, as in the other galaxies the parameters do not change significantly over this radial range. The resulting values are presented in Table 3. In the spheroids, the velocity dispersion does not change significantly with radius, so we simply calculate a luminosity-weighted average value,
| (1) |
where is the luminosity of the spheroid in each radial bin, as ascertained from the photometric fit. The resulting values of are also listed in Table 3.
The other kinematic quantity we need to derive is the characteristic circular speed of each galaxy, , which provides a measure of the system’s mass. Because of the presence of significant random motions, we cannot simply use the mean streaming speed of the stars, but must correct these motions for asymmetric drift via the equation
| (2) |
(Binney & Tremaine, 1987). If the random motions are not too large and the rotation curve is close to flat, then the epicycle approximation implies that . If we further use the photometrically-derived exponential disc profile (see Section 2) to determine and fit the observed variation in velocity dispersion with radius using a further exponential with its own scalelength,
| (3) |
the asymmetric drift equation simplifies to
| (4) |
We can hence estimate at any radius using this equation; Table 3 lists the derived characteristic value of this quantity for each galaxy at , which matches the fiducial radius used for the other kinematic parameters; it is also at large enough radii that the circular speed will have converged to its characteristic asymptotic value. A check on the validity of this simplified equation is provided by comparing our results to those of Davis et al. (2011), who carried out full anisotropic Jeans modelling (Cappellari, 2008) on two of the sample galaxies. They obtained circular velocities of for NGC 2768 and for NGC 3489, in good agreement with the values derived here.

4.2 Disc kinematics
As previously mentioned, one key diagnostic of the evolutionary past of a disc is provided by the ratio between its ordered and random motions: if they are simply spiral galaxies that have ceased forming stars, then they should be dominated by mean streaming motions in the same way as their progenitors, whereas any more violent transition such as one precipitated by a merger would tend to heat the disc and hence decrease the dominance of the rotation. Table 3 lists the characteristic values of for these S0 systems, yielding a mean value of 4.2, with an RMS scatter of 0.8. These values contrast with the obtained by Bournaud, Jog & Combes (2005) in the simulations that formed S0s from a range of minor mergers, suggesting that this is not the mechanism responsible for the creation of these galaxies.
To determine whether the data are consistent with the alternative hypothesis that these discs are simply “dead” spiral discs, we consider the kinematics of eight spiral galaxies presented by Bottema (1993) and five shown by Herrmann & Ciardullo (2009), which together form a comparison sample with a range of rotation velocities similar to the S0s presented here. These comparison data are unfortunately somewhat heterogeneous in nature. The Bottema (1993) kinematic values were derived at one disc scale length; since the velocity dispersion tends to fall with radius while rotation increases, this smaller fiducial radius will tend to produce smaller values of than at our adopted radius of . The comparison is more direct with the data from Herrmann & Ciardullo (2009), as we can interpolate a value at from the kinematic profiles they present. In both cases, we again use the epicycle approximation to interchange between and . Figure 5 shows the resulting estimates of for both the spiral comparison sample and the current sample of S0s. Although there is a reasonable degree of overlap, implying that these S0s could have formed passively from spirals, there are also strong indications that the values are systematically lower for the S0s, which is not the sense one would expect if it arose from the possible bias in the smaller fiducial radii used by Bottema (1993). Thus, if these S0s formed from a random selection of comparable present-day spirals, it would seem that some heating of their discs must have occurred during the transition.
Although the sample becomes small when divided in this way, there is no evidence that the degree of heating of the disc depends on environments, since the S0s from isolated, small group and large group surroundings (as described in Section 1) do not display systematically different values of . We are thus left with a developing picture in which the formation of an S0 from a spiral appears somewhat more violent than a simple shutdown of star formation, but not as extreme as a merger-induced transition, with no indication that the mechanism depends strongly on environment.
4.3 Scaling relations
We can seek further insight into the possible scenario for transformation, and also try to address the question of whether S0s are more closely related to spirals or ellipticals, by looking at where these systems lie on the scaling relations respected by the other galaxy classes.
4.3.1 Tully–Fisher relation
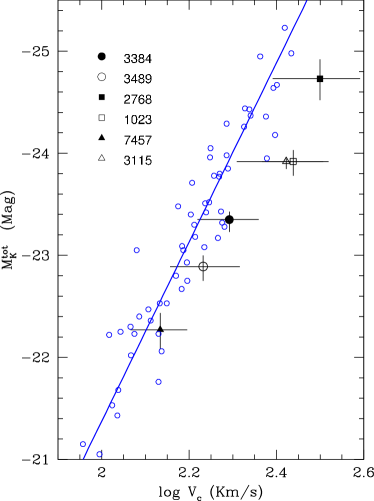
The simplest test we can carry out is to place these S0 galaxies on the Tully–Fisher relation, which displays a very tight correlation between a spiral galaxy’s luminosity and its circular rotation speed (Tully & Fisher, 1977). Such comparisons have previously been carried out by various authors, with somewhat mixed results (Aragón-Salamanca, 2008; Neistein et al., 1999; Williams, Bureau & Cappellari, 2010; Pahre, Djorgovski & de Carvalho, 1998). One reason for the discrepant results is the difficulty in obtaining the circular rotation speed: for the spiral galaxies, this quantity can be reliably estimated from gas kinematics, but for the S0s we are reliant on stellar motions. The previous studies using conventional absorption-line spectroscopy have therefore faced two significant problems. First, unlike PN data, the absorption-line spectra do not typically reach particularly large radii, so probe regions where the rotation curve has not reached its asymptotic value and where the random motions are still large so the somewhat-uncertain asymmetric drift correction is also large (see Section 4.1). Second, as we saw in Section 1, the composite nature of the kinematics in these multi-component systems can significantly affect the inferred rotational properties, and it is only by separating the distinct kinematic components as we have done here that we can expect to get a reliable measure of the disc rotation speed and hence the galaxy’s circular speed. We are therefore in a good position to place S0 galaxies reliably on the Tully–Fisher relation.
The other element we need for these S0 galaxies are measurements of their absolute magnitudes. We carry out this analysis using the -band photometry introduced in Section 2 to minimise the impact of dust obscuration. There is a risk that the relatively shallow 2MASS exposures might miss some of the flux from the outer parts of the galaxy, so we use the magnitudes derived from the full GALFIT models obtained in Section 2 rather than the values quoted in the published 2MASS catalogue; in fact, this effect turns out to be rather small, with an average offset of only 0.05 magnitudes. For NGC 3489, we had to use an SDSS -band image to carry out the GALFIT modeling, so for this galaxy we calculate a total -band magnitude from the model, then use the SDSS/2MASS integrated colours to convert it to a -band magnitude, which implicitly assumes that there are no strong colour gradients in this galaxy.
To convert these values to absolute magnitudes, we use the distance moduli derived from surface brightness fluctuations from Tonry et al. (2001), systematically decreased by mag to take into account the updated Cepheid zero point of Freedman et al. (2001), as discussed in Coccato et al. (2009) and Cortesi et al. (2013). Here, it is important to use a distance scale that has not itself been based on Tully–Fisher or other kinematic scaling relations, to avoid introducing a circularity into the analysis.
Figure 6 shows the resulting Tully–Fisher relation for the S0 galaxies analyzed here, compared to the relation for spiral galaxies (Tully & Pierce, 2000; Rothberg et al., 2000), calibrated to the same absolute magnitude scale. As found previously by Aragón-Salamanca (2008), there is clearly an offset between the S0 and spiral relations, in the sense that the S0s are systematically fainter. This offset fits straightforwardly with a picture in which the S0 galaxies ceased forming stars at some point in the past, leading to a steady fading of their stellar populations. Again, there is no indication of any variation in this offset with environment, suggesting that this is not a driving factor in the timing of the transition, but there does seem to be a trend in the sense that the most massive galaxies display the largest offset; in the context of the time since evolving off the spiral Tully–Fisher relation, this trend can be interpreted as another instance of “downsizing,” in which more massive galaxies go through evolutionary transitions at an earlier stage than less massive galaxies.
4.3.2 Faber–Jackson relation
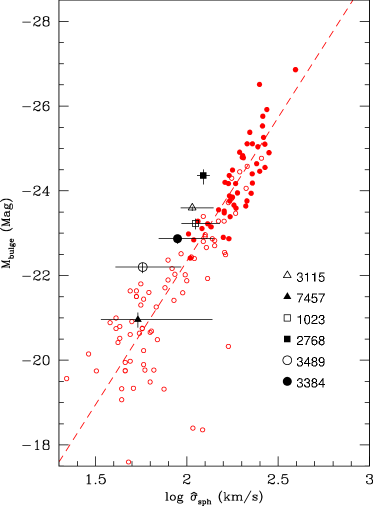
Having separated spheroid and disc components, we are also in a position to look at connections in the other direction along the Hubble sequence to see how closely S0s might be related to elliptical galaxies. For these systems, the equivalent scaling is the Faber–Jackson relation between the spheroidal component velocity dispersion and its absolute magnitude.
Accordingly we have plotted these quantities for the S0 galaxy spheroids in Figure 7, using the spheroid dispersions calculated in Section 4.1, and spheroid absolute magnitudes derived as described above. For comparison, we have also plotted the relation followed by elliptical galaxies as derived by Mobasher et al. (1999). These latter data are based on velocity dispersions measured at an effective radius, away from any central spike in velocity dispersion, so should be directly comparable to the dispersions determined for the S0 spheroids. These elliptical data do not span the full range of magnitudes seen for the S0 spheroids, so we supplement them with kinematic data on fainter early-type galaxies in the Coma Cluster (Matković & Guzmán, 2005) using -band magnitudes from Skrutskie et al. (2006). For these fainter galaxies, the kinematics were derived from fibre spectra, but the large three-arcsecond fibres used will cover most of these small faint galaxies at the distance of Coma, so should again be comparable to the luminosity-weighted average values of derived for the S0 spheroids. To obtain the absolute magnitude for the Coma galaxies, we placed the apparent magnitudes tabulated in Mobasher et al. (1999) and Skrutskie et al. (2006) at a distance modulus of , as also found using surface brightness fluctuations (Thomsen et al., 1997). The fact that the two comparison data sets follow a common relation even though their kinematics were derived with very different radial weightings indicates that the results are unlikely to be sensitive to the exact manner in which the average velocity dispersion is obtained.
The spheroids of the S0s follow a trend similar to the Faber-Jackson relation for ellipticals, although they seem to lie along its upper envelope. One possible explanation for such an offset might be that the influence of the disc surrounding the S0 spheroid might in some way decrease its velocity dispersion. However, simulations by Debattista, Kazantzidis & van den Bosch (2013) show that the formation of a disc around such a spheroidal component would in fact serve to compress it and increase its velocity dispersion, so the presence of a disc does not explain the difference. A simpler explanation is that the offset is along the other axis, due to some enhancement of the spheroid light in S0s when compared to other elliptical systems.

5 Discussion
In this paper, we have analysed the kinematics of a sample of six lenticular galaxies using the planetary nebulae data presented in Cortesi et al. (2013) to determine their dynamical properties out to large radii. This analysis has emphasised the importance of treating the spheroidal and disc components of these systems as distinct entities both photometrically and kinematically, and doing a careful job of separating them. Through this process, the rather heterogeneous properties of S0s over-all start to be resolved into more consistent sub-components, and a reasonably coherent picture begins to emerge.
The common factors we have uncovered are that:
-
1.
The discs of S0 galaxies are comparable to those of spirals, with similar flat rotation curves and falling velocity dispersion profiles, but with a larger amount of random motions.
-
2.
The spheroids of S0 galaxies show flat dispersion profiles, similar to what is found in some ellipticals.
-
3.
S0 galaxies follow the Tully–Fisher relation, but offset to fainter magnitudes than spiral galaxies, with a greater offset for more massive galaxies.
-
4.
S0 galaxy spheroids follow the Faber–Jackson relation, somewhat offset to brighter magnitudes than elliptical galaxies.
-
5.
There is no strong evidence that any of these effects depend on the current environment of the galaxy.
The Tully–Fisher and Faber–Jackson findings are summarised in Figure 8, which shows the offset from each relation for the S0 sample. In the absence of any systematic effect, we would expect these points to appear equally in all four quadrants, but in fact they appear strongly clustered in the region of the plot where the spheroids are too bright but the overall galaxies are too faint.
With this level of detail starting to become available, we can begin to sketch out a plausible evolutionary sequence leading to the formation of S0 galaxies. If these systems began their lives as spiral galaxies, at some point they underwent a transition that removed their gas supply and hence cut off star formation. The process responsible does not depend strongly on current environment, but does seem to have acted earlier on more massive galaxies as another example of downsizing. The hotter discs of S0s could indicate that their high-redshift spiral progenitors had less ordered discs (Kassin et al., 2012), and that this larger amount of random motion became locked in when star formation ceased. However, if the transformation occurred at a point when these systems had settled down to today’s cold spiral systems, the hotter discs would then indicate that the galaxies had undergone a process sufficiently disruptive to heat the system significantly, but less violent than a merger.
This aggressive process might well also dump some fraction of the gas being stripped from the disc into the centre of the galaxy, causing a last burst of turbulent star formation there, enhancing the spheroid’s luminosity significantly, shifting it off the Faber–Jackson relation. Such a scenario would also fit with the recent finding that the spheroids of S0 galaxies have systematically younger stellar populations than their discs (Johnston et al., 2012).
Of the various mechanisms advanced for causing galaxy transformation, perhaps the most plausible to realize such a scenario is a form of the “harassment” invoked by Moore et al. (1996) as a process for transforming galaxies in clusters. In their paper, they demonstrated that this process of repeated high-speed encounters could strip gas from a galaxy while dumping some at the centre of the system under transformation as we require here. However, we also know that the process needs to be somewhat gentler than they modelled because we need to preserve the disc structure of the galaxy with only a fairly modest amount of heating. It remains to be seen whether such mild harassment, perhaps better thought of as “pestering,” could be made to work across the range of environments in which S0s are found, but we do at least now have a growing number of observational constraints against which any such model can be tested.
Acknowledgements
AC acknowledges the support from both ESO (during her studentship in 2011 and the visitor program in 2012) and MPE (visitor program 2012). LC acknowledges funding from the European Community Seventh Framework Programme (FP7/2007-2013/) under grant agreement No 229517. AJR was supported by National Science Foundation grant AST-0909237. We thank the referee for the supportive and constructive report. The PN.S team thanks both the UK and NL time allocation committees and the staff of the WHT for their strong support in acquiring the data used in this research. This research has also made use of the 2MASS data archive, the NASA/IPAC Extragalactic Database (NED), and of the ESO Science Archive Facility, for which we are grateful.
References
- Aragón-Salamanca (2008) Aragón-Salamanca A., 2008. Stellar populations in the bulges of S0s and the formation of S0 galaxies, In: IAU Symposium, p. 285, ed. M. Bureau, E. Athanassoula, & B. Barbuy.
- Binney & Tremaine (1987) Binney J., Tremaine S., 1987. Galactic dynamics.
- Bottema (1993) Bottema R., 1993. A&A, 275, 16. The Stellar Kinematics of Galactic Disks.
- Bournaud, Jog & Combes (2005) Bournaud F., Jog C. J., Combes F., 2005. A&A, 437, 69. Galaxy mergers with various mass ratios: Properties of remnants.
- Caon, Macchetto & Pastoriza (2000) Caon N., Macchetto D., Pastoriza M., 2000. ApJS, 127, 39. A Survey of the Interstellar Medium in Early-Type Galaxies. III. Stellar and Gas Kinematics.
- Cappellari (2008) Cappellari M., 2008. MNRAS, 390, 71. Measuring the inclination and mass-to-light ratio of axisymmetric galaxies via anisotropic Jeans models of stellar kinematics.
- Coccato et al. (2009) Coccato L., Gerhard O., Arnaboldi M., Das P., Douglas N. G., Kuijken K., Merrifield M. R., Napolitano N. R., Noordermeer E., Romanowsky A. J., Capaccioli M., Cortesi A., de Lorenzi F., Freeman K. C., 2009. MNRAS, 394, 1249. Kinematic properties of early-type galaxy haloes using planetary nebulae.
- Cortesi et al. (2011) Cortesi A., Merrifield M. R., Arnaboldi M., Gerhard O., Martinez-Valpuesta I., Saha K., Coccato L., Bamford S., Napolitano N. R., Das P., Douglas N. G., Romanowsky A. J., Kuijken K., Capaccioli M., Freeman K. C., 2011. MNRAS, 414, 642. Unravelling the origins of S0 galaxies using maximum likelihood analysis of planetary nebulae kinematics.
- Cortesi et al. (2013) Cortesi A., Arnaboldi M., Coccato L., Merrifield M. R., Gerhard O., Bamford S., Romanowsky A. J., Napolitano N. R., Douglas N. G., Kuijken K., Capaccioli M., Freeman K. C., Chies-Santos A. L., Pota V., 2013. A&A, 549, A115. The Planetary Nebula Spectrograph survey of S0 galaxy kinematics. Data and overview.
- Davis et al. (2011) Davis T. A., Bureau M., Young L. M., Alatalo K., Blitz L., Cappellari M., Scott N., Bois M., Bournaud F., Davies R. L., de Zeeuw P. T., Emsellem E., Khochfar S., Krajnović D., Kuntschner H., Lablanche P.-Y., McDermid R. M., Morganti R., Naab T., Oosterloo T., Sarzi M., Serra P., Weijmans A.-M., 2011. MNRAS, 414, 968. The ATLAS3D project - V. The CO Tully-Fisher relation of early-type galaxies.
- Debattista, Corsini & Aguerri (2002) Debattista V. P., Corsini E. M., Aguerri J. A. L., 2002. MNRAS, 332, 65. A fast bar in the post-interaction galaxy NGC 1023.
- Debattista, Kazantzidis & van den Bosch (2013) Debattista V. P., Kazantzidis S., van den Bosch F. C., 2013. ArXiv e-prints. Disk Assembly and the M_BH-sigma Relation of Supermassive Black Holes.
- Emsellem et al. (2007) Emsellem E., Cappellari M., Krajnović D., van de Ven G., Bacon R., Bureau M., Davies R. L., de Zeeuw P. T., Falcón-Barroso J., Kuntschner H., McDermid R., Peletier R. F., Sarzi M., 2007. MNRAS, 379, 401. The SAURON project - IX. A kinematic classification for early-type galaxies.
- Fabricius et al. (2012) Fabricius M. H., Saglia R. P., Fisher D. B., Drory N., Bender R., Hopp U., 2012. ApJ, 754, 67. Kinematic Signatures of Bulges Correlate with Bulge Morphologies and Sérsic Index.
- Forbes et al. (2012) Forbes D. A., Cortesi A., Pota V., Foster C., Romanowsky A. J., Merrifield M. R., Brodie J. P., Strader J., Coccato L., Napolitano N., 2012. ArXiv e-prints. Radially Extended Kinematics in the S0 Galaxy NGC 2768 from Planetary Nebulae, Globular Clusters and Starlight.
- Freedman et al. (2001) Freedman W. L., Madore B. F., Gibson B. K., Ferrarese L., Kelson D. D., Sakai S., Mould J. R., Kennicutt, Jr. R. C., Ford H. C., Graham J. A., Huchra J. P., Hughes S. M. G., Illingworth G. D., Macri L. M., Stetson P. B., 2001. ApJ, 553, 47. Final Results from the Hubble Space Telescope Key Project to Measure the Hubble Constant.
- Herrmann & Ciardullo (2009) Herrmann K. A., Ciardullo R., 2009. ApJ, 705, 1686. Planetary Nebulae in Face-On Spiral Galaxies. III. Planetary Nebula Kinematics and Disk Mass.
- Johnston et al. (2012) Johnston E. J., Aragón-Salamanca A., Merrifield M. R., Bedregal A. G., 2012. MNRAS, 422, 2590. Spectroscopic bulge-disc decomposition: a new method to study the evolution of lenticular galaxies.
- Kassin et al. (2012) Kassin S. A., Weiner B. J., Faber S. M., Gardner J. P., Willmer C. N. A., Coil A. L., Cooper M. C., Devriendt J., Dutton A. A., Guhathakurta P., Koo D. C., Metevier A. J., Noeske K. G., Primack J. R., 2012. ApJ, 758, 106. The Epoch of Disk Settling: z ~ 1 to Now.
- Kormendy & Bender (2012) Kormendy J., Bender R., 2012. ApJS, 198, 2. A Revised Parallel-sequence Morphological Classification of Galaxies: Structure and Formation of S0 and Spheroidal Galaxies.
- MacArthur, González & Courteau (2009) MacArthur L. A., González J. J., Courteau S., 2009. MNRAS, 395, 28. Stellar population and kinematic profiles in spiral bulges and discs: population synthesis of integrated spectra.
- Matković & Guzmán (2005) Matković A., Guzmán R., 2005. MNRAS, 362, 289. Kinematic properties and stellar populations of faint early-type galaxies - I. Velocity dispersion measurements of central Coma galaxies.
- Mobasher et al. (1999) Mobasher B., Guzman R., Aragon-Salamanca A., Zepf S., 1999. MNRAS, 304, 225. The near-infrared Fundamental Plane of elliptical galaxies.
- Moore et al. (1996) Moore B., Katz N., Lake G., Dressler A., Oemler A., 1996. Nature, 379, 613. Galaxy harassment and the evolution of clusters of galaxies.
- Neistein et al. (1999) Neistein E., Maoz D., Rix H.-W., Tonry J. L., 1999. AJ, 117, 2666. A Tully-Fisher Relation for S0 Galaxies.
- Noordermeer et al. (2008) Noordermeer E., Merrifield M. R., Coccato L., Arnaboldi M., Capaccioli M., Douglas N. G., Freeman K. C., Gerhard O., Kuijken K., de Lorenzi F., Napolitano N. R., Romanowsky A. J., 2008. MNRAS, 384, 943. Testing the nature of S0 galaxies using planetary nebula kinematics in NGC 1023.
- Norris, Sharples & Kuntschner (2006) Norris M. A., Sharples R. M., Kuntschner H., 2006. MNRAS, 367, 815. GMOS spectroscopy of the S0 galaxy NGC 3115.
- Pahre, Djorgovski & de Carvalho (1998) Pahre M. A., Djorgovski S. G., de Carvalho R. R., 1998. AJ, 116, 1591. Near-Infrared Imaging of Early-Type Galaxies. III. The Near-Infrared Fundamental Plane.
- Peng et al. (2002) Peng C. Y., Ho L. C., Impey C. D., Rix H.-W., 2002. AJ, 124, 266. Detailed Structural Decomposition of Galaxy Images.
- Rothberg et al. (2000) Rothberg B., Saunders W., Tully R. B., Witchalls P. L., 2000. ApJ, 533, 781. The Correlation between Galaxy H I Line Widths and K’Luminosities.
- Simien & Prugniel (1997) Simien F., Prugniel P., 1997. A&AS, 126, 519. Kinematical data on early-type galaxies. III.
- Skrutskie et al. (2006) Skrutskie M. F., Cutri R. M., Stiening R., Weinberg M. D., Schneider S., Carpenter J. M., Beichman C., Capps R., Chester T., Elias J., Huchra J., Liebert J., Lonsdale C., Monet D. G., Price S., Seitzer P., Jarrett T., Kirkpatrick J. D., Gizis J. E., Howard E., Evans T., Fowler J., Fullmer L., Hurt R., Light R., Kopan E. L., Marsh K. A., McCallon H. L., Tam R., Van Dyk S., Wheelock S., 2006. AJ, 131, 1163. The Two Micron All Sky Survey (2MASS).
- Thomsen et al. (1997) Thomsen B., Baum W. A., Hammergren M., Worthey G., 1997. ApJ, 483, L37. The Distance to the Coma Cluster from Surface Brightness Fluctuations.
- Tonry et al. (2001) Tonry J. L., Dressler A., Blakeslee J. P., Ajhar E. A., Fletcher A. B., Luppino G. A., Metzger M. R., Moore C. B., 2001. ApJ, 546, 681. The SBF Survey of Galaxy Distances. IV. SBF Magnitudes, Colors, and Distances.
- Tully & Fisher (1977) Tully R. B., Fisher J. R., 1977. A&A, 54, 661. A new method of determining distances to galaxies.
- Tully & Pierce (2000) Tully R. B., Pierce M. J., 2000. ApJ, 533, 744. Distances to Galaxies from the Correlation between Luminosities and Line Widths. III. Cluster Template and Global Measurement of H0.
- Williams, Bureau & Cappellari (2010) Williams M. J., Bureau M., Cappellari M., 2010. MNRAS, 409, 1330. The Tully-Fisher relations of early-type spiral and S0 galaxies.