To appear in proceeding of WebSci’13, May 1 – 5, 2013, Paris, France.
Petition Growth and Success Rates
on the UK No. 10 Downing Street Website
Abstract
Now that so much of collective action takes place online, web-generated data can further understanding of the mechanics of Internet-based mobilisation. This trace data offers social science researchers the potential for new forms of analysis, using real-time transactional data based on entire populations, rather than sample-based surveys of what people think they did or might do. This paper uses a ‘big data’ approach to track the growth of over 8,000 petitions to the UK Government on the No. 10 Downing Street website for two years, analysing the rate of growth per day and testing the hypothesis that the distribution of daily change will be leptokurtic (rather than normal) as previous research on agenda setting would suggest. This hypothesis is confirmed, suggesting that Internet-based mobilisation is characterized by tipping points (or punctuated equilibria) and explaining some of the volatility in online collective action. We find also that most successful petitions grow quickly and that the number of signatures a petition receives on its first day is a significant factor in explaining the overall number of signatures a petition receives during its lifetime. These findings have implications for the strategies of those initiating petitions and the design of web sites with the aim of maximising citizen engagement with policy issues.
keywords:
petition; mobilization; trace data; big data; leptokurtic; bursty growthcategory:
H.5.3 Information Interfaces and Presentation (e.g., HCI) Group and Organization Interfaceskeywords:
Computer-supported cooperative workcategory:
H.5.3 Information Interfaces and Presentation (e.g., HCI) Group and Organization Interfaceskeywords:
Web-based interactioncategory:
K.4.0 Computers and Society General1 Introduction
Increasingly collective action is occurring online; most mobilisations include an online element and some take place almost wholly online. All this web-based activity leaves a digital footprint, which allows researchers to generate real-time transactional data of political behaviour. This kind of data represents a shift for social science research, with a move away from sample-based survey data about what people think they did or will do, to transactional data about what people actually did based on whole populations [15, 8]. Yet the mechanics of online collective action—and the extent to which the rise of the phenomenon challenges existing theories and understanding of collective action behaviour and leads to new models of contemporary political behaviour—remain under–analysed. We are still at the start of exploiting the great potential of ‘big data’ to understand the mechanics of online collective action.
This paper analyses a ‘big data’ set of all online petitions submitted to No. 10 Downing Street website from February 2009 to March 2011 (a screenshot of the webpage is shown in Figure 1). The petitions site was first launched in November 2006, and over the course of its lifetime it received more than 8 million signatures from over 5 million unique email addresses.111http://www.mysociety.org/projects/no10-petitions-website/ While live, the site allowed anyone to view petitions, and any user with a valid email address could create a new petition or sign an existing petition. The government promised an official response to all petitions receiving at least 500 signatures, providing an internal definition for the ‘success’ of a petition. This paper analyses the growth of petitions and the distinctive characteristics of the mobilisation curves of successful and unsuccessful petitions. First, we provide some background on online collective action in general and e-petitions in particular. We use previous work on collective action and political attention to develop a hypothesis regarding the development of online mobilisations: that they will be characterised by long periods of stasis and short periods of rapid change, leading to a leptokurtic distribution of daily change. Second, we outline the methods used to test this hypothesis and third, provide the results, followed by a discussion of the policy and design implications of the findings.

2 Background
The 21st century has seen a rise in mobilisation, from the dramatic events in authoritarian states of the Arab Spring, to a series of protests, demonstrations and social backlash against austerity driven cutbacks and state retrenchment in liberal democracies facing the consequences of the financial crash of 2008. The web is implicated—to a larger or lesser extent—in virtually all these events. Researchers have turned their attention to the theoretical and conceptual implications of online collective action (e.g. [5, 16]) and some are using innovative methods, including experiments and data-mining, to explore the spread of mobilisations across online social networks (see, for example, [1, 9, 12, 11, 4, 2]).
While online activity may be a minor element of some mobilisations, other mobilisations occur almost entirely online. The trend for ‘e-petitioning’ represents one such activity, where online petitions are created, disseminated, circulated, and presented online, and although policy-makers may discuss responses in offline contexts, such responses are generated and sent online. The UK government’s e-petition site was created on the No. 10 Downing Street website in November 2006 and ran until March 2011, when it was closed by the incoming Coalition government. Some of these petitions had high policy impact, notably one against the Labour administration’s proposed road pricing policy, which policy-makers admitted off the record played a role in getting the policy scrapped. A new site was later launched in July 2011 on the direct.gov portal with a different format. Signing petitions has long been among the more popular political activities, leading the field for participatory acts outside voting and with other social benefits ascribed to it as well as having the potential to bring about policy change; e-petitioning reinforces ‘civic mindedness’ [21].
E-petitions are interesting examples of mobilisations with a strong online imprint, which will include the entire transaction history for both successful and unsuccessful mobilisations. The data generated from the signing of electronic petitions is an example of what is now commonly known as ‘big data’, representing a transactional audit trail of what people actually did (as opposed to what people think they did) and an entire population (without the need to take a representative sample). Data like this represents a big shift for social science research into political behaviour, which has traditionally rested on survey data, or, for elections, voting data. Big data also presents challenges to social science research—it doesn’t come with handy demographics attached and we do not know where people came from to any one interaction, nor where they are going, so it is often difficult to match up online activities across different platforms, or to identify the underlying factors influencing behaviour, such as age, income or gender. This data however, makes it possible to look at the different patterns of growth in the 8,000 mobilisation curves that we have and identify the distinctive characteristic of those mobilisations that succeed and those that fail with our digital hindsight. Such an analysis may tell us something about the nature of collective action itself in a digital world.
So what would we hypothesise about these mobilisations? A possible hypothesis may be derived from previous research on agenda setting in political systems. The most well known model of how policy attention proceeds in a liberal democracy is that of ‘punctuated equilibrium’, developed by the US authors Baumgartner and Jones and their ‘Policy Agendas’ programme of research (see www.policyagendas.org). The theory argues that policy attention to any issue will remain in long periods of stasis where little change occurs. Where issues do hit the policy agenda, it will be because some event has ‘punctuated’ the equilibria, all eyes (including the media, public opinion, interest groups and politicians concerned) turn to the issue, money is spent, institutions are created and policy change occurs [13, 3, 14]. The theory of punctuated equilibria is multi-faceted and has been illustrated by a range of empirical data across policy areas and within different dimensions of attention, such as public opinion, budgetary change and congressional attention [14] and in various countries, including the UK [13]. Baumgartner and Jones do not discuss Internet-related activity to any great degree; however, we might hypothesise that the pattern of mobilisations around a petition would proceed in a similar way, thereby contributing to the same sort of issue attention cycle that has been observed many times over in agenda setting research. Such a model would predict that the distribution of daily changes in attention would be ‘leptokurtic’. Kurtosis is a measure of the “peakedness” of a distribution, and a distribution with positive excess kurtosis is said to be leptokurtic. Such distributions have an acute, slender peak around the mean and fatter tails. For the distribution of change in petitions data, this would correspond to a large amount of very little change (around the mean) with some punctuations of large change forming the tail of the distribution.
Such a finding could not show any causal effect, as only the activity of petitioners is being analysed here (and tipping points could suggest a media effect, although the authors are not aware of any petition having media coverage prior to having amassed a substantive amount of signatures). It could, however, point towards a role for online mobilisation in policy change analogous to that of the media in the agenda setting analysis, which is ascribed a lurching effect, due to the capacity of the media to parallel process only a small number of issues; at the point at which a punctuation occurs, media attention will ‘tip over’ from specialist outlets into the mainstream media. In addition, in lower level mobilisations where the media is not paying attention, such a finding could suggest a role in policy issues below the media radar.
3 Methods
The UK Government’s petition website was accessed daily from 2 February 2009 until March 2011, when the site closed, with an automated script. Each day, the number of overall signatures to date on each active petition was recorded. In addition, the name of the petition, the text of the petition, the launch date of the petition, and the category of the petition were recorded. Overall, 8,326 unique petitions were tracked, representing all publicly available petitions active at any point during the study.
Petitions on the Number 10 website closed, by default, 12 months after they first launched. To identify patterns in how petitions grow, the percentage change in new signatures was calculated each day. Most petitions had a long period of inactivity prior to their deadline date. To consider just how petitions grow, data was truncated after the last signature on a petition, removing any final period of zero signature-per-day growth prior to the petition’s deadline.
Leptokurtic distributions have a more acute peak close to the mean and larger tails. There is no statistical test to specifically classify a distribution as leptokurtic. However, several tests in combination help demonstrate a distribution is leptokurtic (see [13]). The most rigorous test is the Shapiro-Wilk test [20], which checks whether the points could possibly be drawn randomly from a normal distribution. Leptokurtic distributions should reject the Shapiro-Wilk null hypothesis of normality. The Kolmogorov-Smirnov test tests that a set of frequencies is normal distributed by focusing on the skewedness and kurtosis of a distribution [7, pp. 392–4], and this null hypothesis should be rejected if a distribution is leptokurtic and hence non-normal. Visualizing the histogram and the quantile–quantile plot give further evidence of a leptokurtic distribution.
4 Results
The webcrawler collected all available petitions during the collection period, resulting in a set of 8,326 unique petitions. In Figure 2, a Zipfian diagram shows the number of signatures at the end of data collection period vs rank of the petition according to the number of signatures. This demonstrates that most of the petitions receive only a few signatures, and only a few petitions (6 per cent) make it beyond the 500-signature threshold. The slop of the Zipf’s law changes around the point of 500 signatures, indicating that the signatories are less eager to increase the number of signatures after meeting the number required for an official government response.
Nearly all of the 534 petitions that succeeded in obtaining 500 or more signatures did so quickly (Figure 3). Successful petitions took a mean time of 8.4 days to reach 500 signatures, but a median time of only two days. In fact, 230 of the 534 successful petitions succeeded in obtaining 500 signatures on the day they were launched (day 1). Only a few petitions take a much longer time to reach the 500 signature mark: 31 petitions (6 per cent) succeed after taking more than 30 days, and only five successful petitions in our dataset required more than four months to reach the 500 signature mark.
Histograms of the logarithm of the number of signatures for petitions at different ages are shown in Figure 4. A fat-tailed distribution emerges at the very start of the petitions, and as times passes only the lower bound of the distribution shifts slightly to larger numbers. The long-term dynamic of petition growth is seen to have many small changes and a few very large changes.
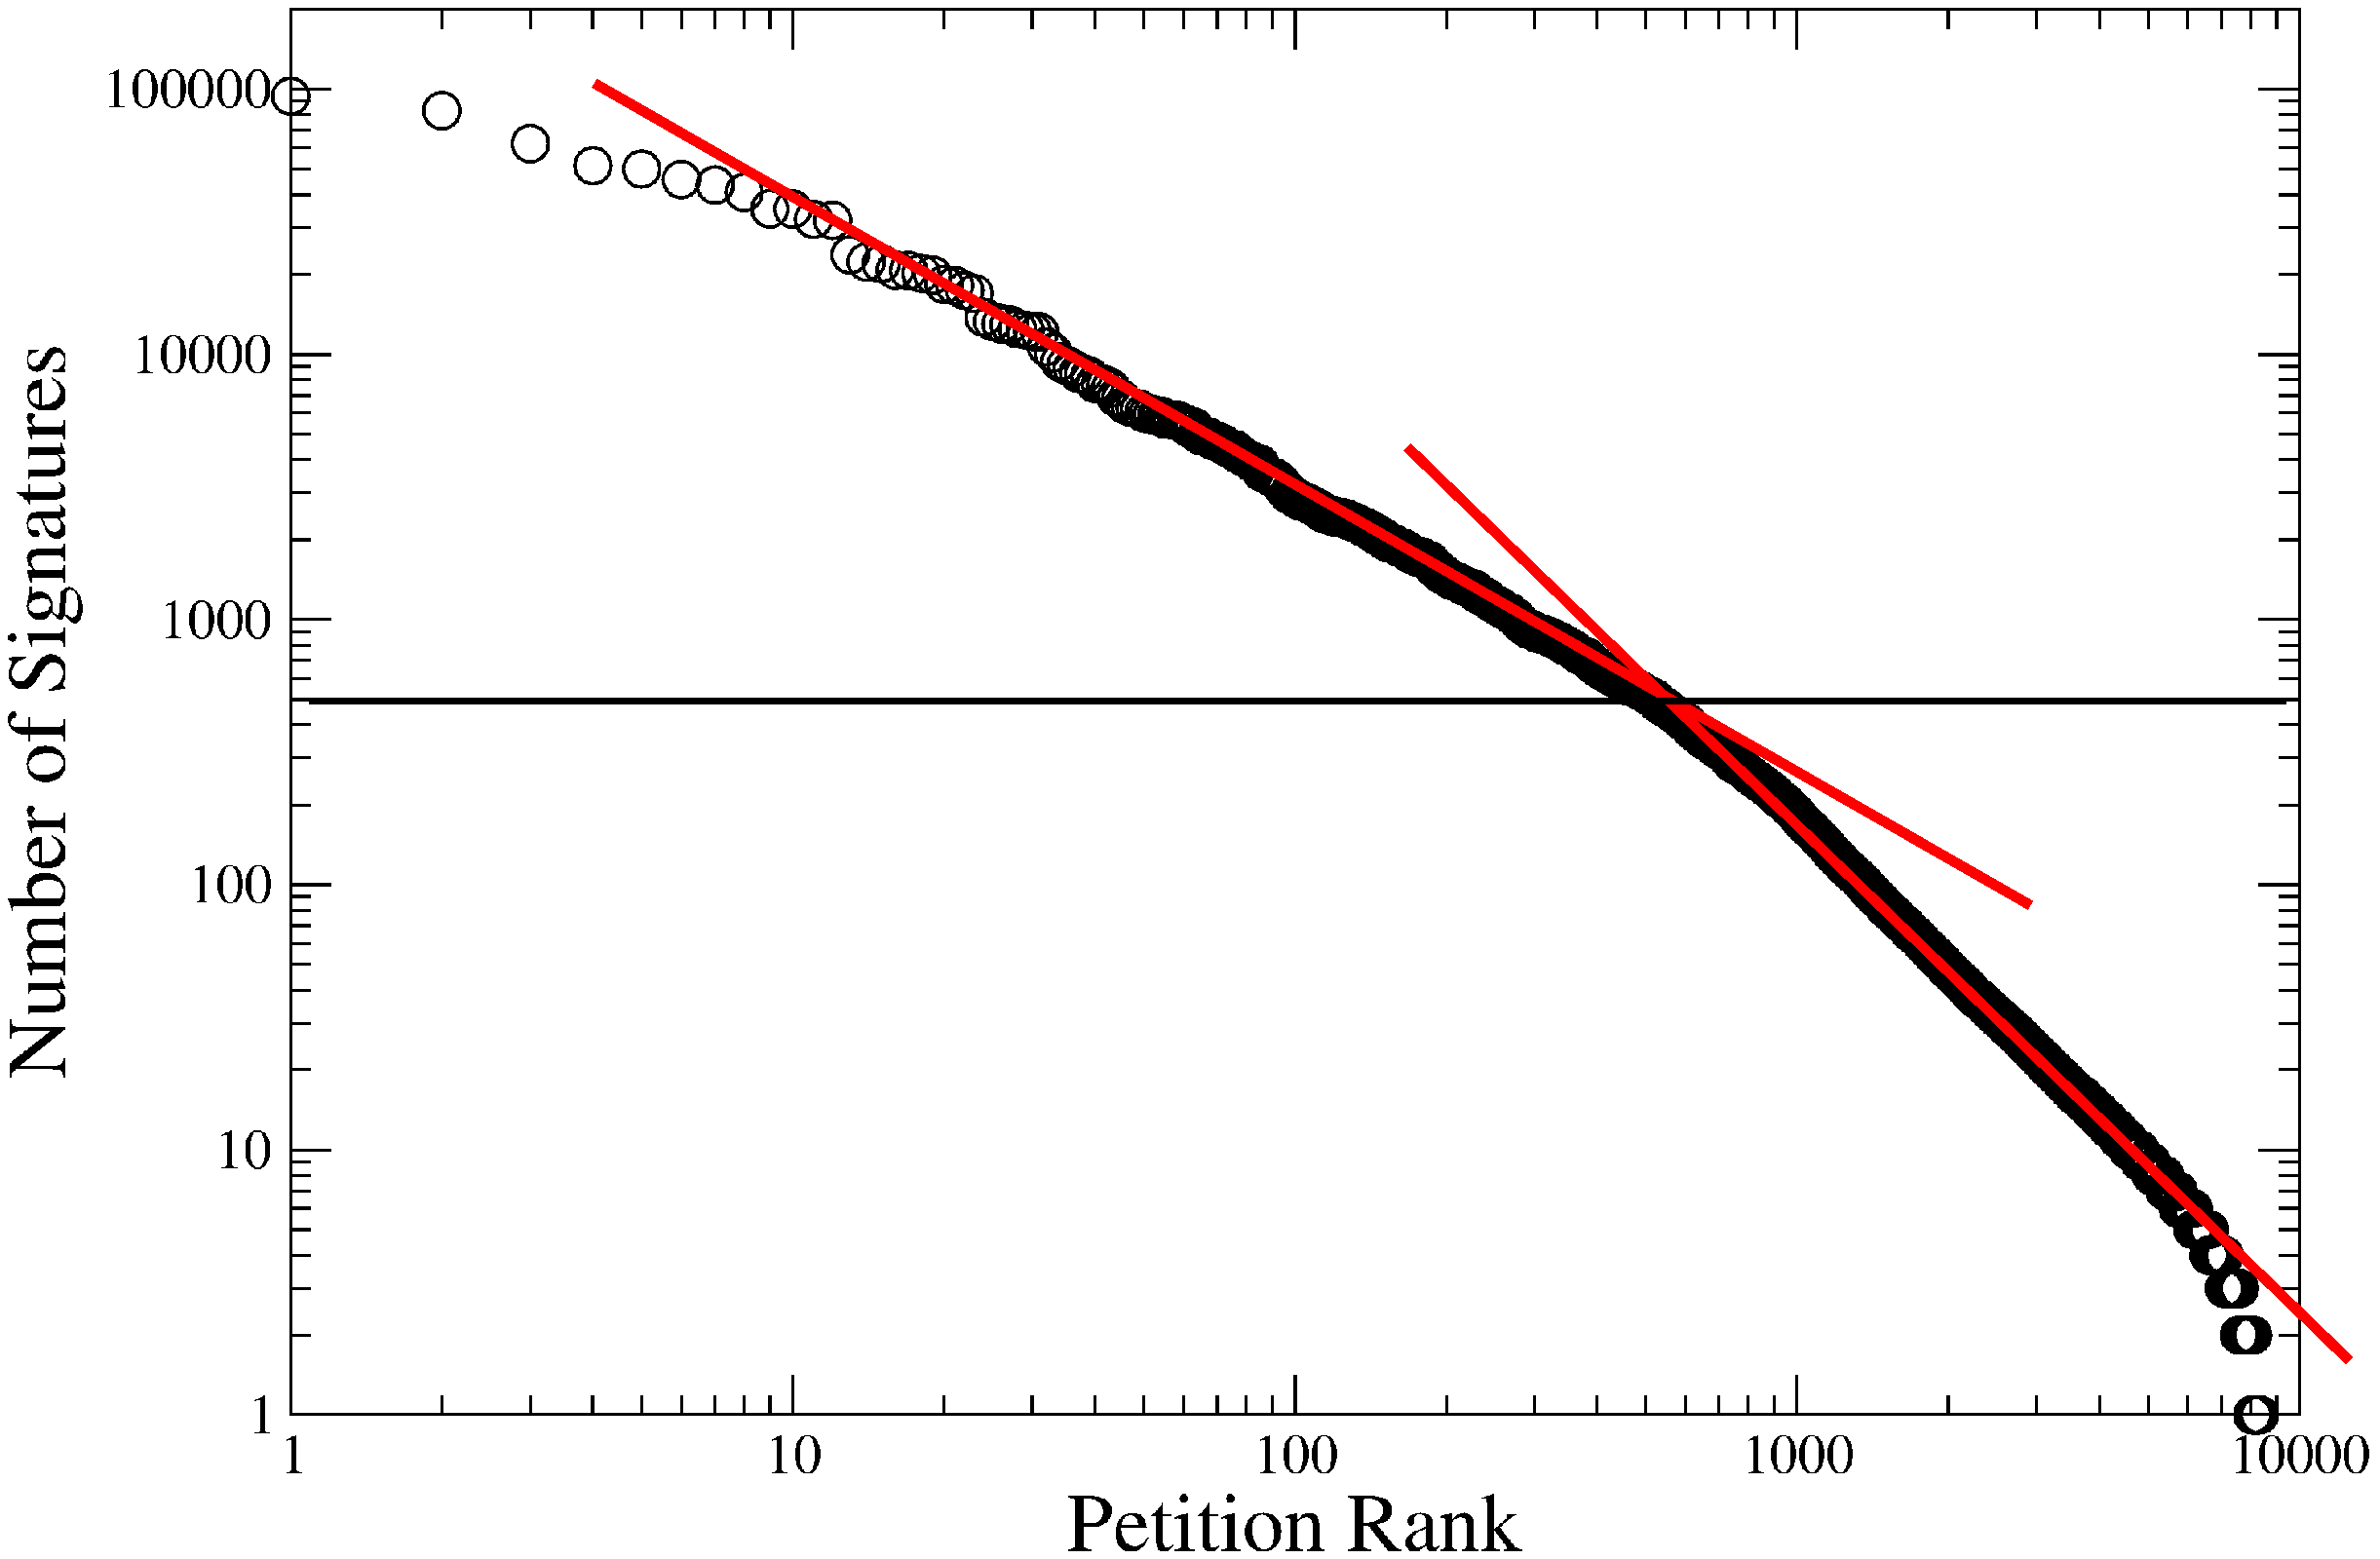
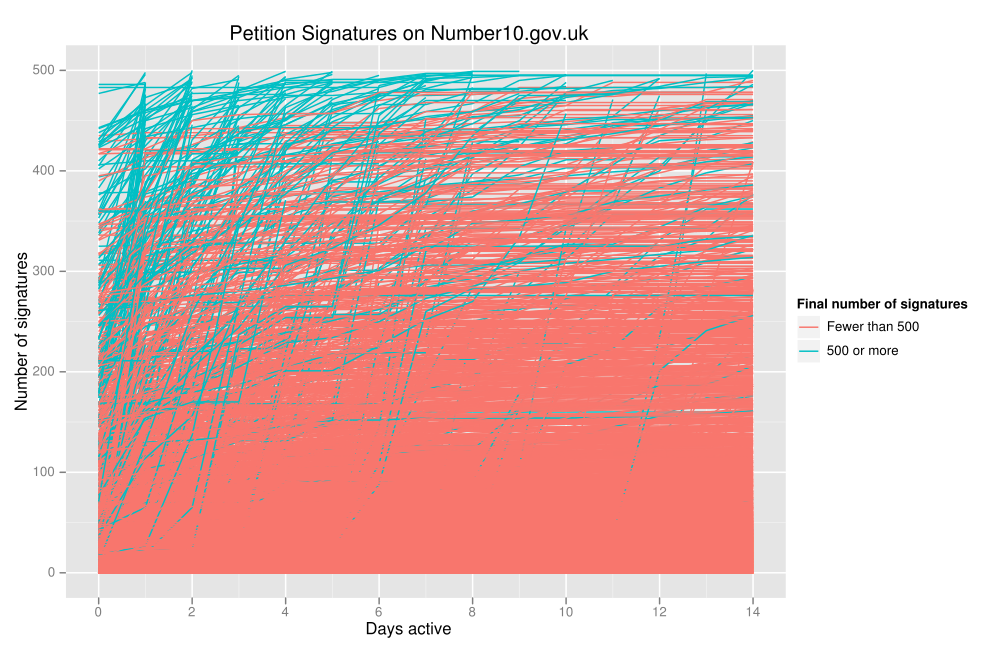
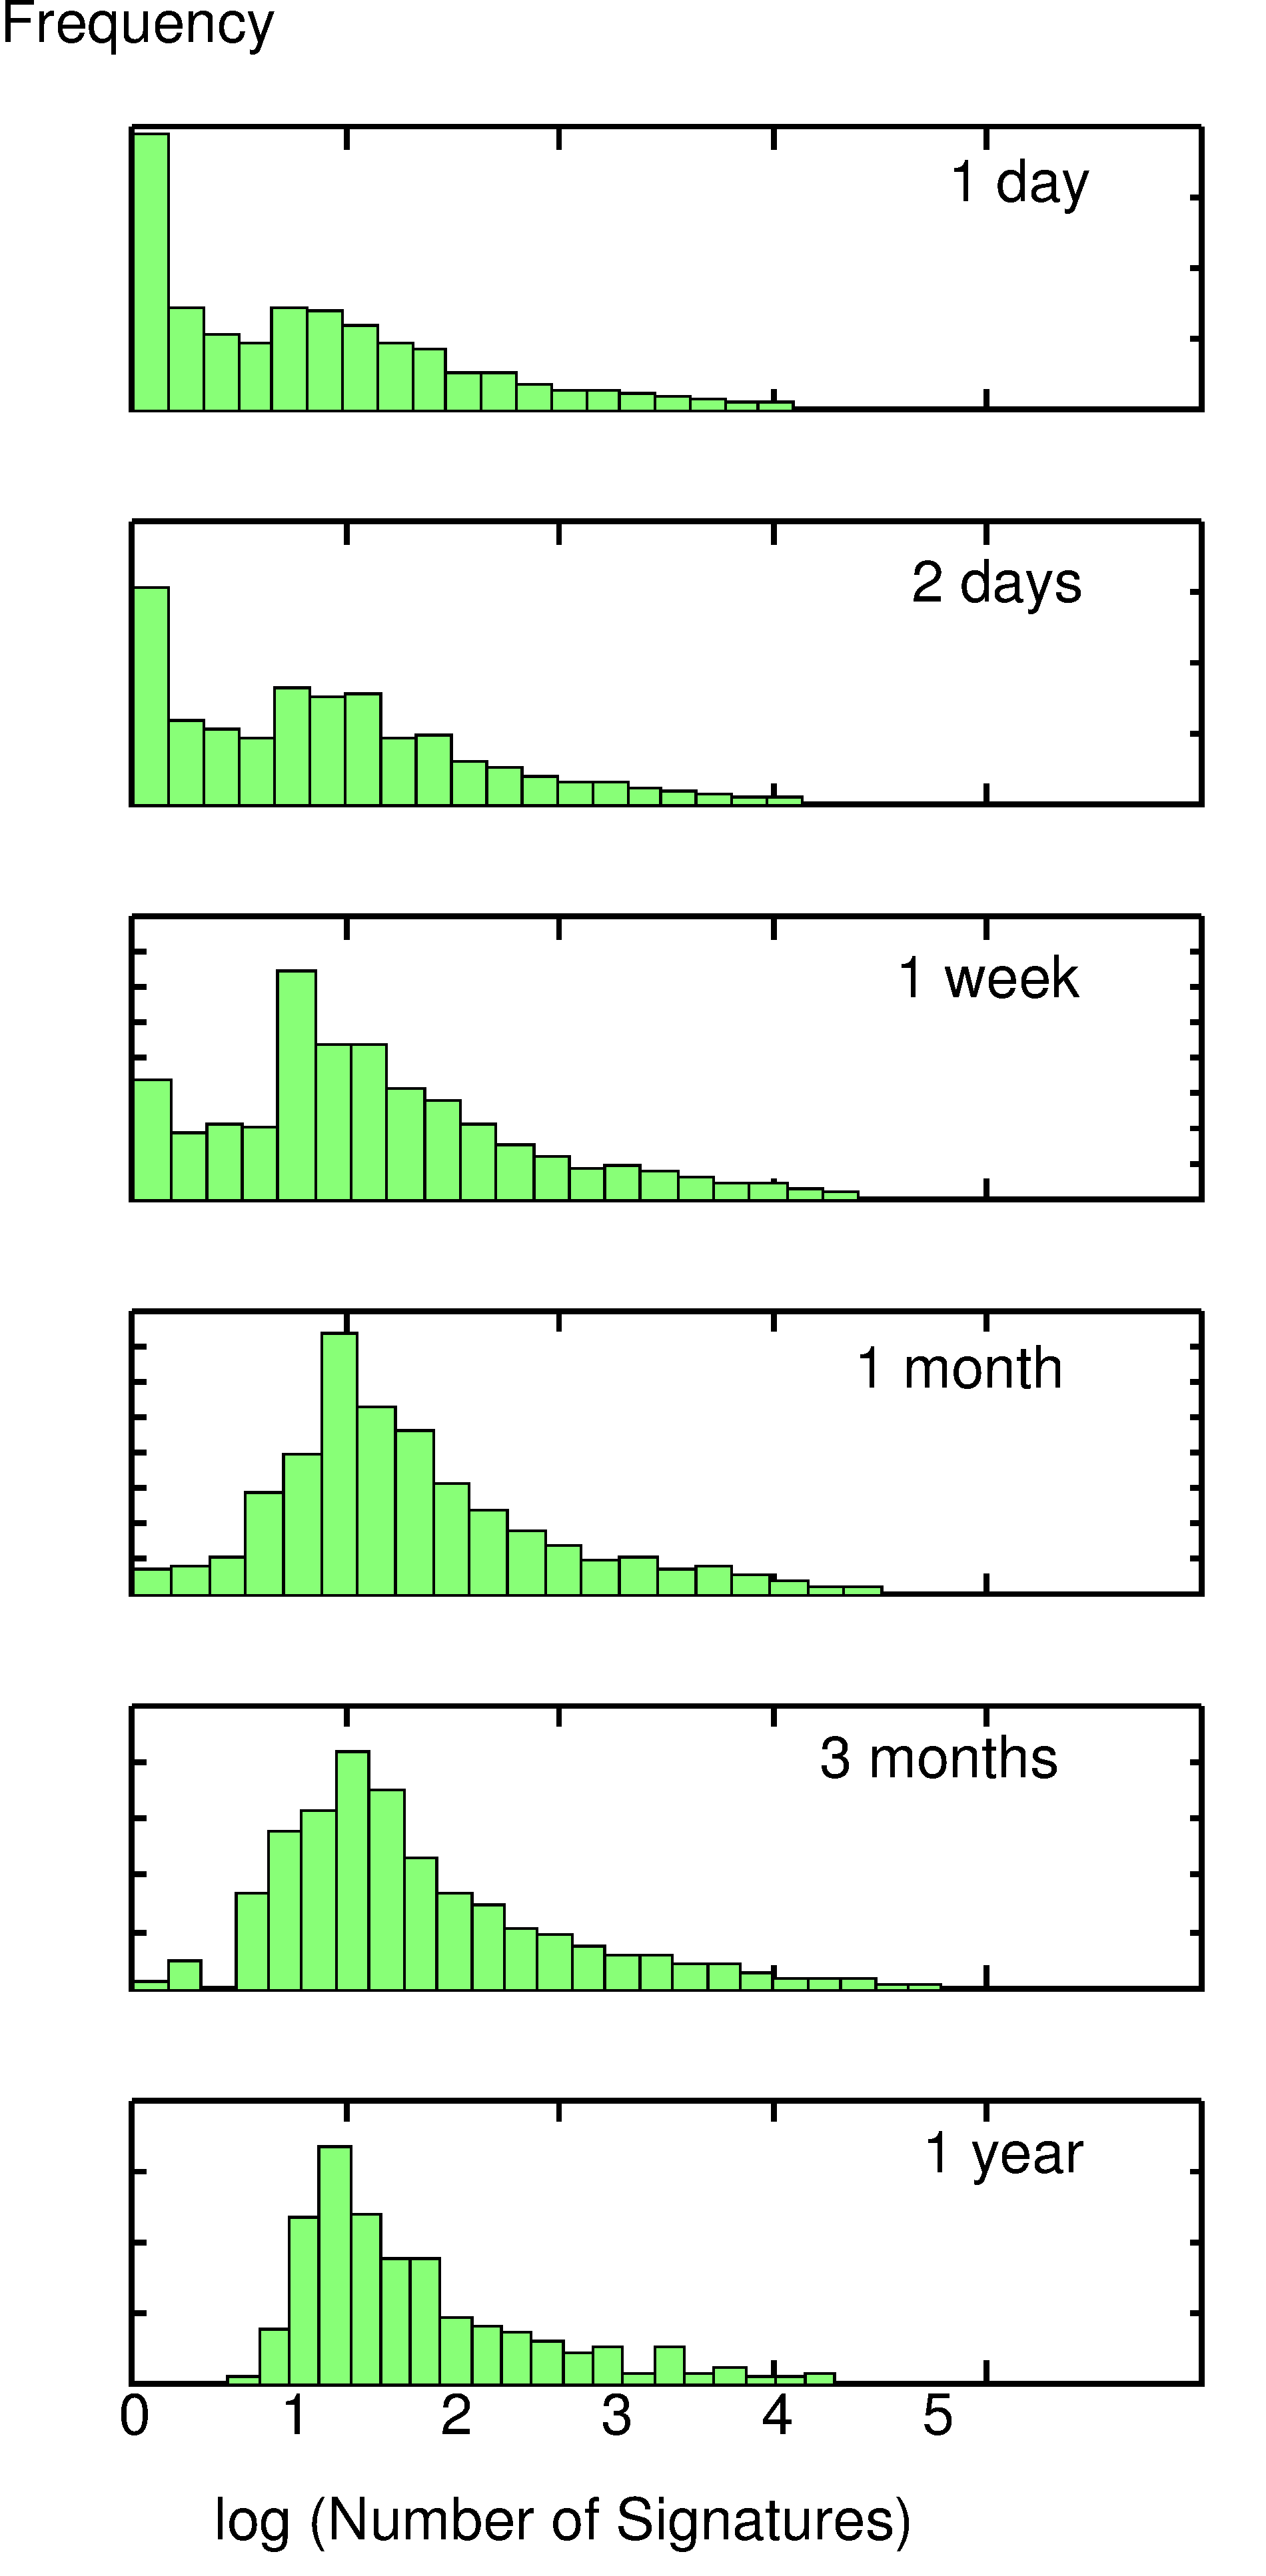
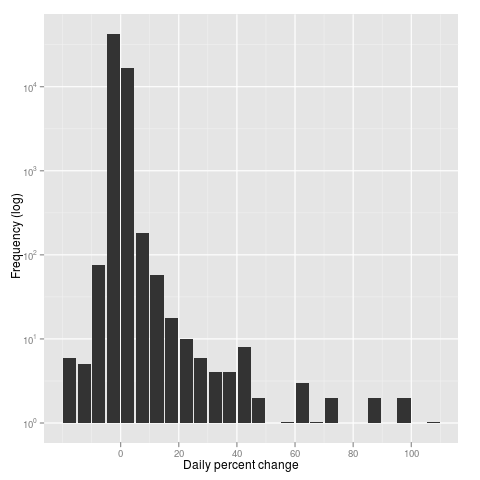
Figure 5 shows the percentage change in new signatures adjusted so that the mean growth of each petition lies at zero. While most daily change is small, petitions’ growth is punctuated by a few large changes. The distribution of growth is leptokurtic and strongly rejects the Shapiro-Wilk null hypothesis of normality with a statistic of 0.17 translating to a p-value less than 0.000001. The distribution has a kurtosis score of 1,445 and a skewedness of 30.53, and rejects the Kolmogorov-Smirnov test for a normal distribution (). When we applied the same tests to the population of petitions that were successful in achieving 500 signatures (that is, excluding the unsuccessful ones), we found a similar leptokurtic distribution (Shapiro-Wilk statistic of 0.10, ).
The number of signatures a petition received on its first day has a significant, positive association to the log of the number of signatures the petition receives in total during its lifetime (Table 1). In addition, the number of other petitions started on the same day has a positive and significant regression coefficient. The day of the week the petition launched on along with a simple weekend vs weekday launch distinction (not shown) were not significant. Certain categories of petitions were, however, associated with a greater or smaller number of signatures. In particular, petitions in the Health, well-being and care category along with those in Environment category received significantly more signatures, while petitions in the Government, politics and public administration category received significantly fewer signatures. Both the Health and Environment categories are also significant in a regression on the log of total signatures only including petitions receiving less than 500 signatures. Overall, petitions tended to grow shortly after launch and then stop growing. This active period of growth for petitions had a mean length of 57 days and a median length of 27 days.
| Estimate | Std. Error | t value | Pr(t) | ||
|---|---|---|---|---|---|
| (Intercept) | 3.1253 | 0.0896 | 34.89 | 0.0000 | |
| cat: Economics and finance | -0.3360 | 0.0960 | -3.50 | 0.0005 | ** |
| cat: Education and skills | 0.0775 | 0.0984 | 0.79 | 0.4306 | |
| cat: Employment, jobs and careers | -0.2278 | 0.1067 | -2.14 | 0.0328 | * |
| cat: Environment | 0.2603 | 0.0984 | 2.65 | 0.0082 | ** |
| cat: Government, politics and public administration | -0.2444 | 0.0895 | -2.73 | 0.0063 | ** |
| cat: Health, well-being and care | 0.2419 | 0.0860 | 2.81 | 0.0049 | ** |
| cat: Housing | -0.1822 | 0.1163 | -1.57 | 0.1173 | |
| cat: Information and communication | -0.0746 | 0.1269 | -0.59 | 0.5564 | |
| cat: International affairs and defence | 0.0739 | 0.1024 | 0.72 | 0.4705 | |
| cat: Leisure and culture | 0.2480 | 0.1084 | 2.29 | 0.0222 | * |
| cat: Life in the community | 0.0002 | 0.1047 | 0.00 | 0.9983 | |
| cat: People and organisations | 0.1670 | 0.1208 | 1.38 | 0.1668 | |
| cat: Public order, justice and rights | 0.1279 | 0.0879 | 1.46 | 0.1457 | |
| cat: Science, technology and innovation | 0.3043 | 0.1654 | 1.84 | 0.0659 | |
| cat: Transport and infrastructure | -0.0669 | 0.0897 | -0.75 | 0.4561 | |
| Start on Monday | -0.0033 | 0.0586 | -0.06 | 0.9557 | |
| Start on Tuesday | -0.0461 | 0.0586 | -0.79 | 0.4315 | |
| Start on Wednesday | -0.0161 | 0.0591 | -0.27 | 0.7850 | |
| Start on Thursday | 0.0775 | 0.0595 | 1.30 | 0.1929 | |
| Start on Friday | -0.0651 | 0.0602 | -1.08 | 0.2793 | |
| Start on Saturday | -0.0153 | 0.0610 | -0.25 | 0.8022 | |
| Signatures on Day 1 | 0.0004 | 0.0000 | 28.31 | 0.0000 | ** |
| Number of petitions started on same day | 0.0083 | 0.0020 | 4.11 | 0.0000 | ** |
Categories variables are relative to the first category in the list, Business and industry.
** *
5 Discussion
The 500 signatures mark seems at first consideration a very low threshold that should easily be passed. However, by far the majority of petitions (94 per cent in this time period) fail to attain even this modest number of signatures. This illustrates the low costs of initiating a collective action (with less regard to its viability) and the ability of digital trace data to easily track an entire population of mobilisations (before the success of each mobilisation is know). Petitions in the dataset are most active when they are first launched, and most petitions (presumably in the lack of outside stimulus) become digital dust after a couple of months despite typical deadlines of one year on the site.
Confirmation of our hypothesis regarding the leptokurtic distribution of changes to the support for a petition suggests that in online environments, collective action could play a role in a punctuated equilibrium model of policy change. That is, the general pattern for policy attention is for issues to remain dormant or in stasis, with a generally low level of attention. Some issues (by far the minority) that attract attention quickly gain a ‘critical mass’ of activists and start to vie for policy attention, joining the range of other institutional influences in helping to ‘punctuate’ the equilibrium. Such an argument would not include the claim that the mechanism by which collective action acts to bring about instability would be the same as the role played by the media, which plays a distinctive ‘lurching’ role in Jones and Baumgartner’s analysis, based in part on the tendency of the media to process a small number of issues in parallel. In the context studied here, the mechanism would depend more on the ways in which a mobilisation is disseminated via online social networks, something that previous research mentioned in the introduction has begun to investigate. If such activity tends to take place on the day the petition is initiated, then these findings could indicate the importance of achieving some kind of viability signal with petitioner’s closest contacts right at the start, because initial rapid growth will have a greater effects on subsequent participation decisions by ‘weaker tie’ contacts than a gradual growth over a prolonged period.
In other empirical studies using experimental methodologies, we have started to uncover the mechanism behind such punctuations. That is, in addition to the close contacts informed about the petition directly by the petitioner, other individuals (including people unknown to the petitioner or more distant contacts) deciding whether to participate will be influenced by the information that other people have already participated. This influence will depend on the number of other participants [17], the personality of the individual deciding whether to participate [18], and the closeness of the individual to the petitioner. The occurrence of a punctuation will depend on the existence of ‘starters’ whose thresholds for participation are low or whose closeness to the petitioner has in this instance reduced their threshold for participation. These starters will act as a signal for people with higher thresholds and weaker ties to the petitioner to ‘follow’ in signing the petition, thereby acting as a further signal for people with even higher thresholds to join. At some point, if the petition is successful, then the number of followers will reach ‘critical mass’ and attention to the mobilisation will become widespread, breaking out of the petitioner’s social network and gain more general social media exposure.
So, there are two possible explanations for the importance of the first day in achieving the critical mass: first, the way in which the petition is disseminated via online networks and second, the dynamic of starters and followers and social information about other participants in the burst of activity. If it is that visitors to the petition are heavily influenced by the numbers of other participants that they observe, then the finding could join those of other work in economics illustrating the importance of ‘first donations’ in charitable giving [6], showing that early donors set the precedent for later donors, or the wider literature on conditional co-operation, showing that social information about the contribution of others influences an individual participant’s decision to contribute [19, 10]. This study complements this previous work by focusing on numbers of participants, rather than contribution amount (as everyone’s contribution, at least that we are able to measure, is the same) and a more explicitly political context, rather than that of charitable giving.
The strong effect of petitions tending to succeed quickly or not at all may be influenced by the design of the petition website during the period of study. For users starting at the homepage of the site, it was possible to view petitions overall or within a specific category and to sort petitions by the number of signatures or the date added. It was therefore easiest to look at petitions with the largest or smallest number of signatures and the oldest or newest petitions. It might be possible, therefore, that users of the site arriving at the homepage would only look at the newest petitions or the petitions with the most signatures contributing to the effects observed. This influence, however, would not apply to users following links shared via email and social media, which would point to a specific petition that the contact was supporting. These alternative effects might be tested using an experimental approach in future research.
6 Conclusions
We have found that in online mobilisations, growth tends not to occur, meaning that most mobilisations that are initiated, fail. But where it does, it proceeds in rapid bursts followed by periods of stasis. Such a finding suggests that online mobilisations of the kind covered here could play a role in the more general process of punctuated equilibria in policy-making. For example, Jones and Baumgartner [14] found a high correlation between public concern on an issue and Congressional attention. Our findings here could be even more interesting. In the theory of punctuated equilibrium the media plays a key role in terms of ‘lurching’ from one issue to another and having a complex feedback relationship with public opinion. The sort of mobilisations we are looking at here, however, are bubbling up relatively independently of the media, gaining media attention only when they obtain significantly high levels of support—the petition on road-pricing that successfully played a role in obtaining policy change, for example, received a great deal of media attention once that it reached one million signatories.
Research that develops our understanding of the mechanics of this turbulence will be important for scholars and policy-makers alike as collective action continues to move into online settings. If online collective action is characterised by punctuations, then it looks as if such activity could inject a further dose of instability into political systems. If mobilisations follow a pattern of very low levels of attention punctuated by occasional ‘spurts’ which grow rapidly into full scale mobilisations that merge with other elements of the political system to push policy change on to the agenda and the institutional landscape, then we can expect to see increasing turbulence in contemporary politics, adding to the ‘instability’ that Baumgartner and Jones [3, 14] and their co-investigators have modelled so extensively in previous research.
Our future empirical work will analyse petition growth at a finer scale: we are currently drawing data from a new UK e-petitions site on an hourly basis and from a US government petition website, in order to obtain a more fine-grained and cross-national analysis of the crucial early days of mobilisations. Future work will also explore coordination with media coverage and mentions of the petitions on social networking sites (such as Facebook and Twitter), work to explicitly model petition growth curves, and better understand the role of petition categories. Much of the work on collective action noted above is based on research into a single platform, whereas any online activity tends to involve several. By looking carefully at the timing with which an issue gains attention in different parts of the political system, including the activist activities investigated here, we might get closer to establishing some sort of sequencing of attention. In addition, one way of getting around the lack of causal inference in research of this kind is to carry out experiments, as in Margetts et al. [17, 18]. The findings presented here seem to illustrate to those initiating petitions, the importance of disseminating a petition to their ‘strongest’ contacts rapidly; future work using both ‘big data’ and experimental approaches could further inform the optimal way that such dissemination should take place.
Future work will also use an experimental approach to analyse the effect of different information environments surrounding petition websites on petition growth. Designers of web sites that involve civic engagement, such as e-petition sites, must decide what social information about existing levels of participation to include, for example the numbers of people who have already signed and the timings of when they did so. Other design decisions include whether participants are anonymous or whether their names are made visible, and whether input from other social media platforms is incorporated into the petition site. Research of this kind can inform such design decisions in ways that maximise citizens’ input to policy debates.
7 Acknowledgements
This work was supported by the Economic and Social Research Council [grant number RES-051-27-0331].
References
- [1] Ackland, R., and Gibson, R. Hyperlinks and horizontal political communication on the www: The untold story of parties online. Virtual Observatory for the Study of Online Networks (2006).
- [2] Aral, S., and Walker, D. Creating social contagion through viral product design: A randomized trial of peer influence in networks. Management Science 57, 9 (September 2011), 1623–1639.
- [3] Baumgartner, F., and Jones, B. Agendas and instability in American politics. University Of Chicago Press, 1993.
- [4] Bennett, W. L., and Segerberg, A. Digital media and the personalization of collective action. Information, Communication & Society 14, 6 (2011), 770–799.
- [5] Bimber, B. Information and American democracy: Technology in the evolution of political power. Cambridge University Press, 2003.
- [6] Bøg, M., Harmgart, H., Huck, S., and Jeffers, A. M. Fundraising on the Internet. Kyklos 65, 1 (2012), 18–30.
- [7] Chakravarti, I. M., Laha, R. G., and Roy, J. Handbook of methods of applied statistics, vol. 1. John Wiley & Sons, 1967.
- [8] Conte, R., Gilbert, N., Bonelli, G., Cioffi-Revilla, C., Deffuant, G., Kertesz, J., Loreto, V., Moat, S., Nadal, J.-P., Sanchez, A., Nowak, A., Flache, A., San Miguel, M., and Helbing, D. Manifesto of computational social science. The European Physical Journal Special Topics 214 (2012), 325–346.
- [9] Etling, B., Kelly, J., Faris, R., and Palfrey, J. Mapping the Arabic blogosphere: Politics and dissent online. New Media & Society 12, 8 (2010), 1225–1243.
- [10] Frey, B. S., and Meier, S. Social comparisons and pro-social behavior: Testing “conditional cooperation” in a field experiment. American Economic Review 94, 5 (December 2004), 1717–1722.
- [11] González-Bailón, S., Borge-Holthoefer, J., Rivero, A., and Moreno, Y. The dynamics of protest recruitment through an online network. Scientific reports 1 (2011).
- [12] Hindman, M. The myth of digital democracy. Princeton University Press, 2008.
- [13] John, P., and Margetts, H. Policy punctuations in the UK: Fluctuations and equilibria in central government expenditure since 1951. Public Administration 81, 3 (2003), 411–432.
- [14] Jones, B. D., and Baumgartner, F. R. The politics of attention: How government prioritizes problems. University of Chicago Press, 2005.
- [15] Lazer, D., Pentland, A., Adamic, L., Aral, S., Barabási, A.-L., Brewer, D., Christakis, N., Contractor, N., Fowler, J., Gutmann, M., Jebara, T., King, G., Macy, M., Roy, D., and Van Alstyne, M. Computational social science. Science 323, 5915 (2009), 721–723.
- [16] Lupia, A., and Sin, G. Which public goods are endangered?: How evolving communication technologies affect the logic of collective action. Public Choice 117 (2003), 315–331. 10.1023/B:PUCH.0000003735.07840.c7.
- [17] Margetts, H., John, P., Escher, T., and Reissfelder, S. Social information and political participation on the internet: an experiment. European Political Science Review 3 (8 2011), 321–344.
- [18] Margetts, H. Z., John, P., Reissfelder, S., and Hale, S. A. Social influence and collective action: An experiment investigating the effects of visibility and social information moderated by personality. Under review, available on SSRN, 2012.
- [19] Shang, J., and Croson, R. A field experiment in charitable contribution: The impact of social information on the voluntary provision of public goods. The Economic Journal 119, 540 (2009), 1422–1439.
- [20] Shapiro, S. S., and Wilk, M. B. An analysis of variance test for normality (complete samples). Biometrika 52, 3/4 (1965), 591–611.
- [21] Whyte, A., Renton, A., and Macintosh, A. E-petitioning in kingston and bristol: Evaluation of e-petitioning in the local e-democracy national project. 2005.