Directed self-assembly of spherical caps via confinement
Abstract
In this work we use Monte Carlo simulations to study the phase behavior of spherical caps confined between two parallel hard walls separated by a distance . The particle model consists of a hard sphere of diameter cut off by a plane at a height , and it is loosely based on mushroom cap-shaped particles whose phase behavior was recently studied experimentally [E. K. Riley and C. M. Liddell, Langmuir, 26, 11648 (2010)]. The geometry of the particles is characterized by the reduced height , such that the model extrapolates between hard spheres for and infinitely thin hard platelets for . Three different particle shapes are investigated: (a) three-quarter height spherical caps (), (b) one-half height spherical caps or hemispheres (), and (c) one-quarter height spherical caps (). These three models are used to rationalize the effect of particle shape, obtained by cutting off spheres at different heights, on the entropy-driven self-assembly of the particles under strong confinements; i.e., for . As is varied, a sequence of crystal structures are observed, including some having similar symmetry as that of the structures observed in confined hard spheres on account of the remaining spherical surface in the particles, but with additional features on account of the particle shapes having intrinsic anisotropy and orientational degrees of freedom. The system is found to exhibit a phase diagram that is most similar to the one obtained experimentally for the confined mushroom cap-shaped colloidal particles under. A qualitative global phase diagram is constructed that helps reveal the interrelations among different phases for all the particle shapes and confinements studied.
I Introduction
Materials that are able to control and modify light propagation are very promising for photonic applications Joannopoulos et al. (2008). Among these, Photonic bandgap (PBG) crystals, which consist of materials having different dielectric constants arranged in a periodic structure Xia et al. (2000); Hamley (2003), have been the subject of intensive research during the last few decades. PBG crystals can be fabricated by exploiting the self-assembly of polymers, block co-polymers, and colloidal particles into different morphologiesXia et al. (2001). In PBG crystals formed by the self-assembly of colloidal particles, the geometry of the particles has been envisioned as one of several possible factors that can modify, and possibly enhance, the optical properties of the materials Lu et al. (2001); Velikov et al. (2002); Glotzer and Solomon (2007); Yang et al. (2008); Hosein et al. (2010a, b); Forster et al. (2011); Solomon (2011). Clearly, the colloidal particles used for this purpose should have specific and well defined shapes and low particle-size polydispersity Fung et al. (2012). Advances in new routes of synthesis have made possible the fabrication of such anisotropic particles in large quantities Love et al. (2002); Kim et al. (2006); Badaire et al. (2007); Hernandez and Mason (2007); Sacanna and Pine (2011), so it has become possible to produce materials with specific properties by tailoring the individual particles.
Several examples of crystals formed by the self-assembly of anisotropic particles have been reported in the literature. Dimers, formed by fusing two lobes of either equal (symmetric) or different (asymmetric) diameters, constitute one of the simplest geometries to model anisotropic colloids. PBG crystals formed by symmetric Hosein et al. (2010b); Forster et al. (2011) and asymmetric dimers Hosein and Liddell (2007); Hosein et al. (2010b) have been reported. The theoretical PGB for this geometry has also been studied Hosein et al. (2010b), showing that the optical properties of the material can change by modifying the symmetry and the degree of interpenetration of the lobes. The influence of particle shape on PBG has also been studied in a system consisting of spherical silica particles, whose shape can be modified into ellipsoids using ion radiationSnoeks et al. (2000); Velikov et al. (2002). Assuming that the material of the particles before and after the radiation is not modified, the PBG was found to change as a consequence of the anisotropic shape and the lattice spacing of the new structure.
Over the years, geometrical confinement of colloidal particles has been used as a method to control their self-assembly into well defined crystals structures Löwen (2009). For example, in systems formed by spherical particles confined between two planar walls or in a wedge, a cascade of different phases is observed as a function of the degree of confinement. Experiments Pieranski et al. (1983); Neser et al. (1997); Ramiro-Manzano et al. (2009) and computer simulations Schmidt and Löwen (1996, 1997); Fortini and Dijkstra (2006) of spherical particles concur that as the confinement is reduced (i.e. as the separation between the confining planes is increased) the crystal structures follow the sequence: , where the symbols , , , , and denote triangular, buckled, square, rhombic, and prismatic lattices, respectively (see note in reference 28). Similar research has been carried out by several groups for anisotropic particles, under conditions of strong confinement that approached or enacted a behavior in (quasi-) two dimensional geometry. Examples of such experimental and computational investigations include studies of two-dimensional (monolayer) systems for hard dimers Wojciechowski et al. (1991); Lee et al. (2008); Gerbode et al. (2010); Lee et al. (2009), hard spherocylinders Bates and Frenkel (2000), hard polygons Wojciechowski and Frenkel (2004); Schilling et al. (2005); Donev et al. (2006); Zhao and Mason (2009); Zhao et al. (2011, 2012); Zhao and Mason (2012); Avendano and Escobedo (2012); Atkinson et al. (2012), superdisks Jiao et al. (2008), and studies of systems confined between parallel walls for thin hard-rods Cosentino Lagomarsino et al. (2003) and octapod-shaped colloids Qi et al. (2012).
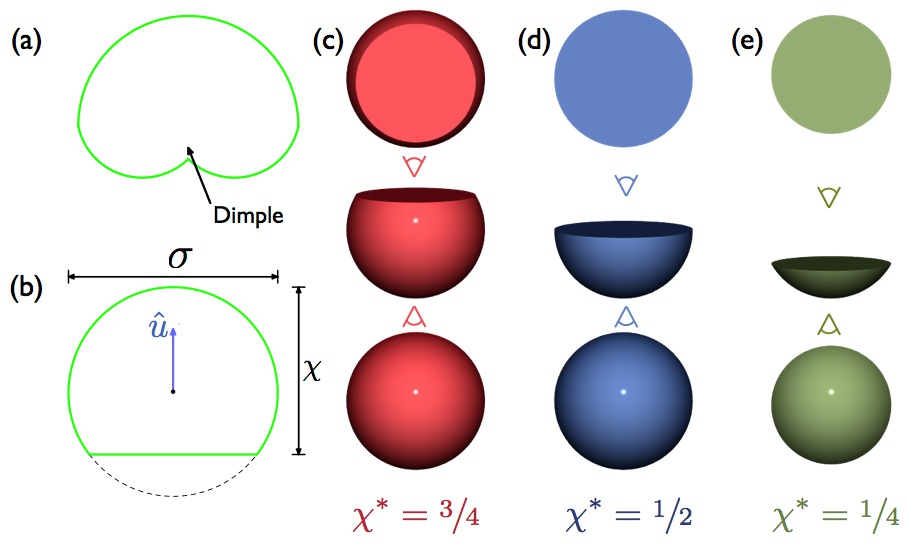
Recently, anisotropic particles whose shape resembles the form of a mushroom cap, have been the object of several recent studies Hosein and Liddell (2007); Riley and Liddell (2010); Xu et al. (2010); Fung et al. (2012); Kim et al. (2012). The cross section of an idealized model of these particles is show in Figure 1(a). It has been observed experimentally that under strong confinement such mushroom cap-shaped particles exhibit the formation of the following sequence of crystal structures as the confinement is reduced Riley and Liddell (2010): , where denotes a side rotator hexagonal crystal phase, and the subscripts and refer to the orientations of the particles in each layer; the former describes lattices having all the particles oriented in the same direction, while the latter denotes random orientations of the particles. Although the crystal lattices formed by mushroom cap-shaped and spherical particles might appear similar, important differences can be observed as a consequence of the orientation of the particles in the crystals. In the and crystal structures, for example, the particles in each layer are placed in a triangular lattice with random orientations that can be either dimple-up or dimple-down, while in the crystal phase a bifurcation in the particles orientation (BPO) is observed with the formation of alternating stripes of particles oriented dimple-up and dimple-down with either straight or zig-zag buckling. The BPO of the alternating stripes in the maximizes the packing of the crystal structure Riley and Liddell (2010); Riley et al. (2012). As in the case of confined hard spheres, the transforms into a crystal phase showing also a BPO as the confinement is decreased. In both and the orientation of the particles in each layer is such that the dimples always face towards the walls. In the and rotator crystal phases, the particles in each layer are placed in a triangular lattice with the particles rotating in their lattice positions, but keeping the dimples mostly oriented parallel to the walls. As a consequence of the orientation and shape of the particles in the phase, the hexagonal order is weaker than that in phases. Recently, the same group studied the self-assembly of similar mushroom-cap shaped particles synthesized using seed emulsion polymerization Fung et al. (2012). The phase behavior of the new particles was found to be slightly different from that previously reported Riley and Liddell (2010), in particular, in the buckled monolayer the particles were now mainly oriented parallel to the walls, and in the square bilayer the particles in the bottom layer were oriented parallel to the walls while the particles in the upper layer are dimple-up oriented. These results suggest that the phases formed by the particles are sensitive to the shape of the particles and, possibly, kinetic traps near metastable states.
Computer simulation can be used to systematically study the effect of particle shape, particularly of orientational degrees of freedom, on the self-assembly and phase behavior of anisotropic particles. Simulation studies of anisotropic particles having curved surface area have mostly focused on bulk behavior. For example, Cinnacchi et al. Cinacchi and van Duijneveldt (2010), reported the bulk phase behavior of contact lens-like particles using Monte Carlo (MC) simulations. For large values of the radius of curvature, approaching the limit of infinitely thin hard platelets, the system exhibits the formation of a nematic phase at high densities, consistent with the phase behavior of hard platelets Veerman and Frenkel (1992), while for small values of the radius of curvature the system shows the formation of clusters with spherical-like shape. The phase behavior of bowl-shaped particles (a shape intended to model experimental colloidal particles concurrently studied Marechal et al. (2010)) has also been reported based on MC simulations and free energy calculations Marechal and Dijkstra (2010); Filion et al. (2009). Simulations of the bowl-shaped model reveal the formation of several crystal and liquid crystal structures depending on the thickness of the bowls which ranged from thin hard-bowls to hard-hemispheres.
In this work, we present the phase behavior of an idealized model of mushroom-cap shaped colloidal particles, which are modelled as spherical caps interacting only via excluded volume, and confined between two parallel hard walls. Using this model we address the effect of particle shape (as the fraction of curved surface area varies) on the self-assembly and phase behavior for conditions of strong confinement. Specifically, our study encompasses three different hard-core particle shapes: (a) three-quarter height spherical caps, (b) one-half spherical caps (hemispheres), and (c) one-quarter height spherical caps The rest of the paper is organized as follow: In section II the simulation model is presented, in section III the results for the three different particles shapes, including some general remarks are described. In section IV the main conclusion are summarized, followed by an Appendix where a summary of the simulation techniques are described, including the algorithm to determine particle-particle and particle-wall overlaps.
II Model
The particle model consists of spherical caps (SC), that is, hard spheres of diameter cut-off by a plane at a height . Particles only experience excluded volume interactions and are confined between two parallel hard walls separated by a distance . A schematic representation of the cross section of the particles is depicted in Figure 1(b). The particle model is fully characterized by its reduced height (aspect ratio) , and its orientation is completely described by the unit vector along the principal axis of symmetry. Note that is also equal to the spherical surface fraction defined as the ratio of the curved surface area of the particle to the surface area of the complete sphere, while is the ratio of flat to curved surface areas. In order to address the effect of on the phase behavior of the system, three different values of the aspect ratio are analysed: (a) three-quarter height SC (), (b) one-half height SC or hemispheres (), and (c) one-quarter height SC (). Throughout this work, structural and thermodynamic properties are reported in reduced units, where the pressure, packing fraction, and separation between the walls are given by: , , and , where is the pressure, is Boltzmann’s constant, is the absolute temperature, is the total number of particles, represents the volume of one particle, and is the total volume of the system. Details of the simulation techniques used to calculate the phase behavior of SC are presented in the Appendix.
III Results
III.1 Spherical caps with aspect ratio
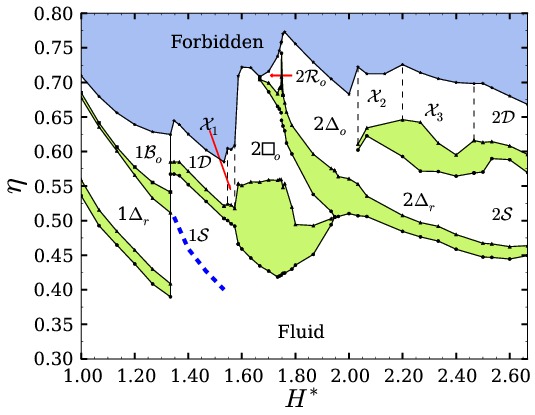
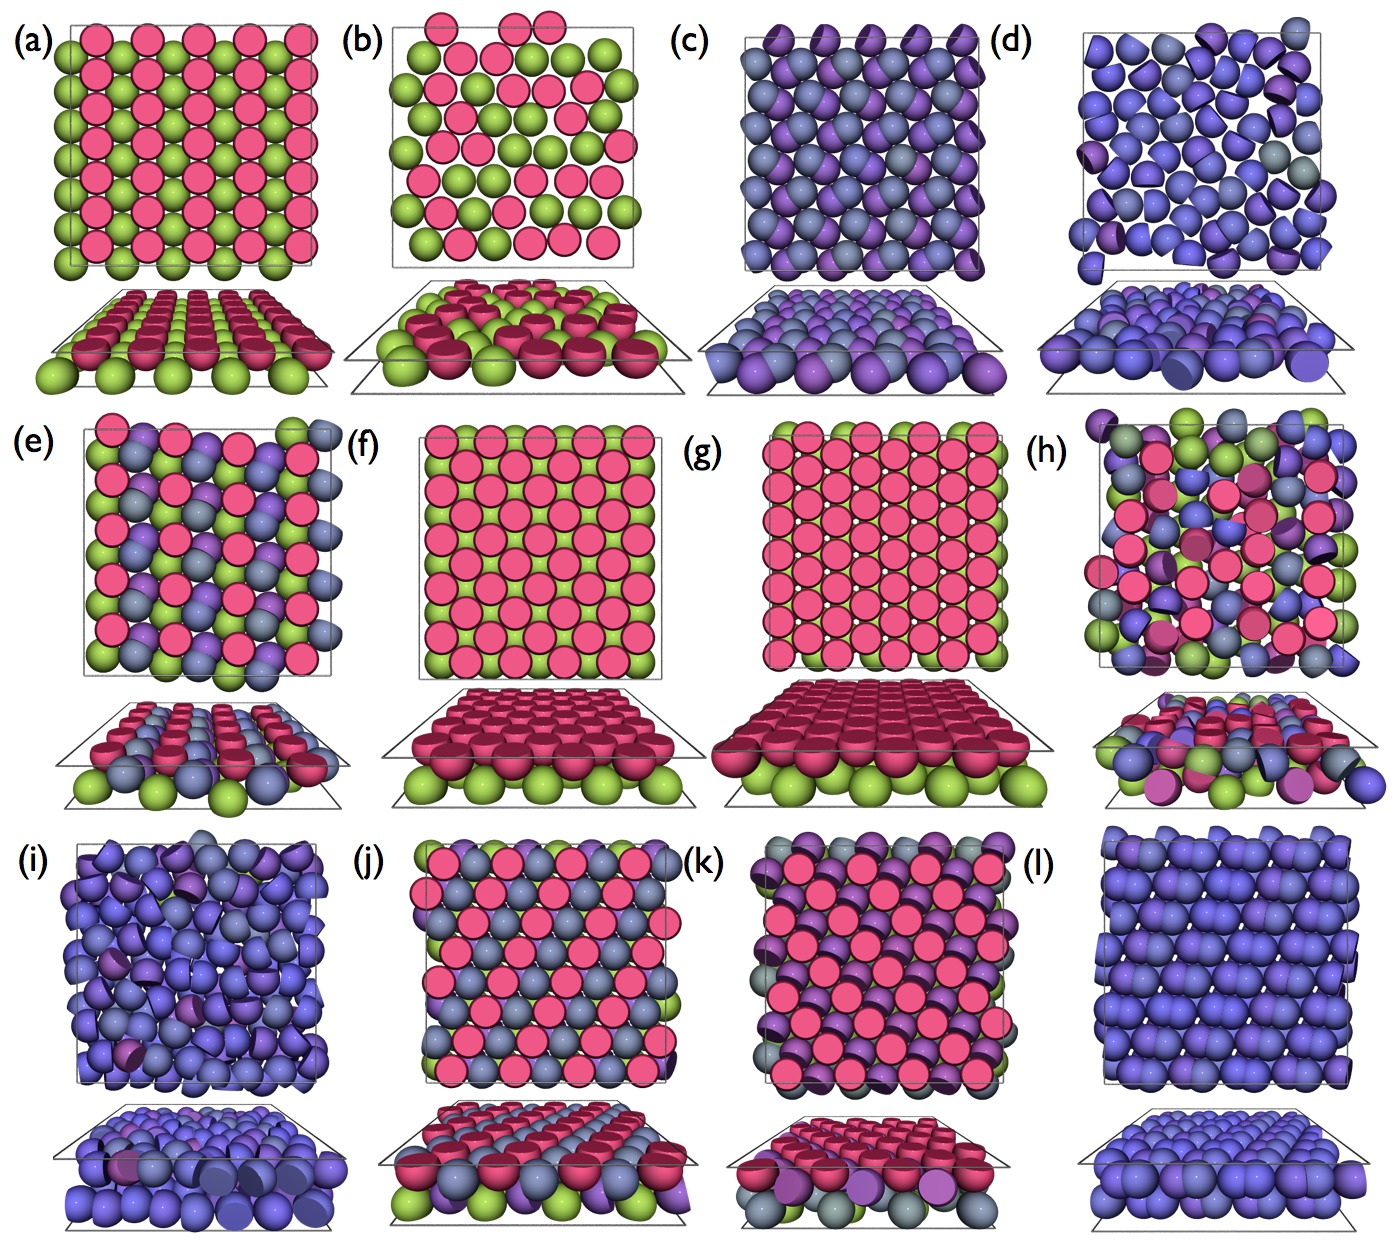
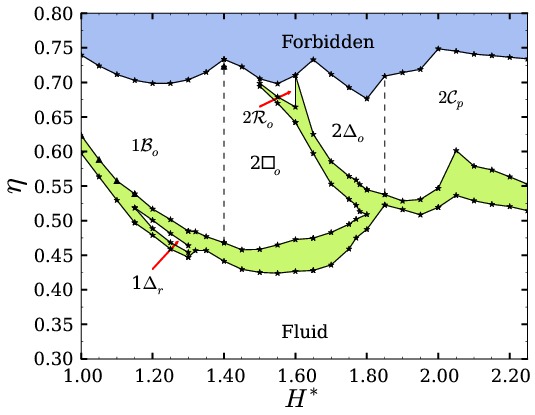
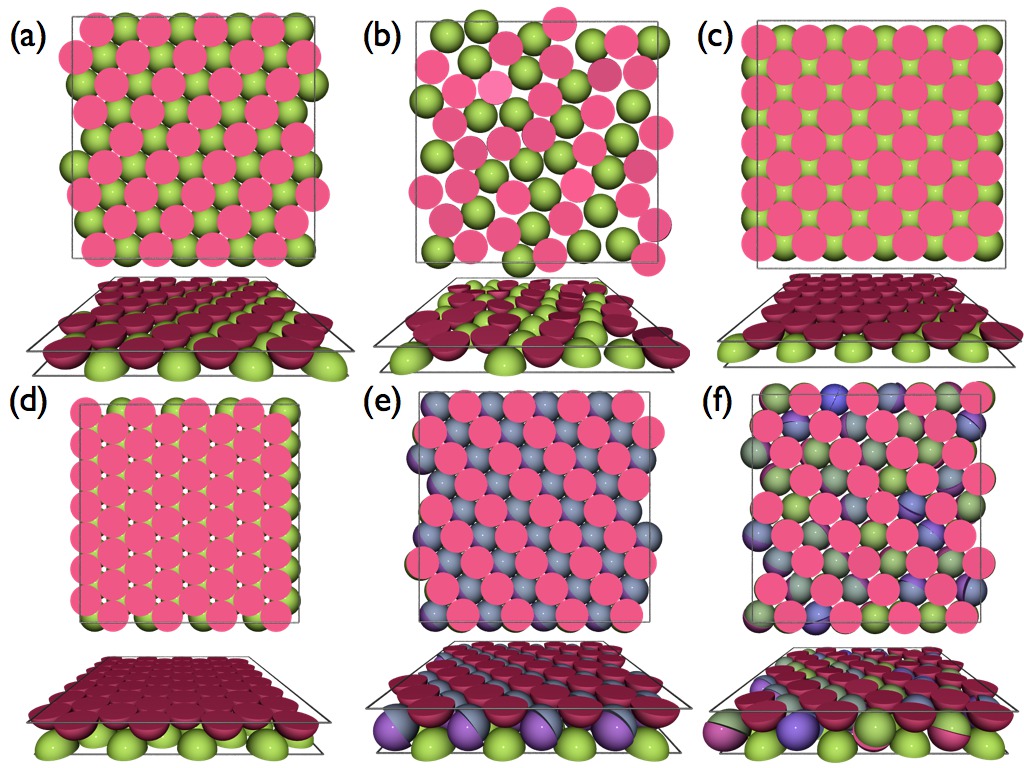
The phase diagram for SC with under confinement is shown in Figure 2. The phase behavior for this system is richer that the one displayed by confined hard-spheres Schmidt and Löwen (1996, 1997); Fortini and Dijkstra (2006). For the highest possible confinements, corresponding to (the upper limit corresponds to ), the particles translate in a quasi-two dimensional fashion adopting only two possible orientations: either face-up or face-down. The first two stable phases observed at these conditions are a buckled monolayer with BPO and a random orientated hexagonal monolayer . Representative configurations are shown in Figures 3(a-b). As mentioned in the introduction, confined hard spheres also exhibit the formation of buckled and hexagonal monolayers, however, the main difference is that SC can adopt several orientations depending of the degree of confinement.
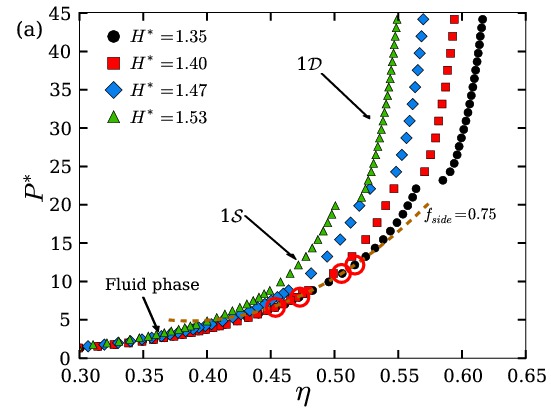
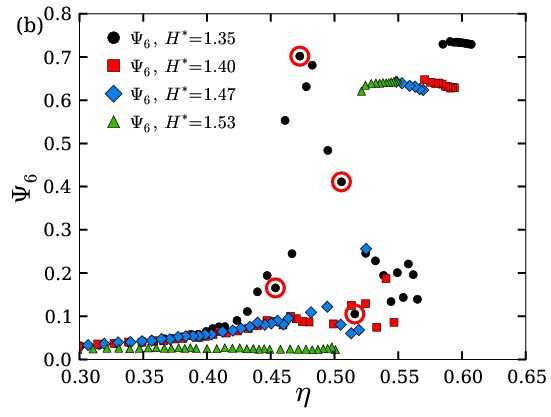
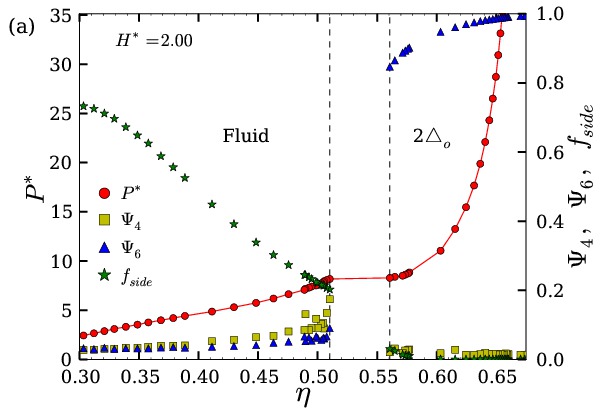
For , high-density systems exhibit the formation of a dimer phase , in which the particles orient parallel to the walls pairing up in dimers that can take on several configurations Wojciechowski et al. (1991). In Figure 3(c) one of the dimer crystal phases with a herringbone configuration is shown. Upon expansion the crystal melts into a fluid side phase monolayer in which the particles remain oriented mainly parallel to the walls. For (a confinement corresponding to hard walls separated by a distance ), the system exhibits a re-entrant hexagonal ordering behavior upon lowering the concentration: the hexagonal order first drops (forming a phase), then climbs up and finally drops down again. While the phase occurs for , the hexagonal- order re-entrant behavior is only apparent for values near 1.35. The phase behavior at these conditions is shown in Figure 4, where the equation of state (EoS) and hexagonal order parameter are plotted as a function of the packing fraction . The only discontinuity observed in the EoS is for the transition. The low-density branch of the EoS, that encompasses the phase, decreases monotonically showing no evidence of additional phase transitions. However, Figure 4(b) reveals that for a peak in hexagonal order occurs that spans . For these states, very long runs were carried out to rule out the possibility of artifacts due to slow relaxation and mobility; also, additional compression runs started from an isotropic state reproduced the same re-entrant behavior.
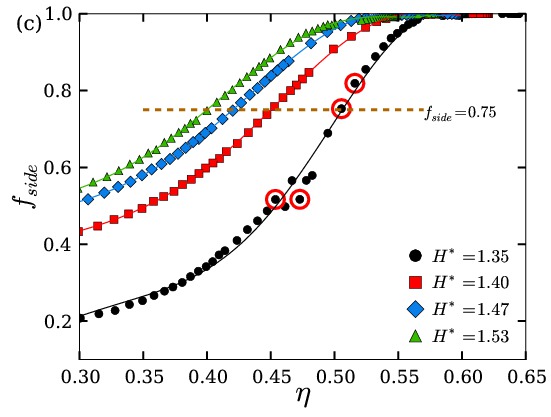
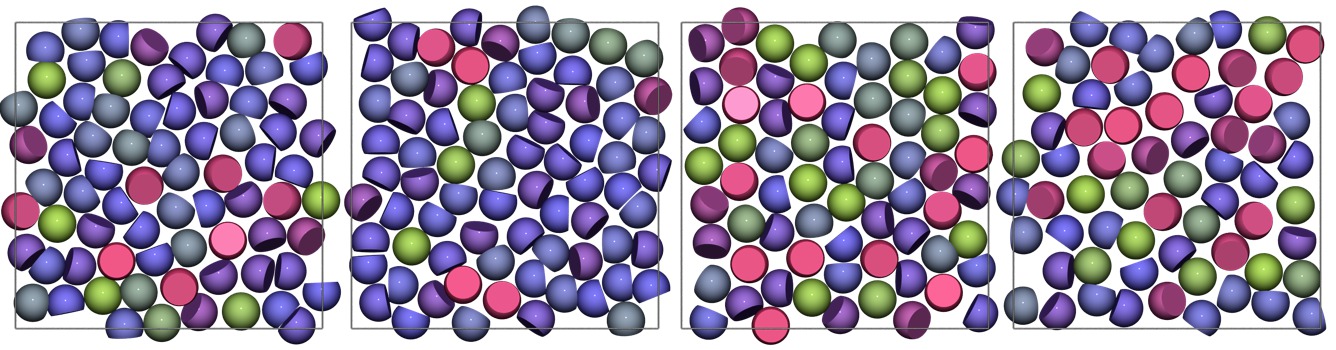
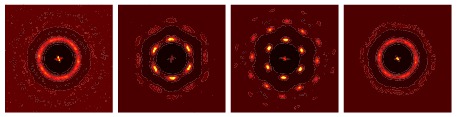
To explore the correlation between side orientation and hexagonal order, the fraction of particles oriented parallel to the walls is shown in Figure 4(c). A particle was considered to be oriented parallel to the wall if , where is the unit vector perpendicular to the walls; this angle ensures that the rim of the SC curved surface faces the walls. It can be observed in Figure 4(c) that for the fraction of particles side-oriented decreases when the system expands. Figure 5 shows snapshots and corresponding two-dimensional structure factors for in the range; it is observed that when most particles remain oriented parallel to the walls (e.g., at ) the resulting anisotropic shape presented for particle-particle interactions frustrates the establishment of hexagonal order, while when about half particles orient perpendicularly to the walls, they effectively interact as spheres which can enhance the hexagonal order if the volume fraction is sufficiently high. It is then a combination of high volume fraction and low enough that promote hexagonal order.
The peak-behavior (and strong fluctuations) in values observed in the re-entrant region for can be explained by its proximity to the phase that occurs (in the same range) for just below (see Figure 2); indeed, re-entrant states around could be considered to still be “part” of the phase domain. Of course, hexagonal order gets accentuated once is not large enough () to accommodate side orientations hence leading to smaller values. Re-entrant behavior notwithstanding, it is also difficult to pinpoint the limits of stability of the phase, but an approximate phase boundary can be sketched based on the vs. density plot (see Figure 4(c)). A threshold of is used to draw the approximate phase boundary represented by thick dashed lines in Figures 2 and 4.
When the confinement is decreased, the phase transforms into a square bilayer . This transformation seems to occurs with a intermediate, which is formed by the separation of some of the dimers in the phase, and their reorientation to face toward the walls (see Figure 3(e)). As in the case of confined hard spheres, the phase transforms into a mediated by a rhombic phase . Likewise , these three phases show BPO. As increases at intermediate densities, the transforms continuously into a hexagonal bilayer with random particle orientations , which then transforms into a hexagonal bilayer with particles acquiring orientations parallel to the walls. These three phases are shown in Figures 3(g-i). This sequence of transformations seems to occur continuously as no signs of first-order transitions were observed during the simulations.
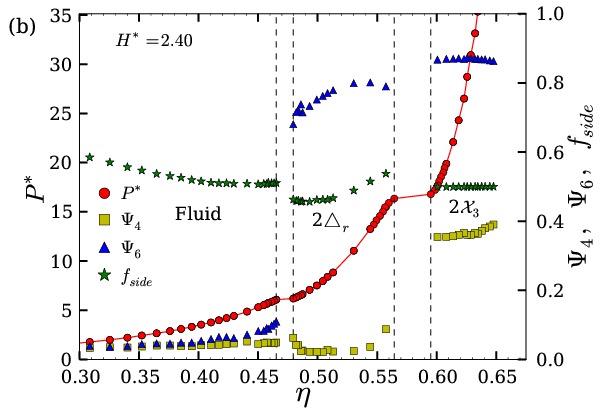
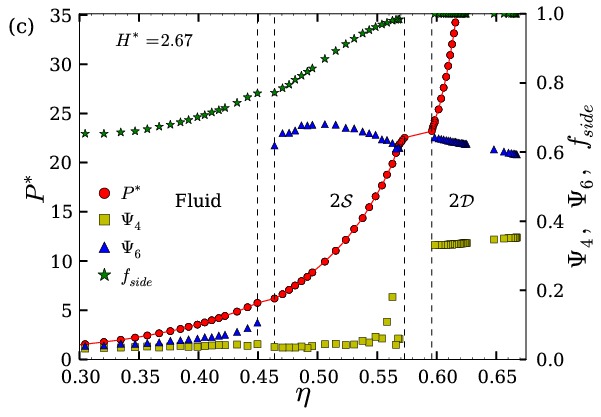
At high densities, the phase transforms into a dense dimer side bilayer structure (shown in Figure 3(l)) as is increased. The transformation seems to occur through two intermediaries and , which are shown in Figures 3(j-k). In the phase the dimers are intercalated between stripes formed by particles with opposite orientations facing toward the confining walls. In the second intermediary structure , the particles forming the dimer in the detach and reorient to adopt a side configuration, while the particles facing toward the confining walls (in ) remain in a similar configuration. Finally, the particles that were facing the walls reorient to form the structure. Upon expansion at constant confinement , the and structures transform into a phase, while the crystal transforms into a phase. These transformation are marked in Figure 6, where the equation of state, bond order parameters and , and fraction of particles oriented parallel to the walls are shown for three different confinements: , , and . The densest crystal structures for each of these confinements are , , and , respectively.
The transformation observed upon expansion are: for (Figure 6(a)), for (Figure 6(b)), and for (Figure 6(c)). The three structures , , and show large values of the bond order parameter revealing their hexagonal order. However, the profiles are different for each of the confinements. For the and , vanishes indicating that there is a BPO in the structure (see Figure 3(g)); however, increases once that the fluid region has been reached. For the system the profile shows that approximately half of the particles are oriented parallel to the walls, confirming that in the hexagonal structures particles have random orientations as shown in Figure 3(h). Note that while in the phase the particles can take only face-up or face-down orientations, in the they can adopt any possible orientation. Finally, in the system most of the particles are oriented parallel to the walls, as revealed by the large values of , confirming the existence of the phase. It can also be observed that both the and phases show moderate values of the order parameter , while the phase exhibits larger values for this parameter. This effect is mainly caused by the particles oriented parallel to the wall perturbing the hexagonal order Dullens et al. (2006).
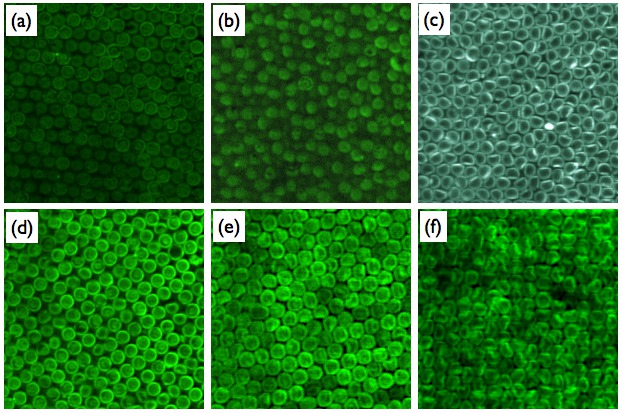
The SC model with presented in this section resembles closely the shape of the mushroom cap-shaped particles reported in reference 46. The comparison of the structures formed by such SC with those found experimentally reveals that the model is appropriate to describe the phase behavior of the real system. As mentioned in the introduction, mushroom cap-shaped particles reported in references 13 and 46 exhibit the following crystal sequence: (or ) (or ) . Our model of SC with encounters the sequence for the horizontal band of packing fractions between in Figure 2, suggesting that the crystal structures in references 13 and 46 are in equilibrium. Figure 7 shows the experimental structures for , , , , , and formed by mushroom caps, revealing good agreement with those found in simulation (see Fig. 3) with one exception: in the experimental buckled monolayer the particles orient with the dimples parallel to the walls, while in the simulated the particles orient perpendicular to the walls. Moreover, the simulations reveal six additional phases that have not been observed in experiments, most of which occur at higher densities and whose structure may not be accessible to experiments due to kinetic trapping. Indeed, the phases observed experimentally appear to be the first ordered structures encountered in our phase diagram (for a given ) while going up in concentration. It is remarked, however, that the boundaries of the simulated phases are only approximate and (non-trivial) free energy calculation would be needed to refine them and to determine the stability of the additional phases.
III.2 Spherical caps with
The phase diagram of confined SC with aspect ratio , corresponding to hard hemispheres, is depicted in Figure 8. As in the previous case, the first stable crystal structures observed for this system is a phase, which is now stable for . Over a very small region in the phase diagram, it is also observed the formation of a random hexagonal monolayer , characterized by random face-up and face-down orientations of the particles. As in the case of SC with , this system exhibits the formation of three bilayer structures , , and . In Figure 9 representative snapshots for these phases are presented. For high densities and , which correspond to wall separations larger than the diameter of the particles, a rectangular plastic bilayer phase is formed, which is characterized by alternating arrays of face-to-face sphere-like dimers, and column-like dimers. At high densities the orientations of the sphere-like dimers are frozen as shown in Figure 9(e); however, when the system is expanded the dimers start to freely rotate around their centres of mass as in a plastic rotator phase as seen in Figure 9(f). The phase resembles the structure seen for , in which the dimers are intercalated between stripes formed by particles with opposite orientations facing towards the confining wall. However, in the structure the dimers cannot rotate as in the case of hemispheres. The phase also resembles the face-centered cubic rotator phase formed by hard-hemispheres at bulk conditions Filion et al. (2009); Marechal et al. (2010); Marechal and Dijkstra (2010).
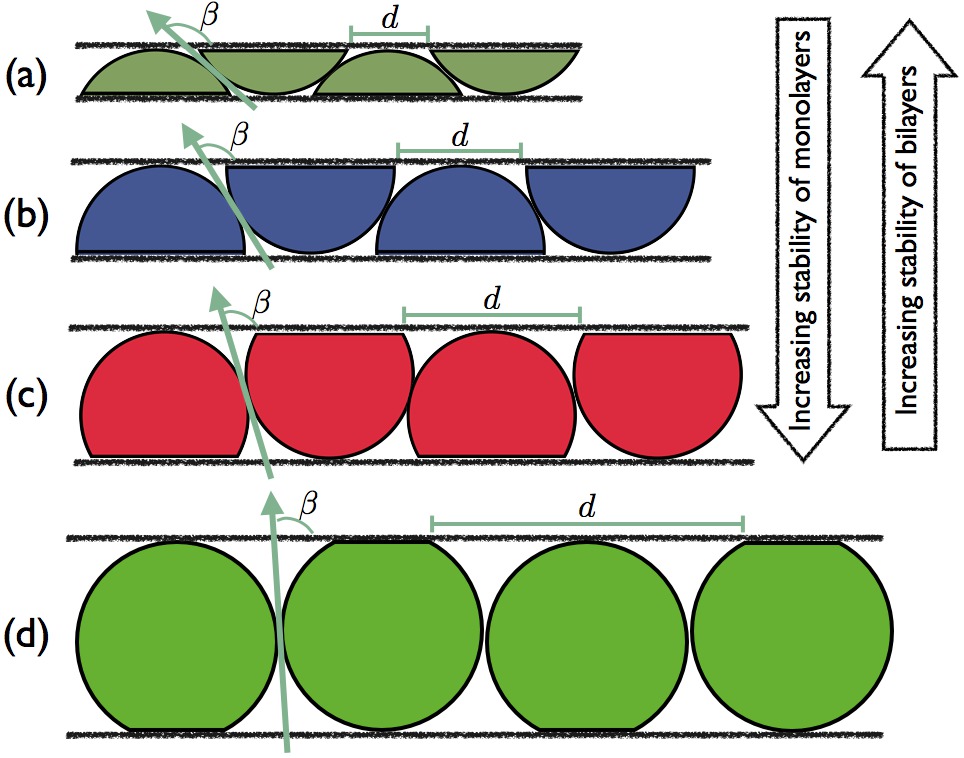
The phase behavior of hard hemispheres suggest that the stabilization of hexagonal monolayers over large densities and strong confinement is attained only for systems comprised of particles with large spherical surface fraction or . This effect can be explained using Figure 10 and the following geometrical arguments. If is increased, the SC bases (capping discs) are pushed apart making the monolayers more stable (see Figure 10(b)). In this case, the distance between circumferences of nearest discs in alternating stripes increases and the contact angle between nearest particles in adjacent stripes reduces: the limit values for a perfect monolayer are and . Likewise, it is expected that in SC with under strong confinement, the bases of nearest particles in alternating stripes can come closer increasing the stability of bilayers over that of monolayers. In particular, it is expected that for infinitely thin spherical caps () the system would form bilayers directly without being preceded by monolayers. The same arguments also suggest that the stability of the buckled phase should be reduced as . These trends are consistent with the results presented in the following subsection for particles.
III.3 Spherical caps with
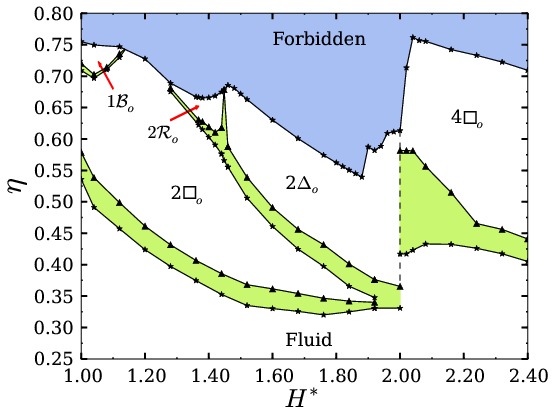
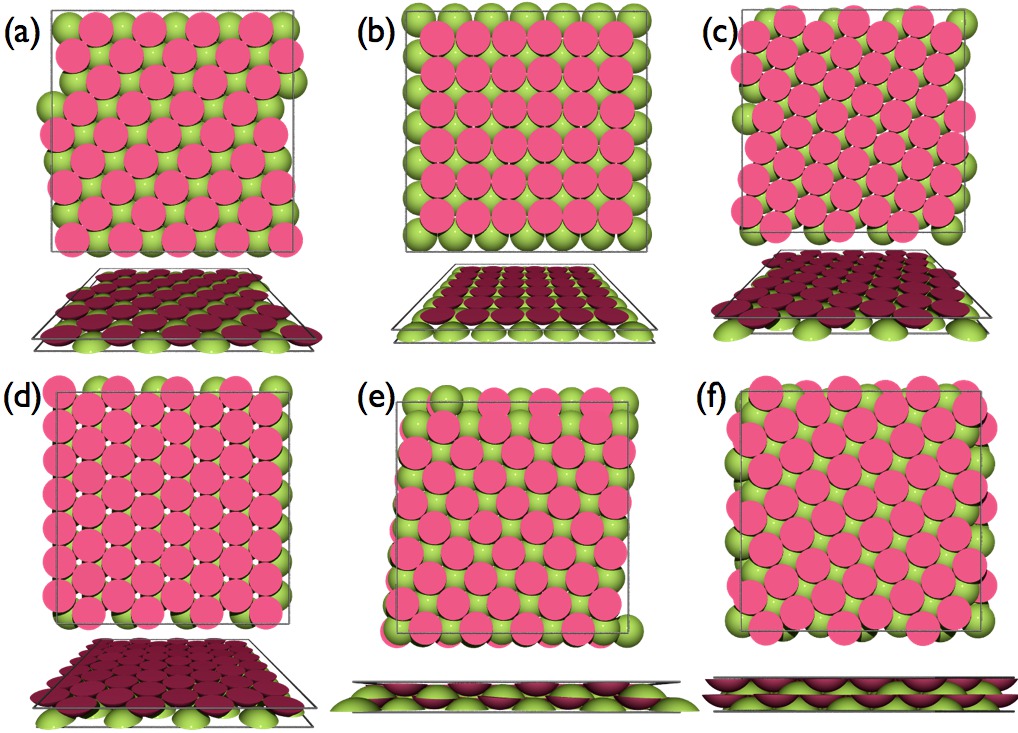
The phase diagram for SC particles with under different confinements, shown in Figure 11, is simpler than those of the other two particle shapes considered in this work. As in the two previous cases, the first crystal phase observed for this system at high densities and strong confinement is the buckled monolayer . However, this phase is only observed over a very small region of the phase diagram: and at high densities. This behavior is different from the one observed in confined hard spheres and in the previously described SC with and , where the buckled phases are stable over a wide range of densities and confinements. As a consequence of the small degree of buckling, at high densities the phase shows either straight or zig-zag stripes Han et al. (2008). In further contrast with hard spheres, SC particles with do not exhibit the formation of an hexagonal monolayer, which confirms the destabilization of monolayers for small as discussed before in reference to Figure 10. The small island of observed in Figure 11 is expected to get reduced if is further decreased. For the most stable crystal phases observed are the and structures and, as in the case of the previous systems, the phase transition is through a rhombic bilayer intermediary. All these bilayer structures, as in the previous cases, also exhibit a BPO in such a way that the base of the SC always face towards the confining walls, allowing them to pack efficiently. Representative snapshots for the , , , and phases are shown in Figure 12.
For the system shows an abrupt change in phase behavior where the number of layers increases from two to four and the structure adopts a square symmetry (). In the phase the two middle layers can either align to form dimers as in Figure 12(e) or overlay halfway as in Figure 12(f). In this region, it is difficult to pinpoint which crystal structure corresponds to a particular confinement unequivocally. As in the case of the bilayer structures, the if formed by alternating layer of particles with same orientations, with the outer layers having only particles oriented facing towards the walls.
III.4 Global remarks on the phase behavior for spherical caps
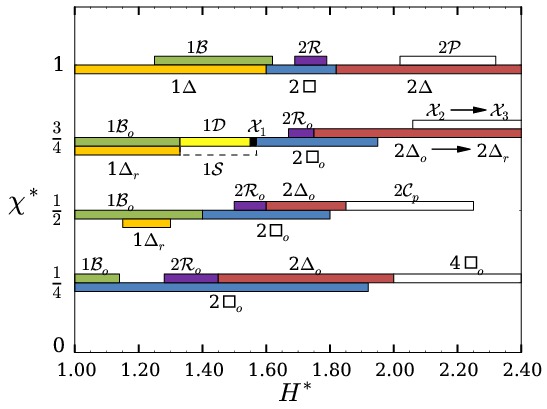
Our results are summarized in the qualitative vs. phase diagram presented in Figure 13 for the main ordered phases and the range only; they are presented in the context of the results of the confined hard-sphere system () from reference 27. Note that hard spheres particles no longer have an orientational degree of freedom and hence the phase simply becomes , becomes not (denoted as and I1 in reference 27), becomes , becomes , and phases , , and fuse into . The following trends can be observed:
-
•
Two phases that occur in all cases are the bilayers and , which are mediated, at very high densities only, by the also common phase . The lower bound in the range where the occurs tends to shift to higher values as increases, while its upper bound remains almost unchanged (at ).
-
•
For , as increases the phase gives way to the triangular monolayer (or for ). This process seems to always be mediated at high densities by the buckled phase (or for ). It appears that the and monolayers observed for system merge into the and the , respectively, as approaches 1.
-
•
For , the phase seen at with dimer formation (see Figure 12(e)) appears to be the precursor of the phase observed for , which in turn would be the precursor of the phase observed for , which (together with and at high densities only) would give way to the phase observed for . For intermediate densities, the phase observed for likely originates from the phase already occurring for ; finally, the and seen for merge into phase as .
The and phases are readily rationalized based on considerations of ordered packing of particles that (due to confinement) interact laterally with their rounded peripheries. The absence of a monolayer for the case occurs because even for the system can accommodate two layers () by the alternating flipping of particle orientations. The phase can be seen as the best packing of particles at high densities when the system confinement is such that neither a monolayer nor a bilayer would fit well. Likewise, the , , and - phases can be seen as variants of a common motif (where an intermediate layer made of “dimers” is sandwiched between two monolayers facing toward the walls) that occurs as the system tries to pack densely when the confinement ( ) is such that neither bilayers nor higher multilayer arrangements would work well.
IV Conclusions
The phase behavior for SC under strong confinement inside a slit has been mapped out using MC simulations. Depending on the particle aspect ratio and concentration, different ordered structures have been observed. The system comprising of SC with forms stable bilayers with square and triangular symmetry, and four-layer structures with square symmetry. These systems do not exhibit the formation of stable monolayers, with the exception of a very small region where a buckled monolayer is observed. The stabilization of the monolayers is only observed when the spherical surface fraction of the particles is increased. Indeed, stable buckled monolayers are observed over a wide range of densities for SC with (hemispheres) and , while stable random hexagonal monolayers are only observed for the system with . A common feature of the three particle shapes studied is that for confinements where the particles can fully rotate, the system tends to form dimers to maximize the packing of the structures. The progression of phases resulting from changes in confinement and particle aspect ratio, can be traced and fully integrated in a global phase diagram (Figure 13), which further provides a seamless connection to the known phase behavior of confined hard spheres.
The system of SC with shows a phase behavior similar to the one found experimentally for mushroom cap-shaped particles reported in reference 46, including the formation of mono and bilayers with particles having orientations parallel to the walls (side phases). The formation of these structures is only possible when the particles have a shape close to spherical. The sequence of structures observed for this system is: . Our study reveals that such SC can form other structures (at higher densities) that have not been observed in experiments yet. Some of the phase boundaries are difficult to pinpoint, and future free energy calculations can help elucidate more completely the phase diagram for these systems, and the stability of some of the structures. Attempts to obtain the structures by compression runs have met with partial success only, revealing the presence of potential kinetic traps. Elucidating the kinetics of some of these order-disorder phase transitions using specialized simulation techniques is part of our ongoing efforts.
Appendix
Simulation details
The phase diagrams for each particle shape are obtained using MC simulations, and consist of two stages. The first stage corresponds to the prediction of the densest crystal structures for each pair of parameter values (). The second stage consists of expansion runs (in the isobaric-isothermal ensemble) from the crystal structures obtained in the previous stage, and analysing the different structures observed in the system to assign their phase identity.
The calculation of the crystal structures is carried out using the so-called floppy-box Monte Carlo algorithm Filion et al. (2009); de Graaf et al. (2012). In this method, systems comprised of a small number of particles are simulated using isothermal-isobaric () ensemble MC runs, allowing the area and shape of the box in the - plane to change, keeping the height along the -direction constant Frenkel and Smit (2002). The methodology entails first the generation of a low density configuration, with particles in random positions and orientations. The system is then equilibrated at the pressure of , and subsequently compressed in steps of until the a value of is reached, and subsequent values increased by a factor of 10 until a value of is reached. In some systems, the compression between and 100 was carried out using steps of , to allow more time for the particles to reorganize, which is particularly important for confinements close to the boundaries between different crystal phases. The need of a gradual compression was also pointed out in reference 53 for the study of the crystal structures of hard-hemispheres at bulk conditions. A set of 50 to 100 of such compressions with different initial configurations are performed, and the last configuration in each compression series is recorded for post-processing analysis. Several system sizes were tested in order to ensure that the crystal structures are not affected by an insufficient number of particles during the calculation, however it was observed that using at least 4 particles per layer was enough to obtain reliable results: larger systems (more particles per layer) show similar structures as those with system of 4 particles per layer. In the post-processing analysis several order parameters were used to characterize the crystal phases. The symmetry of each layer is obtained using bond order parameters, defined as: , for 4, 6, and, 8, where is the angle made by the bond between particles and its nearest neighbor with respect to an arbitrary axis, and is the total number of nearest neighbors of particle . The calculation of the nearest neighbors is carried out using the Voronoi tesselation Allen and Tildesley (1987), except for the case , where only the four closest neighbors are used. The reason of this is to avoid the well-known problem of degeneracy in the Voronoi tessalation in square lattices. The square symmetry is easily characterized using the order parameters taking into account all the nearest neighbors Mazars (2008); however , calculated with the above definition, in combination with are useful to characterize layers with rhombic (oblique) and rectangular symmetries. In addition, the following angular order parameters were calculated: and , where is the angle between the orientation of particles and the main director. The main director of the system is obtained from the eigenvector that corresponds to the largest eigenvalue of the so-called Saupe tensor defined as: , with Low (2002). The order parameters and are useful to determine whether or not a system shows a bifurcation in the particles orientation. For example allows to distinguish between (large values of ) and (low or moderate values of ). The structures showing the higher order, measured by the aforementioned order parameters, are selected as the crystal structures, which in most of the cases also correspond to the densest structures. However, non-trivial free energy calculations may be required to unambiguously determine the most stable crystal structures for each confinement, especially to pinpoint the boundaries between different phase domains.
Once the crystal structures are determined, we proceed to perform expansion runs to obtain the phase diagram for each particle shape and confinement. As in the previous calculation, the expansion runs were carried out using MC simulations. During the simulations involving ordered structures the shape of the box is allowed to change, keeping the values of constant. The number of particles used for each system range between 600 and 700. The system is started at high pressures and subsequently expanded until the system is completely isotropic. One MC cycle is defined as moves consisting of translation moves, rotations and inversions of the particle orientations, as well as changes of the volume and/or shape of the system box. Each move is randomly selected using the following probabilities: 35% of translation moves, 35% of rotations, 25% of orientation flips, and 5% of volume change (50% of which correspond to isotropic changes and 50% for simultaneous changes of the volume and shape of the simulation box). For each state, MC cycles are used to equilibrate the system, and additional cycles, divided in 10 blocks, are used to collect ensemble averages and estimate uncertainties. Once the equilibration run for a specific state is finished, that configuration is used as a starting point for the next run at a different pressure. The location of phase transitions are identified based on discontinuities and inflexion points found in the equation of state, and in the order parameters previously defined.
Overlap algorithm for spherical caps under confinement
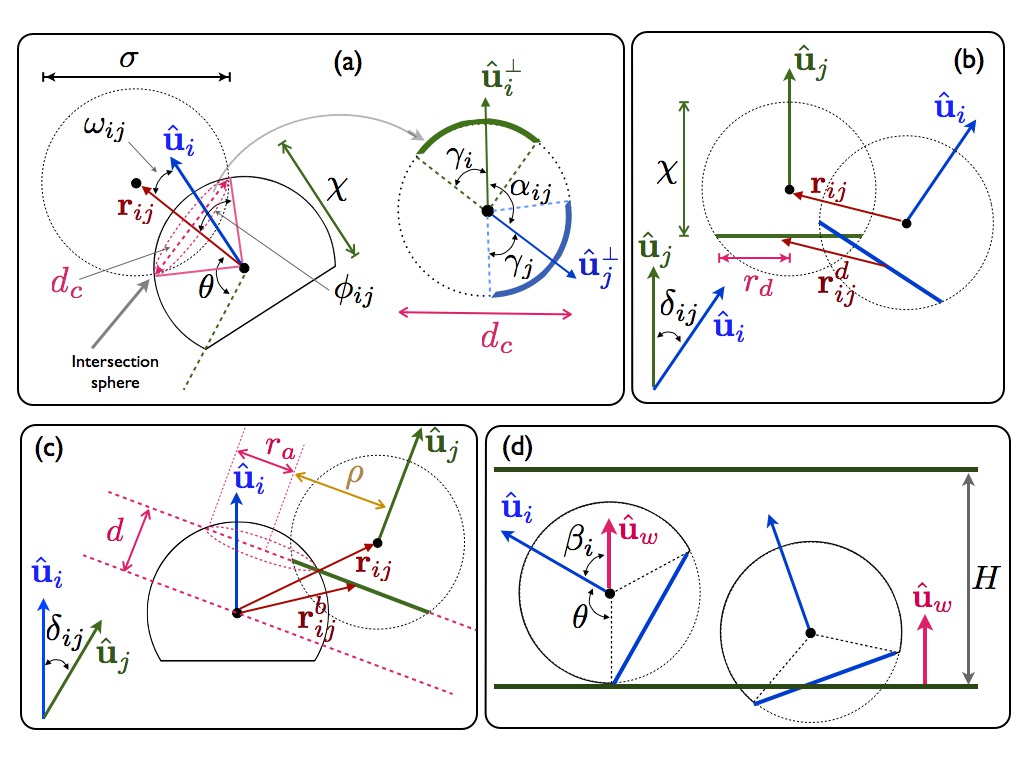
The heart of the MC simulation program is the algorithm to check for the particle-particle and particle-wall overlaps. To perform these tests, each particle is modeled as a void SC (bowl) capped with a circular disc, thus the particle-particle overlap algorithm consists of three elementary tests: bowl-bowl He and Siders (1990); Marechal and Dijkstra (2010), disc-disc Eppenga and Frenkel (1984), and bowl-disc. The particle-wall algorithm can also be separated in two elementary tests: bowl-wall and disc-wall. Sketches of the different tests for this algorithm are shown in Figure 14.
The algorithm is started by checking the overlap between the full spherical surfaces of particles and . If the distance between the centers of the spheres is larger than the diameter of the particle () then no overlap between the two particles is possible. If then the elementary tests are considered.
IV.0.1 Bowl-Bowl test
This test is similar to that in reference 53, and proceeds as follow:
-
•
Check first if the bowl of particle overlaps with the sphere of particle . For this purpose calculate the angles and , the former corresponding to the angle between the orientation of bowl , represented by the unit vector , and the interparticle vector , and the latter corresponds to half the opening angle of the cone whose vertex is the center of the sphere of particle and the base is a disc of diameter formed by the intersection of the spheres of particles and . The angle (unique for any particle type) is also calculated. These three angles, shown in Figure 14(a), are obtained from:
(A-1) (A-2) (A-3) The bowl of particle intersects with the sphere of particle if
(A-4) for or . The intersection between the two spheres of particles and is a circle of diameter . Eq. A-4 holding for both s means that the intersection of such a bowl with the sphere of the other particle is also the complete circle of diameter (see Figure 14(a)). If Eq. A-4 holds only once for one means that the intersection is an arc which is a segment of the circle of diameter . If Eq. A-4 does not hold for both and then no overlap is possible. Otherwise, if Eq. A-4 holds for both s and it holds at least once for the bowl of particle (performing a similar analysis), then an overlap exists. If Eq. A-4 holds once for each bowl, then we proceed to the following step.
-
•
Both bowls overlap if the intersecting arcs of each bowl intersect. Otherwise, the bowls do not overlap. For this, angles , , and (see Figure 14(a)) are calculated from He and Siders (1990); Marechal and Dijkstra (2010):
(A-5) (A-6) where is a vector in the plane of the intersection disc that cuts in half the intersection arc of particle , and is obtained as:
(A-7) The arcs of bowl and overlap if
(A-8)
IV.0.2 Disc-Disc test
For a spherical cap of diameter and aspect ratio , the radius of the capping disc is given by: (see Figure 14(b)). The distance between the center of the discs of particles and is . Following reference 63, the disc-disc overlap test is carried out as follow:
-
•
If the distance between the centers of discs and is larger than the diameter of the discs, , then no overlap is possible (see Figure 14(b)), otherwise the test is continued.
-
•
Calculate if the plane belonging to the disc intersects with the plane of and vice versa. If either intersection does not exist, then no overlap is possible. This test if performed calculating the distance from disc to the intersection of the planes of discs and , and it is obtained as
(A-9) and likewise for disc :
(A-10) Disc intersects the plane of disc if , and so does disc if .
-
•
If both discs intersect the planes of each other then we proceed to check if the discs overlap. Overlaps between the two discs exists if the following inequality holds:
(A-11) where is the angle between the vectors and .
IV.0.3 Bowl-Disc test
The bowl-disc overlap test is carried as follow:
-
•
The shortest distance from the center of the sphere of bowl to the plane containing the capping disc of particle is calculated (see Figure 14(c)). This distance is given by: , where is the vector from the center of the sphere to the center of disc . If then no overlap is possible. If the then we proceed to the following step.
-
•
The intersection between the plane containing the disc of particle and the sphere of particle is a circle of radius . We call the shortest distance from the center of disc to the center of the intersection circle of radius , which is denoted as and is calculated as . If then no overlap is possible.
Note that this test can be optimized by excluding some orientations that also include the bowl-bowl and disc-disc overlap tests. More specifically, if
| (A-12) |
then the bowl-disc overlap test can be avoided as this implies that disc-disc and/or bowl-bowl can occur along the bowl-disc overlap.
IV.0.4 Bowl-Wall and Disc-Wall tests
Both the bowl-wall and disc-wall overlap can be considered simultaneously in the following way:
-
•
We computer the angle between the orientation of particle and the unit normal vector perpendicular to the wall (see Figure 14(d). This angle is obtained as . If then the only check that has to be performed is the one involving the sphere of particle with the plane of the wall, i.e., if the distance from the center of the sphere to the wall is then no overlap is possible.
-
•
If and the center of the capping disc lays outside the confinement, then an overlap exists.
-
•
Check if the disc of particle and the plane of the wall overlap in analogy with with the disc-disc overlap test.
Acknowledgements
This work was supported by the U.S. Department of Energy, Office of Basic Energy Sciences, Division of Materials Sciences and Engineering under award Grant No. ER46517.
References
- Joannopoulos et al. (2008) J. D. Joannopoulos, S. G. Johnson, J. N. Winn, and R. Meade, Photonic crystals: Molding the flow of light (Princeton Univ. Press, 2008), 2nd ed.
- Xia et al. (2000) Y. N. Xia, B. Gates, Y. D. Yin, and Y. Lu, Adv. Mater. 12, 693 (2000).
- Hamley (2003) I. W. Hamley, Angew. Chem. Int. Edit. 42, 1692 (2003).
- Xia et al. (2001) Y. N. Xia, B. Gates, and Z. Y. Li, Adv. Mater. 13, 409 (2001).
- Lu et al. (2001) Y. Lu, Y. D. Yin, and Y. N. Xia, Adv. Mater. 13, 415 (2001).
- Velikov et al. (2002) K. P. Velikov, T. van Dillen, A. Polman, and A. van Blaaderen, Appl. Phys. Lett. 81, 838 (2002).
- Glotzer and Solomon (2007) S. C. Glotzer and M. J. Solomon, Nat. Mater. 6, 557 (2007).
- Yang et al. (2008) S.-M. Yang, S.-H. Kim, J.-M. Lim, and G.-R. Yi, J. Mater. Chem. 18, 2177 (2008).
- Hosein et al. (2010a) I. D. Hosein, S. H. Lee, and C. M. Liddell, Adv. Funct. Mater. 20, 3085 (2010a).
- Hosein et al. (2010b) I. D. Hosein, M. Ghebrebrhan, J. D. Joannopoulos, and C. M. Liddell, Langmuir 26, 2151 (2010b).
- Forster et al. (2011) J. D. Forster, J.-G. Park, M. Mittal, H. Noh, C. F. Schreck, C. S. O’Hern, H. Cao, E. M. Furst, and E. R. Dufresne, ACS Nano 5, 6695 (2011).
- Solomon (2011) M. J. Solomon, Curr. Opin. Colloid Interface Sci. 16, 158 (2011).
- Fung et al. (2012) E. Y. K. Fung, K. Muangnapoh, and C. M. Liddell, J. Mater. Chem. 22, 10507 (2012).
- Love et al. (2002) J. C. Love, B. D. Gates, D. B. Wolfe, K. E. Paul, and G. M. Whitesides, Nano Lett. 2, 891 (2002).
- Kim et al. (2006) J.-W. Kim, R. J. Larsen, and D. A. Weitz, J. Am. Chem. Soc. 128, 14374 (2006).
- Badaire et al. (2007) S. Badaire, C. Cottin-Bizonne, J. W. Woody, A. Yang, and A. D. Stroock, J. Am. Chem. Soc. 129, 40 (2007).
- Hernandez and Mason (2007) C. J. Hernandez and T. G. Mason, J. Phys. Chem. C 111, 4477 (2007).
- Sacanna and Pine (2011) S. Sacanna and D. J. Pine, Curr. Opin. Colloid Interface Sci. 16, 96 (2011).
- Hosein and Liddell (2007) I. D. Hosein and C. M. Liddell, Langmuir 23, 8810 (2007).
- Snoeks et al. (2000) E. Snoeks, A. van Blaaderen, T. van Dillen, C. M. van Kats, M. L. Brongersma, and A. Polman, Adv. Mater. 12, 1511 (2000).
- Löwen (2009) H. Löwen, J. Phys. Condes. Matter 21, 474203 (2009).
- Pieranski et al. (1983) P. Pieranski, L. Strzelecki, and B. Pansu, Phys. Rev. Lett. 50, 900 (1983).
- Neser et al. (1997) S. Neser, C. Bechinger, P. Leiderer, and T. Palberg, Phys. Rev. Lett. 79, 2348 (1997).
- Ramiro-Manzano et al. (2009) F. Ramiro-Manzano, E. Bonet, I. Rodriguez, and F. Meseguer, Soft Matter 5, 4279 (2009).
- Schmidt and Löwen (1996) M. Schmidt and H. Löwen, Phys. Rev. Lett. 76, 4552 (1996).
- Schmidt and Löwen (1997) M. Schmidt and H. Löwen, Phys. Rev. E 55, 7228 (1997).
- Fortini and Dijkstra (2006) A. Fortini and M. Dijkstra, J. Phys. Condes. Matter 18, L371 (2006).
- (28) Note that in reference 27 buckled phases are denoted as , however we adopt the notation following the convention used in reference 46 as the buckled structures analysed in this work are more conveniently described as monolayers.
- Wojciechowski et al. (1991) K. W. Wojciechowski, D. Frenkel, and A. C. Branka, Phys. Rev. Lett. 66, 3168 (1991).
- Lee et al. (2008) S. H. Lee, S. J. Gerbode, B. S. John, A. K. Wolfgang, F. A. Escobedo, I. Cohen, and C. M. Liddell, J. Mater. Chem. 18, 4912 (2008).
- Gerbode et al. (2010) S. J. Gerbode, U. Agarwal, D. C. Ong, C. M. Liddell, F. Escobedo, and I. Cohen, Phys. Rev. Lett. 105, 078301 (2010).
- Lee et al. (2009) S. H. Lee, E. Y. Fung, E. K. Riley, and C. M. Liddell, Langmuir 25, 7193 (2009).
- Bates and Frenkel (2000) M. A. Bates and D. Frenkel, J. Chem. Phys. 112, 10034 (2000).
- Wojciechowski and Frenkel (2004) K. W. Wojciechowski and D. Frenkel, Comp. Met. Sci. Technol. 10, 235 (2004).
- Schilling et al. (2005) T. Schilling, S. Pronk, B. Mulder, and D. Frenkel, Phys. Rev. E 71, 036138 (2005).
- Donev et al. (2006) A. Donev, J. Burton, F. H. Stillinger, and S. Torquato, Phys. Rev. B 73, 054109 (2006).
- Zhao and Mason (2009) K. Zhao and T. G. Mason, Phys. Rev. Lett. 103, 208302 (2009).
- Zhao et al. (2011) K. Zhao, R. Bruinsma, and T. G. Mason, Proc. Natl. Acad. Sci. U. S. A. 108, 2684 (2011).
- Zhao et al. (2012) K. Zhao, R. Bruinsma, and T. G. Mason, Nat. Commun. 3, 801 (2012).
- Zhao and Mason (2012) K. Zhao and T. G. Mason, J. Am. Chem. Soc 134, 18125 (2012).
- Avendano and Escobedo (2012) C. Avendano and F. A. Escobedo, Soft Matter 8, 4675 (2012).
- Atkinson et al. (2012) S. Atkinson, Y. Jiao, and S. Torquato, Phys. Rev. E 86, 031302 (2012).
- Jiao et al. (2008) Y. Jiao, F. H. Stillinger, and S. Torquato, Phys. Rev. Lett. 100, 245504 (2008).
- Cosentino Lagomarsino et al. (2003) M. Cosentino Lagomarsino, M. Dogterom, and M. Dijkstra, J. Chem. Phys. 119, 3535 (2003).
- Qi et al. (2012) W. Qi, J. de Graaf, F. Qiao, S. Marras, L. Manna, and M. Dijkstra, Nano Lett. 12, 5299 (2012).
- Riley and Liddell (2010) E. K. Riley and C. M. Liddell, Langmuir 26, 11648 (2010).
- Xu et al. (2010) L. Xu, H. Li, X. Jiang, J. Wang, L. Li, Y. Song, and L. Jiang, Macromol. Rapid Comm. 31, 1422 (2010).
- Kim et al. (2012) S.-H. Kim, A. D. Hollingsworth, S. Sacanna, S.-J. Chang, G. Lee, D. J. Pine, and G.-R. Yi, J. Amer. Chem. Soc. 134, 16115 (2012).
- Riley et al. (2012) E. K. Riley, E. Y. Fung, and C. M. Liddell, J. Appl. Phys. 111, 093504 (2012).
- Cinacchi and van Duijneveldt (2010) G. Cinacchi and J. S. van Duijneveldt, J. Phys. Chem. Lett. 1, 787 (2010).
- Veerman and Frenkel (1992) J. A. C. Veerman and D. Frenkel, Phys. Rev. A 45, 5632 (1992).
- Marechal et al. (2010) M. Marechal, R. J. Kortschot, A. F. Demirors, A. Imhof, and M. Dijkstra, Nano Lett. 10, 1907 (2010).
- Marechal and Dijkstra (2010) M. Marechal and M. Dijkstra, Phys. Rev. E 82, 031405 (2010).
- Filion et al. (2009) L. Filion, M. Marechal, B. van Oorschot, D. Pelt, F. Smallenburg, and M. Dijkstra, Phys. Rev. Lett. 103, 188302 (2009).
- Dullens et al. (2006) R. P. A. Dullens, M. C. D. Mourad, D. G. A. L. Aarts, J. P. Hoogenboom, and W. K. Kegel, Phys. Rev. Lett. 96, 028304 (2006).
- Han et al. (2008) Y. Han, Y. Shokef, A. M. Alsayed, P. Yunker, T. C. Lubensky, and A. G. Yodh, Nature 456, 898 (2008).
- de Graaf et al. (2012) J. de Graaf, L. Filion, M. Marechal, R. van Roij, and M. Dijkstra, J. Chem. Phys. 137, 214101 (2012).
- Frenkel and Smit (2002) D. Frenkel and B. Smit, Understanding Molecular Simulation (Academic Press, London, 2002), 2nd ed.
- Allen and Tildesley (1987) M. P. Allen and D. J. Tildesley, Computer Simulation of Liquids (Oxford University Press, Oxford, 1987).
- Mazars (2008) M. Mazars, Europhys Lett. 84, 55002 (2008).
- Low (2002) R. J. Low, Eur. J. Phys. 23, 111 (2002).
- He and Siders (1990) M. T. He and P. Siders, J. Phys. Chem. 94, 7280 (1990).
- Eppenga and Frenkel (1984) R. Eppenga and D. Frenkel, Mol. Phys. 52, 1303 (1984).