Theory of Nucleation in Phase-separating Nanoparticles
Abstract
The basic physics of nucleation in solid single-crystal nanoparticles is revealed by a phase-field theory that includes surface energy, chemical reactions and coherency strain. In contrast to binary fluids, which form arbitrary contact angles at surfaces, complete “wetting” by one phase is favored at binary solid surfaces. Nucleation occurs when surface wetting becomes unstable, as the chemical energy gain (scaling with area) overcomes the elastic energy penalty (scaling with volume). The nucleation barrier thus decreases with the area-to-volume ratio and vanishes below a critical size, and nanoparticles tend to transform in order of increasing size, leaving the smallest particles homogeneous (in the phase of lowest surface energy). The model is used to simulate phase separation in realistic nanoparticle geometries for \ceLi_XFePO4, a popular cathode material for Li-ion batteries, and collapses disparate experimental data for the nucleation barrier, with no adjustable parameters. Beyond energy storage, the theory generally shows how to tailor the elastic and surface properties of a solid nanostructure to achieve desired phase behavior.
Despite the widespread use of phase-separating nanoparticles for catalysis, “smart materials”, and energy storage Dresselhaus and Dresselhaus (1981); Ferrando et al. (2008); Bruce et al. (2008), their complex phase behavior is just beginning to be understood Shirinyan and Wautelet ; Tang et al. (2010); Bazant (2013). The most basic open question involves nucleation, which is difficult to observe experimentally and beyond the reach of ab initio molecular simulations. (A 20 nm nanoparticle has atoms.) It is known that surfaces are important Ferrando et al. (2008), but their precise role is unclear. In bimetallic nanoparticles, where phase transitions are triggered by changes in temperature Lee and Mori (2004), anomalous melting point depression in silica-gold core-shell nanoparticles persists to unexpectedly large particle sizes Dick et al. (2002). Enhanced interdiffusion in gold-silver core-shell nanoparticles cannot be explained by size-dependent melting point depression Shibata et al. (2002).
For Li-ion battery nanoparticles, where phase transitions occur by ion intercalation, the literature is full of contradictions. The canonical phase-separating cathode material is \ceLiFePO4, which exhibits low power in micron-sized particles Padhi et al. (1997) but can achieve very high rates in nanoparticles Wang et al. (2011). Experimental measurements of the critical overpotential to initiate lithiation vary widely from 2 mV to 37 mV Meethong et al. (2007a, b); Yu et al. (2007); Lee et al. (2009); Dreyer et al. (2010); Come et al. (2011); Zhu and Wang (2011); Safronov et al. (2011, 2012); Farkhondeh and Delacourt (2012). Size dependence has also been reported Meethong et al. (2007a); Farkhondeh and Delacourt (2012). Some experiments observe electrical signatures of nucleation and 1D growth above a critical particle size Oyama et al. (2012), while others attribute voltage hysteresis to mosaic phase separation among homogeneous particles without nucleation Dreyer et al. (2010). Some theoretical studies suggest that nucleation at surfaces leads to “intercalation waves” (moving phase boundaries) at low current Singh et al. (2008); Bai et al. (2011); Tang et al. (2011), while others describe a “solid-solution pathway” without the possibility of nucleation Malik et al. (2011).
In this article, we resolve these discrepancies by showing that nucleation in single-crystal nanoparticles is size-dependent, occurring as a result of surface adsorption that leads to coherency strain (a long-range force). This mechanism implies a nucleation barrier that decreases linearly with the area-to-volume ratio, in quantitative agreement with a wide range of experimental data. We show that the data are consistent with both phase-field Cogswell and Bazant (2012) and ab initio calculations Malik et al. (2011) that estimate a zero-current overpotential of about 35 mV in bulk \ceLiFePO4. The analysis presented in Methods is very general and could be applied to other multiphase nanostructures.
| Orientation | (100) | (010) | (101) | (011) | (201) |
|---|---|---|---|---|---|
| (mJ/m2) | 260 | -400 | -90 | 240 | 250 |
| 0 | 180 | 180 | 0 | 0 |
Surface wetting in binary solids. – The wetting of a solid surface by binary fluids is one of the most studied problems in fluid mechanics Cahn (1977); Bonn and Ross (2001); Bico et al. (2002), but a theory of surface “wetting” in binary solids, which have coherency strain, has not been developed. Wagemaker et al. Wagemaker et al. (2009); Van der Ven and Wagemaker (2009) modeled the effect of surfaces on the voltage curves and solubility limits of \ceLiFePO4, but assumed that phase boundaries form a contact angle with exterior surfaces and neglected coherency strain. Tang and Karma studied coherent spinodal decomposition at solid surfaces Tang and Karma (2012), but did not consider finite systems or dependence of surface energy on composition. Bai et al. simulated nucleation by surface wetting Bai et al. (2011), but neglected coherency strain.
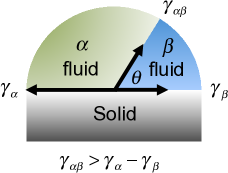
Young’s equation, , relates surface and interfacial tensions to the contact angle at a triple junction (Fig. 1(a)). Because fluid-fluid and fluid-solid interfacial energies have the same order of magnitude, all contact angles are possible in binary fluids Bonn and Ross (2001); Bico et al. (2002), including complete wetting and de-wetting ().
The surface of a binary intercalation compound involves equilibrium between two solid phases and a fluid (the electrolyte in battery). A stable triple junction () is unlikely to form between two solid phases because the excess energy of the free surface (from broken bonds) is much larger than that of a coherent solid-solid interface (from stretched bonds) (Fig. 1(b)). A rule of thumb is that coherent interfaces have , while solid surfaces have Porter et al. (2009). The change in surface energy with composition thus dominates, and one solid phase will tend to completely wet the surface. If , a contact angle will form and coherent surface spinodal states exist Tang and Karma (2012), but this is not the typical situation.
This prediction is supported by the “core-shell” structures commonly observed in bimetallic nanoparticles with the low- phase as the shell Ferrando et al. (2008), as well as by first principles calculations of battery nanoparticles. The change in surface energy by between \ceFePO4 and \ceLiFePO4 for common facets of the Wulff shape (Table 1) greatly exceeds the phase boundary energy, , inferred from the thickness of striped phases Cogswell and Bazant (2012). As a result, each crystal facet tends to be fully lithiated () or delithiated ().


Nucleation at Solid Surfaces. – Consider a nanoparticle of volume in bulk phase with a surface area wetted by molecules of phase , in metastable equilibrium with diffusional chemical potential , where corresponds to chemical (or mosaic) two-phase coexistence. In the case of lithium ion intercalation in batteries Bazant (2013); Bai et al. (2011); Cogswell and Bazant (2012), is the interfacial voltage (of electrons relative to ions ), and corresponds to mosaic phase separation across a set of homogeneous particles Dreyer et al. (2010); Ferguson and Bazant (2012). For a neutral species, can be controlled by adjusting the reservoir concentration of that species.
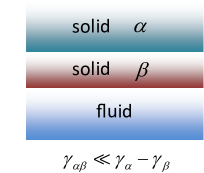
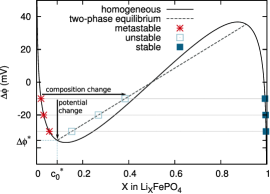
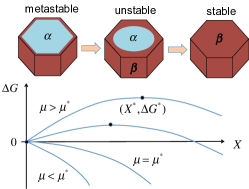
The transformation from the metastable phase to the stable phase can be nucleated by fluctuations in composition, potential or temperature (Fig. 2(a)). The nucleation barrier corresponds to the onset of (unstable) two-phase coexistence. At a critical potential, , corresponding to the coherent solubility limit, the barrier for composition fluctuations vanishes (), and the critical state is an unstable surface layer ().
With battery nanoparticles, it is straightforward to control the voltage and observe a sudden current associated with phase transformation. In this case, the bulk solid remains homogeneous at the bulk concentration until the coherent solubility limit is reached at the critical potential (Fig. 2(c)). The Gibbs free energy
| (1) |
has contributions from the homogeneous Helmholtz free energy per volume, (where is the density of intercalation sites), and the excess surface free energy of the wetted surface layer, . Setting at the critical concentration , we obtain the critical potential,
| (2) |
The critical potential in an infinite particle, , is the difference between coherent and chemical (or mosaic) solubility due to the elastic strain exerted by the wetted surface on the bulk solid, which scales with volume , as shown in Methods. Since surface energy scales with the wetted area , the critical potential decreases with particle size, , and vanishes below a critical value, , which corresponds to (Fig. 4). Below there is no barrier for transformation.
Phase-field model. – To more precisely determine and , we use the phase-field method, extended to include electrochemistry Bazant (2013); Bai et al. (2011), coherency strain Cogswell and Bazant (2012) and external surfaces Cahn (1977). Phase-field models accurately describe both homogeneous and heterogeneous nucleation Cahn and Hilliard (1959); Granasy et al. (2007). For an inhomogeneous single-crystal nanoparticle, the free energy is a functional of the intercalated ion concentration and elastic displacement field ,
| (3) | |||||
where is the surface energy as a function of surface concentration, the gradient energy coefficient, the strain tensor, and the elastic stiffness tensor. Overpotential is defined as by the phase-field theory of electrochemical kinetics Cogswell and Bazant (2012); Bazant (2013). Dynamical equations are given in Methods, and at equilibrium is minimized with .
Here we focus on the effect of surface energy, described by the natural boundary condition,
| (4) |
which is necessary to enforce Cahn (1977); Granasy et al. (2007). For the case of a binary fluid in contact with a solid, Cahn Cahn (1977) showed that Eq. 4 is a generalization of Young’s Law. For a typical binary solid (Fig. 1), the left hand side of Eq. 4 dominates, leading to complete wetting or dewetting of each facet, depending on the sign of . This can be seen by substituting Eq. 9 and performing the graphical analysis of Cahn Cahn (1977).
The properties of the critical point are derived in Methods by defining as the excess surface free energy of the adsorption layer (Fig. 2(c)) and analyzing the equilibrium conditions and . The derivation shows that is independent of system system size, leading to Eq. 2 for the critical potential. is approximated as
| (5) |
where is the elastic contribution to interfacial energy (scaling with ), is the concentration at the coherent solubility limit, and is the state of charge of \ceLi_XFePO4. For a very large system, a small amount of surface adsorption will have a negligible effect on . As the particle size decreases, however, surface adsorption significantly changes , which in turn creates an increased energy contribution from coherency strain.
Equation 1 is reminiscent of the free energy of forming a nucleus in classical nucleation theory (CNT), , but fundamentally different. CNT is an approximation applied to a growing nucleus of a few nanometers, while Eq. 2 is rigorous and applies to much larger nanoparticles with fixed size. The intercalation analogue of the classical critical radius is a binary intercalation particle at the critical size where . Bulk free energy will be dominant in particles larger than , but the phase state of particle smaller than will be controlled by surface energy. Below the critical size, the nanoparticle will exist in the homogeneous state that minimizes surface energy.
Since it is based on non-equilibrium thermodynamics Bazant (2013), our model can be used to predict the dynamics of nucleation and growth, driven by surface reactions. Phase transformation at constant current with a fixed transformation time (C rate) is illustrated in Fig. 3. At constant voltage, the transformation time depends mainly on the thermodynamic driving force, or overpotential beyond critical voltage, and only weakly on the particle size. For small driving force, the particle initially lingers near the critical point. The transformation then accelerates exponentially due to the release of elastic energy (linearly growing overpotential from the tilted voltage plateau), but a detailed theory is beyond the scope of this paper.
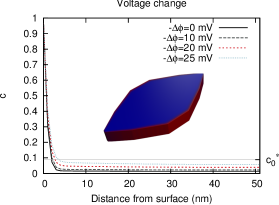
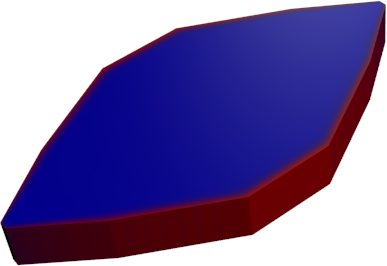
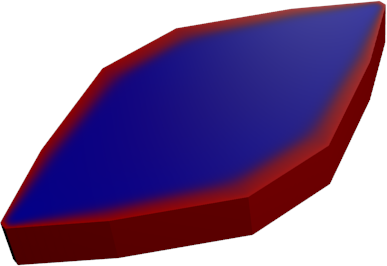
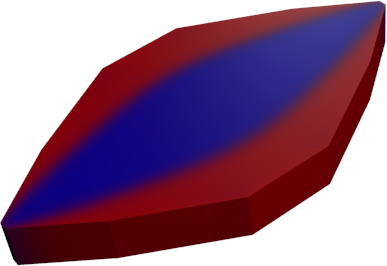
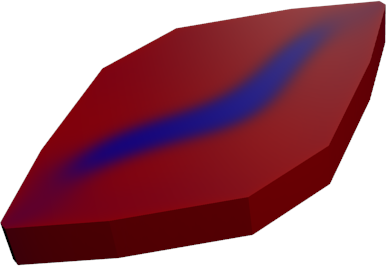
Application to \ceLiFePO4. – Parameters for the phase-field model were estimated previously by fitting a regular solution model for and a gradient energy to experimental solubility data Cogswell and Bazant (2012). Based on the fitting, a chemical solubility limit of and coherent solubility limit of were estimated, in agreement with experiment. Using these phase-field parameters and the surface energies in Table 1 (Eq. (4) reduces to Dirichlet boundaries with or with the application of Eq. 9), we consider realistic \ceLiFePO4 particle geometries characterized by Smith et al. Smith et al. (2012). Simulation of intercalation dynamics is presented Fig. 3 for particle shape C3, using the 2D depth-averaged model described in Methods Cogswell and Bazant (2012); Bazant (2013). The lithiated phase originates from the side facets, and intercalation waves Singh et al. (2008); Bai et al. (2011) propagate inward, with phase boundary orientation tending to occur along elastically preferred planes.
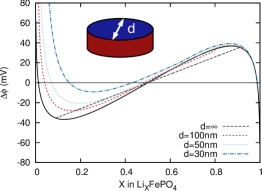
Figure 4(a) shows calculated equilibrium discharge curve for \ceLiFePO4 nanoparticles with circular cross-sections of varying diameter. The critical potential on discharging, or lithiation from a low state of charge, is reduced in smaller particles, as a result of lithium adsorption on the side facets, which competes with coherency strain to facilitate nucleation. (The same effect is not seen during charging, or delithiation from high concentration, since the 2D depth-averaged model does not model dewetting of the (010) surface.)
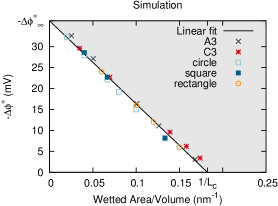
The size effect resulting from surface adsorption is calculated for a variety of particle shapes in Fig. 4(b). Each \ceLiFePO4 geometry is treated as a prism, with the lithiated side facets contributing to the wetted surface area . The calculated critical potentials are close to a master line given by Eq. 2, so the ratio is much more important than the precise shape. As shown in Methods, each surface layer is localized and planar, so its tension (energy/area) is largely unaffected by the bulk geometry.
At a critical wetted area-to-volume ratio, , the critical potential vanishes, . Below the critical size (analogous to the critical radius in classical nucleation theory), the nanoparticle becomes dominated by its surface properties, rather than its bulk properties. For prism-shaped \ceLiFePO4 particles, this corresponds to mean particle diameter, . A delithiated particle below this size will spontaneously lithiate and remain lithiated at equilibrium. Interestingly, this is the same size at which phase separation is suppressed in \ceLiFePO4 Wagemaker et al. (2011); Cogswell and Bazant (2012). It is also roughly the cutoff size for anomalous phase behavior in bimetallic nanoparticles Dick et al. (2002); Shibata et al. (2002).
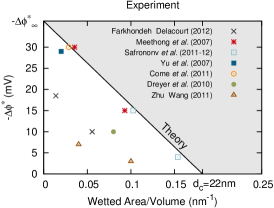
The calculations in Fig. 4(b) are compared with extensive experimental data in Fig. 4(c) without adjusting any parameters. For each experiment, is found by approximating the particles as prisms and taking to be the area of the side facets. Since the calculation represents an ideal thermodynamic limit, experimental data points are expected to lie on or below the theoretical line (Eq. 2).
The collapse of experimental data in Fig. 4(c) strongly supports the theory. No experimental points lie significantly above the simulated limit, and most lie very close to it. Some points also lie below, as expected for two reasons. Firstly, it is likely that some experiments overestimate the size of the active particles. If the system has a distribution of particle sizes, a consequence of Eq. 2 is that small particles will be transformed first at lower potentials. Therefore measuring an average particle size may not be sufficient to characterize a porous electrode. If measurements are made while only a fraction of the total capacity is cycled (as done by Dreyer et al. Dreyer et al. (2010)), the properties of the smallest particles in the system may inadvertently be measured. Secondly, defects may play an important role by reducing coherency strain and decreasing the barrier for intercalation. Meethong et al. measured different amount of retained strain in different samples Meethong et al. (2007a, b). If the amount of retained strain decreases, Eq. 2 predicts the bulk phase transformation barrier will also decrease. In the limit of zero strain, the particle will transform at the miscibility gap where .
Discussion – \ceLi_XFePO4 was initially thought to be a slow-rate material due to kinetic limitations of nucleation and growth Padhi et al. (1997). However, this hypothesis is inconsistent with the rapid rate improvements from smaller nanoparticles Bruce et al. (2008), doping to improve electrical conductivity Chung et al. (2002), and the use of exotic surface coatings Kang and Ceder (2009); Sun and Dillon (2011). These modifications are not expected to significantly alter growth kinetics.
Recently there has been a shift in thinking to the opposite extreme, with ultra-fast rate capabilities attributed to particles that never phase-separate. Malik and Ceder Malik et al. (2011) calculated a solid solution pathway using quantum Monte Carlo and argued against the possibility of nucleation and growth by applying CNT at the bulk spinodal. A significant result of phase-field theory, however, is that the nucleation barrier goes to zero – and CNT fails catastrophically – at the spinodal point, in agreement with experiment Cahn and Hilliard (1959). The argument was also based on a phase boundary energy of from ab initio calculations Wagemaker et al. (2009), which is likely more than an order of magnitude too large. We have inferred mJ/m2 from experimental morphology and solubility data Cogswell and Bazant (2012), consistent with the bound mJ/m2 for coherent interfaces Porter et al. (2009). (From a modeling perspective, this illustrates the limitations of ab initio calculations that are restricted to a few unit cells of material, often at zero temperature, although our results also demonstrate the remarkable accuracy of the ab initio bulk and surface properties, used to parameterize our phase-field theory.)
Dreyer et al. Dreyer et al. (2010) also advocated for particles that never phase separate based on the observation of a 20 mV () “thermodynamic” hysteresis \ceLi_XFePO4. Although the basic picture of mosaic phase separation may hold, we have shown that there is no unique value of the critical potential. In order to be consistent with experimental observations of coherent phase separation Cogswell and Bazant (2012), the bulk critical potential must be much larger than 10 mV, and the inferred value mV is confirmed here by an independent analysis of nucleation (Fig. 4). Indeed, the discrepancy over hysteresis can be resolved by combining our theory of nucleation with porous electrode theory based on non-equilibrium thermodynamics Ferguson and Bazant (2012), as will be reported elsewhere.
Conclusion – We have developed a quantitative phase-field theory of nucleation in single-crystal nanoparticles. A key observation is that complete “wetting” by one solid phase is typically favored at each surface, so that nucleation corresponds to the instability of a wetted surface layer. In order to overcome coherency strain, the nucleation barrier becomes a linear function of the surface-to-volume ratio, which implies that nanoparticles tend to transform in order of increasing size. The theory is confirmed by collapsing disparate experimental data for nucleation in \ceLi_XFePO4 nanoparticles, without any adjustable parameters. Beyond important applications to Li-ion batteries, however, the theory also has broader relevance for nanotechnology. It provides the basic principles to design solid nanostructures with desired phase behavior under different operating conditions, by controlling the elastic and surface properties of the component materials.
I Methods
Dynamical Model. – The mean intercalation rate at the surface is related to the local surface concentration, stress state, and overpotential by the phase-field theory of electrochemical kinetics Bazant (2013). At equilibrium, is minimized, and . To model intercalation dynamics (Fig. 3), we assume reaction limitation for anisotropic \ceLiFePO4 nanoparticles (with fast diffusion and no phase separation along the [010] crystal axis and negligible diffusion along the [100] and [001] axes) and solve the electrochemical Allen-Cahn reaction equation Bazant (2013); Singh et al. (2008); Bai et al. (2011); Cogswell and Bazant (2012),
| (6) |
for the depth-averaged concentration over the active (010) facet. The right side of Eq. 6 is a generalized Butler-Volmer rate for symmetric electron transfer, where is the exchange current per area Bazant (2013). Stochastic intercalation is modeled with Langevin noise , which facilitates nucleation or spinodal decomposition Cogswell and Bazant (2012); Bai et al. (2011). The strain field is determined by mechanical equilibrium, , and zero surface traction, , for a solid particle in a liquid electrolyte Cogswell and Bazant (2012); Tang et al. (2011).
Derivation of the Critical Potential. – For functionals that do not depend explicitly on , the Beltrami Identity is an integrated form the the Euler equation that applies at equilibrium in 1D systems. Application of this relation to Eq. 3 produces:
| (7) |
where is a constant whose value can be determined by considering the boundary condition at , which is stress-free and . Thus , where is the bulk concentration in equilibrium with . Solving Eq. 7 for the gradient energy produces:
| (8) |
where , and . Solving Eq. 8 for produces:
| (9) |
The excess free energy of the adsorption layer Cahn (1977) (which differs from the surface energy ) is the difference in energy between a homogeneous system and a system with the adsorption layer:
| (10) |
Substitution of Eq. 8 to eliminate the gradient energy leads to:
| (11) |
which is minimized at equilibrium. Eq. 9 can be used to change the variable of integration in Eq. 11 from to :
| (12) |
For an adsorption layer at a surface in a semi-infinite system, the elastic energy can be approximated as Cahn (1961). The stability of the adsorption layer is related to the sign of , and is maximized when :
| (13) |
The equilibrium condition can be applied in the bulk, far from the interface:
| (14) |
which is the common tangent construction for coherent binary solids Cahn (1961). Thus the adsorption layer will become unstable and grow at the coherent solubility limit (miscibility gap). The energy needed to reach the coherent solubility limit is the barrier energy to initiate transformation of the particle.
The dependence of the surface excess on the size of the system can be determined by examining the sign of , which is found using the fundamental theorem of calculus:
| (15) |
Since the boundary condition at is stress-free and :
| (16) |
Thus is independent of the system size .
From Eq. 10, we can see that:
| (17) |
The terms inside the integral are constants, and the integral can be evaluated:
| (18) |
Now set for and solve for :
| (19) |
| (20) |
where is the concentration at the coherent solubility limit, determined by the coherent common tangent construction (Eq. 14).
II Acknowledgements
Acknowledgements.
We are grateful to Kyle Smith for providing advice on \ceLiFePO4 particle geometries and for kindly sharing his Matlab code with us. This work was supported by the National Science Foundation under Contracts DMS-0842504 and DMS-0948071 and by a seed grant from the MIT Energy Initiative.References
- Dresselhaus and Dresselhaus (1981) M. Dresselhaus and G. Dresselhaus, Advances in Physics 30, 139 (1981), also reprinted as Advances in Physics 51 (2002) 1.
- Ferrando et al. (2008) R. Ferrando, J. Jellinek, and R. L. Johnston, Chem. Rev. 108, 845 (2008).
- Bruce et al. (2008) P. Bruce, B. Scrosati, and J.-M. Tarascon, Angewandte Chemie 47, 2930 (2008).
- (4) A. S. Shirinyan and M. Wautelet, Nanotechnology 15, 1720.
- Tang et al. (2010) M. Tang, W. C. Carter, and Y.-M. Chiang, Annu. Rev. Mater. Res. 40, 501 (2010).
- Bazant (2013) M. Z. Bazant, Accounts of Chemical Research ASAP (2013).
- Lee and Mori (2004) J. G. Lee and H. Mori, Phys. Rev. Lett. 93, 4 (2004).
- Dick et al. (2002) K. Dick, T. Dhanasekaran, Z. Y. Zhang, and D. Meisel, J. Am. Chem. Soc. 124, 11989 (2002).
- Shibata et al. (2002) T. Shibata, B. A. Bunker, Z. Y. Zhang, D. Meisel, C. F. Vardeman, and J. D. Gezelter, J. Am. Chem. Soc. 124, 11989 (2002).
- Padhi et al. (1997) A. K. Padhi, K. S. Nanjundaswamy, and J. B. Goodenough, J. Electrochem. Soc. 144, 1188 (1997).
- Wang et al. (2011) Y. Wang, P. He, and H. Zhou, Energy Environ. Sci. 4, 805 (2011).
- Meethong et al. (2007a) N. Meethong, H.-Y. S. Huang, W. C. Carter, and Y.-M. Chiang, Electrochem. Solid-State Lett. 10, A134 (2007a).
- Meethong et al. (2007b) N. Meethong, H.-Y. Huang, S. Speakman, W. Carter, and Y.-M. Chiang, Adv. Funct. Mater. 17, 1115–1123 (2007b).
- Yu et al. (2007) D. Y. W. Yu, C. Fietzek, W. Weydanz, K. Donoue, T. Inoue, H. Kurokawa, and S. Fujitani, J. Electrochem. Soc. 154, A253 (2007).
- Lee et al. (2009) K. T. Lee, W. H. Kan, and L. F. Nazar, J. Am. Chem. Soc. 131, 6044 (2009).
- Dreyer et al. (2010) W. Dreyer, J. Jamnik, C. Guhlke, R. Huth, J. Moskon, and M. Gaberscek, Nat. Mater. 9, 448 (2010).
- Come et al. (2011) J. Come, P. L. Taberna, S. Hamelet, C. Masquelier, and P. Simon, J. Electrochem. Soc. 158, A1090 (2011).
- Zhu and Wang (2011) Y. J. Zhu and C. S. Wang, J. Power Sources 196, 1442 (2011).
- Safronov et al. (2011) D. V. Safronov, I. Y. Pinus, I. A. Profatilova, V. A. Tarnopol’skii, A. M. Skundin, and A. B. Yaroslavtsev, Inorg. Mater. 47, 303 (2011).
- Safronov et al. (2012) D. V. Safronov, S. A. Novikova, A. M. Skundin, and A. B. Yaroslavtsev, Inorg. Mater. 48, 57 (2012).
- Farkhondeh and Delacourt (2012) M. Farkhondeh and C. Delacourt, J. Electrochem. Soc. 159, A177 (2012).
- Oyama et al. (2012) G. Oyama, Y. Yamada, R.-i. Natsui, S.-i. Nishimura, and A. Yamada, J. Phys. Chem. C 116, 7306 (2012).
- Singh et al. (2008) G. Singh, D. Burch, and M. Z. Bazant, Electrochimica Acta 53, 7599 (2008).
- Bai et al. (2011) P. Bai, D. A. Cogswell, and M. Z. Bazant, Nano Lett. 11, 4890 (2011).
- Tang et al. (2011) M. Tang, J. F. Belak, and M. R. Dorr, J. Phys. Chem. C 115, 4922 (2011).
- Malik et al. (2011) R. Malik, F. Zhou, and G. Ceder, Nat. Mater. 10, 587 (2011).
- Cogswell and Bazant (2012) D. A. Cogswell and M. Z. Bazant, ACS Nano 6, 2215 (2012).
- Wang et al. (2007) L. Wang, F. Zhou, Y. S. Meng, and G. Ceder, Phys. Rev. B 76, 165435 (2007).
- Smith et al. (2012) K. C. Smith, P. P. Mukherjee, and T. S. Fisher, Phys. Chem. Chem. Phys. 14, 7040 (2012).
- Cahn (1977) J. W. Cahn, J. Chem. Phys. 66, 3667 (1977).
- Bonn and Ross (2001) D. Bonn and D. Ross, Rep. Prog. Phys. 64, 1085 (2001).
- Bico et al. (2002) J. Bico, U. Thiele, and D. Quere, Colloid Surface A 206, 41 (2002).
- Wagemaker et al. (2009) M. Wagemaker, F. M. Mulder, and A. Van der Ven, Adv. Mater. 21, 2703 (2009).
- Van der Ven and Wagemaker (2009) A. Van der Ven and M. Wagemaker, Electrochem. Commun. 11, 881 (2009).
- Tang and Karma (2012) M. Tang and A. Karma, Phys. Rev. Lett. 108, 265701 (2012).
- Porter et al. (2009) D. A. Porter, K. E. Easterling, and M. Y. Sherif, Phase Transformations in Metals and Alloys (CRC Press, 2009) pp. 141–146, 181–192.
- Ferguson and Bazant (2012) T. R. Ferguson and M. Z. Bazant, J. Electrochem. Soc. 159, A1967 (2012).
- Cahn and Hilliard (1959) J. W. Cahn and J. E. Hilliard, J. Chem. Phys. 31, 688 (1959).
- Granasy et al. (2007) L. Granasy, T. Pusztai, D. Saylor, and J. A. Warren, Phys. Rev. Lett. 98, 035703 (2007).
- Wagemaker et al. (2011) M. Wagemaker, D. P. Singh, W. J. Borghols, U. Lafont, L. Haverkate, V. K. Peterson, and F. M. Mulder, J. Am. Chem. Soc. 133, 10222 (2011).
- Chung et al. (2002) S. Y. Chung, J. T. Bloking, and Y. M. Chiang, Nat. Mater. 1, 123 (2002).
- Kang and Ceder (2009) B. Kang and G. Ceder, Nature 458, 190 (2009).
- Sun and Dillon (2011) K. Sun and S. J. Dillon, Electrochem. Commun. 13, 200 (2011).
- Cahn (1961) J. W. Cahn, Acta. Metall. 9, 795 (1961).