University of Central Florida
4000 Central Florida Blvd, Orlando FL 32816
11email: {skhan, lboloni}@eecs.ucf.edu
Agent-based modeling of a price information trading business
Abstract
We describe an agent-based simulation of a fictional (but feasible) information trading business. The Gas Price Information Trader (GPIT) buys information about real-time gas prices in a metropolitan area from drivers and resells the information to drivers who need to refuel their vehicles.
Our simulation uses real world geographic data, lifestyle-dependent driving patterns and vehicle models to create an agent-based model of the drivers. We use real world statistics of gas price fluctuation to create scenarios of temporal and spatial distribution of gas prices. The price of the information is determined on a case-by-case basis through a simple negotiation model. The trader and the customers are adapting their negotiation strategies based on their historical profits.
We are interested in the general properties of the emerging information market: the amount of realizable profit and its distribution between the trader and customers, the business strategies necessary to keep the market operational (such as promotional deals), the price elasticity of demand and the impact of pricing strategies on the profit.
1 Introduction
In this paper we describe an agent-based simulation of a fictional (but feasible) information trading business. The Gas Price Information Trader (GPIT) buys information about real-time gas prices in a metropolitan area from drivers, and resells this information to drivers who need to refuel their vehicles. An autonomous agent, potentially integrated with the vehicle’s onboard control system, can in the near future perform all the actions associated with the driver, including the acquisition of gas prices, selling and buying information and negotiating with the trader.
Similar systems have been proposed previously [2, 6], online webpages tracking gas prices currently exist (the ad-supported GasBuddy and GasPriceWatch in the United States, the government-run FuelWatch in Western Australia). These are related in spirit and operation to a large number of applications proposed in the field of urban computing / citizen computing, which can be similarly construed as information trading. While feasibility has been repeatedly demonstrated, many of these systems have not been, in general, deployment successes. We argue that the low deployment is due to the fact that voluntary participation can be only maintained for projects with emotional and political impact. Projects involving the environment, pollution, conservation can gather significant following. A gas price reporting system, however, does not have an emotional motivation for contribution, increasing the chance of free riding.
Instead of relying on voluntary participation, our system relies on the self interest of the participants. We assume that the business is stable only if all the participants profit financially over the long run. We are interested in the overall market dynamics of the system.
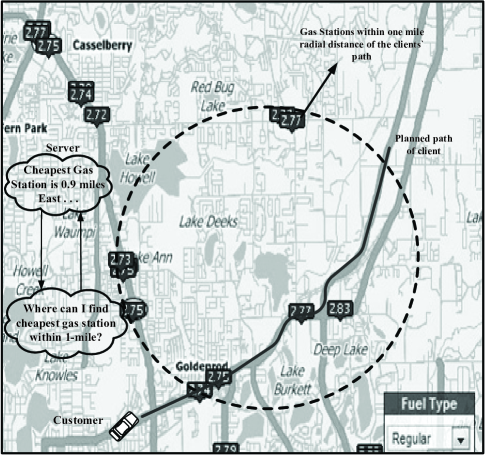
To illustrate the operation of the system, let us consider the example in Figure 1. A driver travels from work to home along the marked path. Near Lake Burkett, the car signals low fuel. The driver has several nearby choices for refueling: some of them are on his planned path, while others require short detours. He contacts the GPIT and requires information about the cheapest option in the vicinity. The GPIT obtains this information from its local database which contains information it has acquired ahead of time from drivers. It will provide this information for a price, which will be negotiated in real time.
Let us summarize the interests of the parties in this economic model:
-
i)
The revenue of the GPIT is earned by selling information about the most advantageous gas buying location near a trajectory. It incurs the cost of buying the information necessary to keep the database up to date. The GPIT tries to maximize its profits over the long term.
-
ii)
The drivers, in the role of clients, are acquiring information to save on the cost of gas. The amount of savings depends on many parameters: the variation of the price among gas stations, the detour necessary to reach the cheaper gas, the size of the gas tank, and so on. The savings are always relative to the drivers default preference: if the GPIT instructs the driver to go to the gas station where it would have gone anyhow, the savings are zero.
The cost of the information will be negotiated by the driver and the GPIT. The challenge here is that the parties need to negotiate without knowing the savings which will be provided by the information.
The fact that the information was worthless in one instance does not guarantee that it will be the same the next time around as well. Our approach will be to allow the client to estimate its savings considering a longer history, and to evaluate the benefits of dealing with the GPIT over a longer timeframe as well.
-
iii)
Drivers selling price information to the GPIT are trying to maximize their income. Their costs are the cost of making the observation, communication costs and the cost of privacy (as they need to disclose their location and verify their identity).
From the point of view of the cost structure of its business, the GPIT is similar to a software company: it has an initial cost to acquire the information, but subsequently, it can sell it an arbitrary number of times, without incurring further costs (as long as the database is accurate).
What makes the GPIT business challenging is the difficulty in determining the utility of the information to the user, the very large variation of the utility from user to user, and, as we shall see, the variation of the utility over time periods as well.
These considerations require us to consider a system where the cost of information is determined on a case by case basis, by a short negotiation process between the user and the GPIT. Not all negotiations will be successful. In fact, there will be clients who will effectively drop out from the system. This will happen if the clients estimate the utility of the information provided by the GPIT to be zero (considering the driving habits and location of the client). The subset of clients who will regularly purchase information depends on the pricing and negotiation strategy of the GPIT. As we shall see, specific long term pricing strategies such as promotional offers are also an important part of the system.
To understand the behavior of this system, we need a detailed simulation. The system is only functional if it provides long term profits to all its participants. But the profits of participants can depend on very arcane details: the driving habits of the user, the variation of gas prices in a specific area, the default fueling habits, the geographical distribution of the gas stations, the estimate of the GPIT of the user’s profits, and so on. We also need to consider the social behavior of the user: will it even consider negotiating again if for several consecutive times the information was useless?
This paper presents the description and experimental validation of such a detailed simulation. We use real world geographic data, lifestyle-dependent driving patterns and vehicle models to create an agent-based model of the drivers. We use real world statistics of gas price fluctuation to create scenarios of temporal and spatial distribution of gas prices. The price of the information is determined on a case-by-case basis through a simple negotiation model. The trader and the customers are adapting their negotiation strategies based on their historical profits.
We are interested in the general properties of the emerging information market: the amount of realizable profit and its distribution between the trader and customers, the business strategies necessary to keep the market operational (such as promotional deals), the price elasticity of demand and the impact of pricing strategies on the profit.
The remainder of this paper is organized as follows. Section 2 discusses the source of profits in the system. Section 3 describes the negotiation protocol and the strategies used by the agents. Section 4 describes the modeling of the environment and the market. An experimental study is shown in Section 5. Section 6 discusses related work.
2 The source of the profits
As we discussed, the economic framework of the GPIT requires that all the participants profit. Furthermore, all the participants express their profits in financial term (not in goods or utility). This requires that the system has a constant inflow of money.
The money in our system comes from the lost profits of gas stations. More specifically, the gas stations will loose those profits which are due to the customers lack of information about the variation of prices in time which are not consistent with the spatial distribution and perceived quality.
Note that the lack of information is not always the reason for a customer to choose more expensive gas. Sometimes we have a major brand with a local discount station next to each other, with different advertised prices visible for both. Both of them have clients because some clients are willing to pay for better services and/or for better perceived quality of gas. This kind of price difference is not a source of income for our system.
Similarly, temporal price variations which do not produce a reversal in the ranking of optimal fueling station are also not a source of profit. If a specific gas station is always the cheapest, this information has no financial worth for a recurring customer.
Let us consider an example where a gas station realizes profits based on the lack of information of its customers. Many airports are surrounded by gas stations which charge a substantial premium over the prices prevalent in the metropolitan area. These gas stations take advantage of the car rental companies’ requirements that the rental cars be returned with a full tank.
The rental car customers are frequently not well acquainted with the area and have difficulty identifying the closest gas station with advantageous prices. This lack of information is an important component of the gas station’s pricing strategy; there are examples [9] of a gas station suing the city for the right not to post its prices.
The major price differences for the airport gas stations are an extreme case. Yet, statistical data shows that gas prices offer sufficient temporal and spatial variability to provide an income to the GPIT economic system.
It is unclear whether the changing shopping patterns in a zone where a large majority of buyers use the GPIT system would eliminate the arbitrage opportunity. There is a reason to assume that only a subset of drivers would participate in such a system, which would keep the information trading opportunities functional.
3 Negotiating the price of information
3.1 The negotiation protocol
Let us consider a customer taking daily trips dictated by its schedule and lifestyle, gradually exhausting the fuel in his car. When the quantity of fuel drops below a certain level the customer will look for a gas station to refuel. The current location and planned path of the customer has a significant impact on which gas stations are the best refuelling choice.
To save on the cost of fuel by choosing the optimal gas station, the driver contacts the GPIT, sends its location, planned path, and requests information about the optimal gas station at the same time making a price offer . The GPIT calculates this information and replies with a counter offer .
The negotiation will consist of a series of exchanged offers . If the kth negotiation was successful, it will conclude with a deal . In this case, the client will pay dollars to the GPIT, and the GPIT will deliver the information to the client (who will use it to choose the gas station to refuel). If the negotiation concludes with the conflict deal, no money or information is exchanged and the client will refuel at the first gas station on its projected path. A full negotiation round without concession from either side breaks the negotiation.
3.2 The customer’s negotiation strategy
The negotiation strategy of the client is a monotonic, uniform concession with reservation price. The first offer made by the client is at , it will uniformly concede with a concession rate until it reaches the reservation price , at which point it will insist on its offer.
The customer’s negotiation strategy is framed by its expectations of benefits. At the beginning of the negotiation the client will set a reservation price which is the maximum limit it is willing to pay for the information. A natural limit would be the benefit the user could acquire at this moment: yet, not having an information about the gas prices, the user can not exactly know this information.
The user estimates that the information provided by the GPIT will save, in average, the same amount it has saved in the past. It is not, however, a good idea to set the reservation price to the exact estimate, because this will terminate some negotiation which, after the real savings have been computed, would have turned out to be profitable. With this strategy, the deal is .
The conflict offer set by the customer is twice the initial offer and is normally distributed around the initial offer, i.e., where where = 0 and = 1. Therefore, the cost of a deal is given as
At the start of each negotiation the initial offer is dependent upon the previous negotiations with the GPIT:
| (1) |
where = 0.125 bounds the initial offer to increment within one fourth of previous negotiated deal. The limitation of the amount of history is justified by the experimental fact that while recent negotiation experience can be a good predictor of the current negotiation, older negotiations are not.
A parameter limits the size of such that the agent does not start with a too high initial offer.
3.3 The trader’s negotiation strategy
The GPIT also uses a reservation price-based monotonic concession model as its negotiation strategy. Its reservation price and concession step is determined for each client and each negotiation using an adaptive learning process which considers the history of previous negotiations. It uses exponential smoothing to give more weight to the recent deals. Exponential moving average helps smooth out the previous deals and provides GPIT with a trend following indicator for the future negotiations. The initial offer from GPIT in start of negotiation is
| (2) |
where m = 0.125 and is the exponential moving average of previous deals:
| (3) |
where, there control factor is chosen as = 2 / providing more weight to the recent negotiation.
If a customer is satisfied with the savings provided by the deals in preceding negotiations, it will concede more in following negotiations. To model the gradual change in the customers’ concession, the GPIT uses Moving Average Convergence Divergence (MACD) [1]. This indicator provides a histogram with the help of which GPIT estimates the concession behavior of the customer. The histogram is obtained by computing the difference of two EMAs (of different weights) against an EMA of the difference. The signal , i.e., difference between two EMAs is given as:
| (4) |
The choice of using EMA’s of period 9 and 15 provide us with two different windows required to compute the recent shift in momentum of negotiations. Evaluating with brackets of 9 and 15 takes-in consideration the current negotiations as well negotiations preceding it and these values have been determined experimentally to provide a good match of the customer behavior (in stock market analysis the values of 9, 12 and 26 day moving averages are used). The concession step of GPIT is dependent upon and is given as
| (5) |
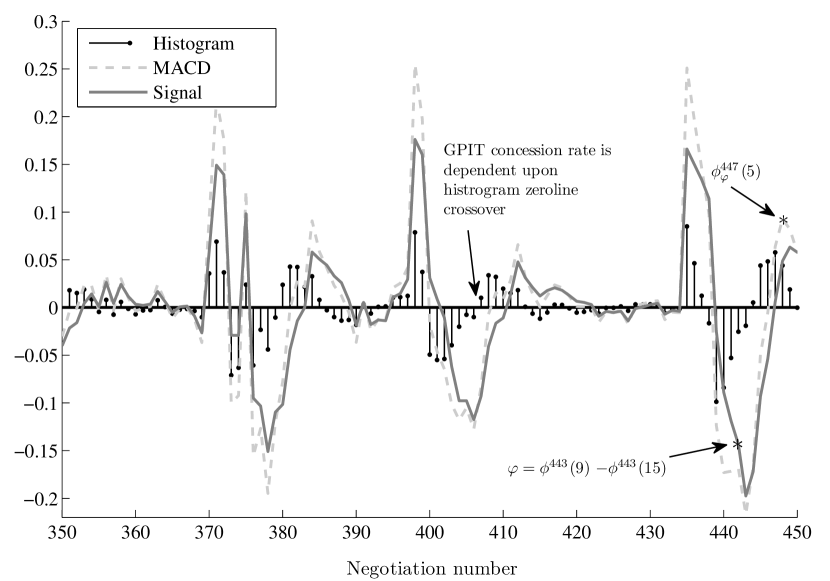
In Figure 2, the signal shows the corresponding divergence or convergence of the faster reactive EMA from slower reactive EMA . MACD histogram models the gradual shift of the customer behavior and outputs a positive indication on histogram if the customer is conceding more. The GPIT responds to the faster concession rate of the customer by lowering its own concession rate according to Equation 5 (and the reverse).
4 Environment modeling
As we have outlined, the economic model of GPIT is highly sensitive to the environment conditions under which it operates. Profit margins are thin, at best, the service might be useless for some clients, and depending on certain, rather subtle conditions, the whole economic model might be inoperable.
To account for these factors, the environmental conditions under which the system operates have been modeled based on real world data (and extrapolations of it) and at a relatively high level of detail.
4.1 Modeling geography
We have chosen to model a relatively large area of East Orlando. This area has a number of employers in education and high tech industry, as well as residential, shopping and recreation areas. It is a “driving city”: public transportation options are virtually non-existent, the distances between areas are large and the zoning restrictions frequently prevent the building of mixed use areas.
Our simulation uses the real world location of major employers in the area, major residential and shopping areas. These areas have been identified as locations on Google Maps. The exact locations of the gas stations have been also entered in the database. Driving directions and trip times have been acquired from the Google Maps. The simulator was directly contacting the web service, parsing the returned KML files, and caching them locally for reuse.
4.2 Modeling lifestyle
The lifestyle of East Orlando residents consists of well distinguished time periods spent at distinct locations, and driving between them. We have modeled the lifestyle of our simulated clients by randomly assigning them workplaces and residences. The clients were assumed to have an 8-to-5 work schedule on weekdays, not going to work on weekends, and a randomly distributed set of other activities in the remaining time.
4.3 Scenario generation
The simulation of the economic system starts with a baseline scenario containing the movement patterns of the clients, over the course of a year, assuming that no refueling is needed. We assume that the variations of the price of the fuel do not impact the in-city driving patterns of the users.
Running the economic model on this scenario will add the refueling times, occasionally inserting small detours necessary to find the cheapest gas station.
The generated scenario is implemented as a series of events which represent driving activities happening at specific locations and time.
Each event is described by (a) the participating agent, (b) the event type, (c) the location, (d) the timestamp and (e) the distance travelled since the previous event. An example subset of the scenario is shown in Listing 1.
The following event types are supported:
-
-
“departs”: the client departed a location
-
-
“arrives”: the client arrived at a location
-
-
“sees”: the client passes near a landmark (typically, for our simulation, a gas station
-
-
“needs”: the vehicle needs fuel. This event is not in the baseline scenario, but it is generated by the simulator
The location of the event is described by identifiers with standard prefixes. These identifiers are then mapped to geographical locations by a separate database. The prefix identifies the type of the location as follows: W - work, S - Shopping, R - residential, STA - gas station.
The travel distance, used for “arrives” events, is calculated using Google Maps queries for a suggested route from the latest departure location to the current arrival location. The “sees” events are generated by comparing the landmarks of STA type against the generated path.
The simulator maintains the quantity of gas available for the cars assuming a fuel tank of 15 gallons, an average consumption of 25 miles/gallon. The “needs” event is generated whenever the available fuel dips below 2 gallons. The location of the “needs” event depends on the negotiation process with the GPIT, the position of the refuelling and the possible detours taken by the drivers to refuel. We assume that the driver always completely refills the tank.
4.4 Modeling gas prices
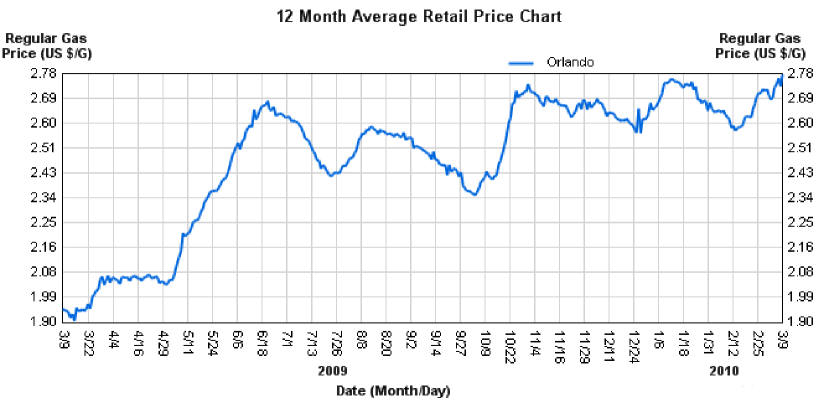
We have acquired our gas prices from the website GasBuddy.com, which works as an urban portal for people who can participate in posting and reviewing gas prices. Based on these prices (see Figure 4), we were able to generate a number of fictional scenarios. To extrapolate the values we used a technique to scale the spatial variance of the gas prices with an arbitrary factor, and added a Gaussian noise component.

5 Experimental study and results
Our aim is to perform agent-based simulations to observe the general properties of the information market. The GPIT simulator operates on the assumption that every customer contacts the GPIT when gas refill is required. For analyzing the properties related to information market and GPIT we performed simulations, observing the following quantities:
-
•
Total income for the server
-
•
The agreement price of negotiations
-
•
Number of successful negotiations
5.1 Dynamic pricing analysis
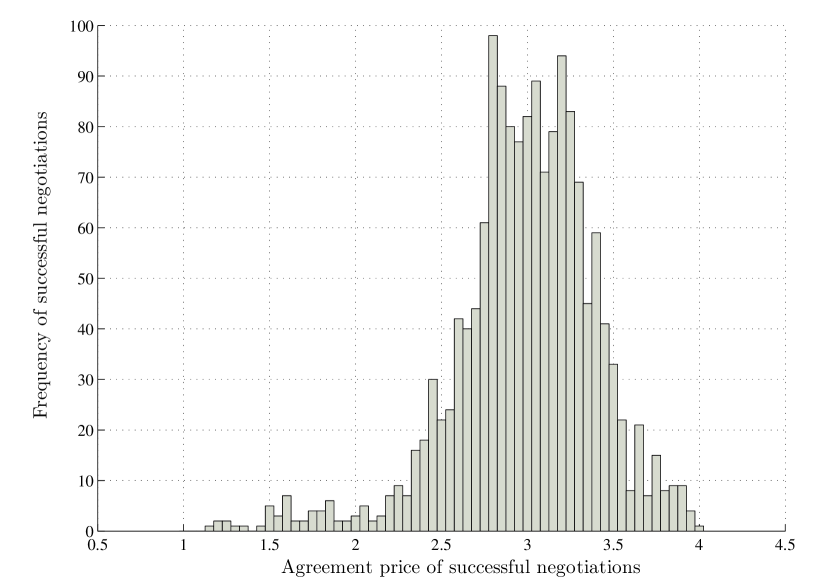
Our first series of experiments verify if the dynamic price formation mechanism operates as expected. Our expectation is that the strategies deployed by the customers and the trader interact in such a way that they will agree on a price level where both the customers and the trader will profit over the long run. Figure 5 shows the histogram of the distributions of the agreed price for successful negotiations. We find that the prices show a relatively wide distribution around the value of $3 / information. This is consistent with the variation of the gas prices and the potential savings of the customers filling their 15 gallon gas tanks.
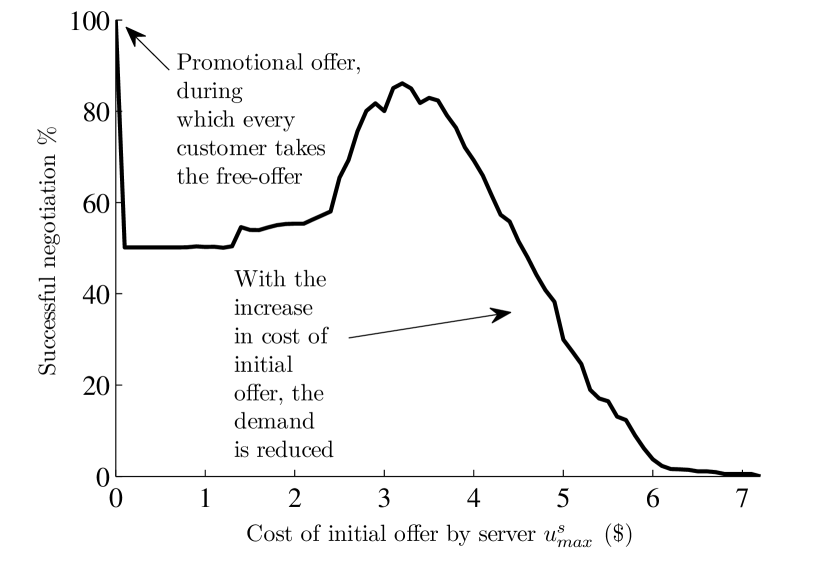
5.2 Price elasticity analysis using fixed initial price
Figure 6 shows the ratio of successful negotations for a fixed initial offer by the trader ranging in the interval . The conflict offer was set to = , and the concession rate was fixed at = 0.25.
For the information offered for free (i.e. the promotional offer), the negotiation is always successful. Paradoxically, the highest success ratio is obtained at initial price settings which match the approximately $3 value which is the average value of the dynamically determined price.
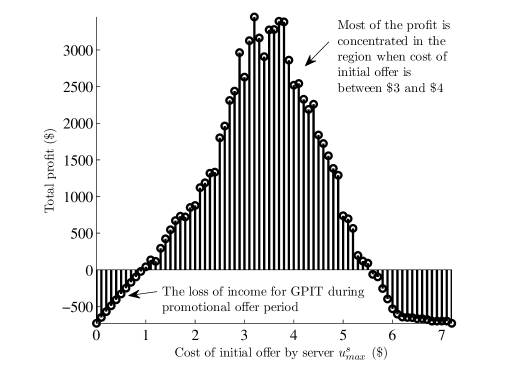
5.3 Profits obtained using fixed prices
Figure 7 shows the profits of the trader obtained using a fixed initial offer. We observe the rachet effect [7] where even at higher prices some customers are willing to pay for the price of information yet the total profit is very low. If we compare the profits that are obtained using dynamic pricing as seen in Figure 5, we see that it is not feasible for the GPIT to operate using non-variable prices.
6 Related work
6.1 Agent-based markets
Kasbah [4] developed by MIT Labs, was one of the first and simplest agent based market in which customers delegate agents on their behalf to do one-to-one negotiations for market goods. In [3] the same group used a slightly modified version of their previous market-place implementation and performed real-life experiments. Sim [12, sim2002market] discusses a model for negotiating agents that is driven by dynamic markets. In his framework, he argues that dynamic-market requires different tactics when compared to static market and hence, variable adapting behavior should incorporated for dynamic-market. The authors of Genoa [11] provide an agent based simulated financial market place. They assign certain probabilities to a trader for buying or selling. The traders are merged using graph theory, where any pair of randomly selected traders form a cluster. The decision of agent in this market is constrained by avaliable resources where the total avaliable cash is conserved. NetBazaar [14] provides a distributed marketplace for information products. Besides providing an infrastructure for information market they have also provided the support of federation. The main idea behind federation is to link different trade systems for information sharing and perform trading on behalf of each other. An agent based urban economic market is presented in [10]. The design involves interaction between multiple customers and sellers where the price is based on variance in neighbourhood locality and other factors like spatial properties. An agent based commodity trading scenario was demonstrated by authors in [5]. Though the authors were able to simulate the market scenario based on a single commodity yet it lacked the real world data. The simulations were completely based on fictitious values by using statistical methods.
6.2 Price discrimination in information markets
Varian [15] discusses different forms of price discrimination that takes place in an information market. Initially he discusses “mass customization” or “personalization” where price of information is solely dependent upon a monopolist seller. Amazon was accused of using similar variable pricing [8]. The second type of discrimination also known as “product line pricing”, “versioning” or “market segmentation” uses the distribution of consumers feedback for conditioning the price. The third discrimination is widely used and based upon selling information at different prices to different groups. We use the form of price discrimination that is based on conditioning using deal price history [7].
6.3 Promotional offers in information markets
Promotional offers holds significance in information marketplace [13]. Promotional offers involve a considerable amount of investment to gain attention of desired customers. This can subsequently turn into profits if customers find the information useful.
7 Conclusion
This paper described the agent-based simulation of an information trading business where a trader agent buys and sells information about savings opportunities in gas prices. This is a low margin business where only a subset of customers can benefit from the savings opportunity, and only with a favorable rate of the information cost. Our our approach was to model the system in relatively high detail, including the geography of the area, the lifestyle choices of the customers, the spatial and temporal distribution of the gas prices. We have assumed that the agents are negotiating the price of the information on a case-by-case basis; their negotiation strategy is affected by their negotiation history. A promotional offer is used to establish the initial history necessary for efficient negotiation.
Our experimental study shows that the proposed economic model is viable. The negotiation approaches, as designed, are efficient in finding the price ranges which ensure profits for both the trader and the clients, and the price/profit curve shows stable shapes with a maximum profit for the trader for a price of information around $3.
References
- [1] G. Appel. The Moving Average Convergence Divergence Method. Great Neck, NY: Signalert, 1979.
- [2] N. Bulusu, C. Chou, S. Kanhere, Y. Dong, S. Sehgal, D. Sullivan, and L. Blazeski. Participatory sensing in commerce: Using mobile camera phones to track market price dispersion. In Proceedings of the International Workshop on Urban, Community, and Social Applications of Networked Sensing Systems (UrbanSense08), 2008.
- [3] A. Chavez, D. Dreilinger, R. Guttman, and P. Maes. A real-life experiment in creating an agent marketplace. Software Agents and Soft Computing Towards Enhancing Machine Intelligence, pages 160–179, 1997.
- [4] A. Chavez and P. Maes. Kasbah: An agent marketplace for buying and selling goods. In Proceedings of the First International Conference on the Practical Application of Intelligent Agents and Multi-Agent Technology, volume 434. London, 1996.
- [5] S. Cheng, Y. Lim, and C. Liu. An agent-based commodity trading simulation. In Proceedings of The 8th International Conference on Autonomous Agents and Multiagent Systems-Volume 2, pages 1377–1378. International Foundation for Autonomous Agents and Multiagent Systems, 2009.
- [6] Y. Dong, S. Kanhere, C. Chou, and N. Bulusu. Automatic collection of fuel prices from a network of mobile cameras. Distributed Computing in Sensor Systems, pages 140–156, 2008.
- [7] A. Hal and H. Varian. Conditioning Prices on Purchase History. In Marketing Science. Citeseer, 2002.
- [8] A. Odlyzko. Privacy, economics, and price discrimination on the Internet. In Proceedings of the 5th international conference on Electronic commerce, pages 355–366. ACM, 2003.
- [9] Orlando Sentinel. High-priced gas station near OIA sues city. August 14, 2010.
- [10] D. Parker and T. Filatova. A conceptual design for a bilateral agent-based land market with heterogeneous economic agents. Computers, Environment and Urban Systems, 32(6):454–463, 2008.
- [11] M. Raberto, S. Cincotti, S. Focardi, and M. Marchesi. Agent-based simulation of a financial market. Physica A: Statistical Mechanics and its Applications, 299(1-2):319–327, 2001.
- [12] F. Ren, M. Zhang, and K. Sim. Adaptive conceding strategies for automated trading agents in dynamic, open markets. Decision Support Systems, 46(3):704–716, 2009.
- [13] J. Rowley. Promotion and marketing communications in the information marketplace. Library Review, 47(8):383–387, 1998.
- [14] J. Sairamesh and C. Codella. NetBazaar: Networked Electronic Markets for Trading Computation and Information Services. Research and Advanced Technology for Digital Libraries, pages 507–507, 2009.
- [15] H. Varian, J. Farrell, and C. Shapiro. The economics of information technology: An introduction. Cambridge Univ Pr, 2004.