M. Ablikim1, M. N. Achasov6, O. Albayrak3,
D. J. Ambrose39, F. F. An1, Q. An40, J. Z. Bai1,
R. Baldini Ferroli17A, Y. Ban26, J. Becker2,
J. V. Bennett16, M. Bertani17A, J. M. Bian38,
E. Boger19,a, O. Bondarenko20, I. Boyko19,
R. A. Briere3, V. Bytev19, H. Cai44, X. Cai1, O.
Cakir34A, A. Calcaterra17A, G. F. Cao1,
S. A. Cetin34B, J. F. Chang1, G. Chelkov19,a,
G. Chen1, H. S. Chen1, J. C. Chen1, M. L. Chen1,
S. J. Chen24, X. Chen26, Y. B. Chen1,
H. P. Cheng14, Y. P. Chu1, D. Cronin-Hennessy38,
H. L. Dai1, J. P. Dai1, D. Dedovich19,
Z. Y. Deng1, A. Denig18, I. Denysenko19,b,
M. Destefanis43A,43C, W. M. Ding28, Y. Ding22,
L. Y. Dong1, M. Y. Dong1, S. X. Du46, J. Fang1,
S. S. Fang1, L. Fava43B,43C, C. Q. Feng40,
P. Friedel2, C. D. Fu1, J. L. Fu24, O. Fuks19,a,
Y. Gao33, C. Geng40, K. Goetzen7, W. X. Gong1,
W. Gradl18, M. Greco43A,43C, M. H. Gu1,
Y. T. Gu9, Y. H. Guan36, A. Q. Guo25,
L. B. Guo23, T. Guo23, Y. P. Guo25, Y. L. Han1,
F. A. Harris37, K. L. He1, M. He1, Z. Y. He25,
T. Held2, Y. K. Heng1, Z. L. Hou1, C. Hu23,
H. M. Hu1, J. F. Hu35, T. Hu1, G. M. Huang4,
G. S. Huang40, J. S. Huang12, L. Huang1,
X. T. Huang28, Y. Huang24, Y. P. Huang1,
T. Hussain42, C. S. Ji40, Q. Ji1, Q. P. Ji25,
X. B. Ji1, X. L. Ji1, L. L. Jiang1,
X. S. Jiang1, J. B. Jiao28, Z. Jiao14,
D. P. Jin1, S. Jin1, F. F. Jing33,
N. Kalantar-Nayestanaki20, M. Kavatsyuk20, B. Kopf2,
M. Kornicer37, W. Kuehn35, W. Lai1,
J. S. Lange35, P. Larin11, M. Leyhe2,
C. H. Li1, Cheng Li40, Cui Li40, D. M. Li46,
F. Li1, G. Li1, H. B. Li1, J. C. Li1,
K. Li10, Lei Li1, Q. J. Li1, S. L. Li1,
W. D. Li1, W. G. Li1, X. L. Li28, X. N. Li1,
X. Q. Li25, X. R. Li27, Z. B. Li32, H. Liang40,
Y. F. Liang30, Y. T. Liang35, G. R. Liao33,
X. T. Liao1, D. Lin11, B. J. Liu1, C. L. Liu3,
C. X. Liu1, F. H. Liu29, Fang Liu1, Feng Liu4,
H. Liu1, H. B. Liu9, H. H. Liu13, H. M. Liu1,
H. W. Liu1, J. P. Liu44, K. Liu33, K. Y. Liu22,
Kai Liu36, P. L. Liu28, Q. Liu36, S. B. Liu40,
X. Liu21, Y. B. Liu25, Z. A. Liu1,
Zhiqiang Liu1, Zhiqing Liu1, H. Loehner20,
G. R. Lu12, H. J. Lu14, J. G. Lu1, Q. W. Lu29,
X. R. Lu36, Y. P. Lu1, C. L. Luo23, M. X. Luo45,
T. Luo37, X. L. Luo1, M. Lv1, C. L. Ma36,
F. C. Ma22, H. L. Ma1, Q. M. Ma1, S. Ma1,
T. Ma1, X. Y. Ma1, F. E. Maas11,
M. Maggiora43A,43C, Q. A. Malik42, Y. J. Mao26,
Z. P. Mao1, J. G. Messchendorp20, J. Min1,
T. J. Min1, R. E. Mitchell16, X. H. Mo1,
H. Moeini20, C. Morales Morales11, K. Moriya16,
N. Yu. Muchnoi6, H. Muramatsu39, Y. Nefedov19,
C. Nicholson36, I. B. Nikolaev6, Z. Ning1,
S. L. Olsen27, Q. Ouyang1, S. Pacetti17B,
J. W. Park27, M. Pelizaeus2, H. P. Peng40,
K. Peters7, J. L. Ping23, R. G. Ping1,
R. Poling38, E. Prencipe18, M. Qi24, S. Qian1,
C. F. Qiao36, L. Q. Qin28, X. S. Qin1, Y. Qin26,
Z. H. Qin1, J. F. Qiu1, K. H. Rashid42,
G. Rong1, X. D. Ruan9, A. Sarantsev19,c,
B. D. Schaefer16, M. Shao40, C. P. Shen37,d,
X. Y. Shen1, H. Y. Sheng1, M. R. Shepherd16,
W. M. Song1, X. Y. Song1, S. Spataro43A,43C,
B. Spruck35, D. H. Sun1, G. X. Sun1,
J. F. Sun12, S. S. Sun1, Y. J. Sun40,
Y. Z. Sun1, Z. J. Sun1, Z. T. Sun40,
C. J. Tang30, X. Tang1, I. Tapan34C,
E. H. Thorndike39, D. Toth38, M. Ullrich35,
I. Uman34B, G. S. Varner37, B. Q. Wang26,
D. Wang26, D. Y. Wang26, K. Wang1, L. L. Wang1,
L. S. Wang1, M. Wang28, P. Wang1, P. L. Wang1,
Q. J. Wang1, S. G. Wang26, X. F. Wang33,
X. L. Wang40, Y. D. Wang17A, Y. F. Wang1,
Y. Q. Wang18, Z. Wang1, Z. G. Wang1,
Z. Y. Wang1, D. H. Wei8, J. B. Wei26,
P. Weidenkaff18, Q. G. Wen40, S. P. Wen1,
M. Werner35, U. Wiedner2, L. H. Wu1, N. Wu1,
S. X. Wu40, W. Wu25, Z. Wu1, L. G. Xia33,
Y. X Xia15, Z. J. Xiao23, Y. G. Xie1,
Q. L. Xiu1, G. F. Xu1, G. M. Xu26, Q. J. Xu10,
Q. N. Xu36, X. P. Xu31, Z. R. Xu40, F. Xue4,
Z. Xue1, L. Yan40, W. B. Yan40, Y. H. Yan15,
H. X. Yang1, Y. Yang4, Y. X. Yang8, H. Ye1,
M. Ye1, M. H. Ye5, B. X. Yu1, C. X. Yu25,
H. W. Yu26, J. S. Yu21, S. P. Yu28, C. Z. Yuan1,
Y. Yuan1, A. A. Zafar42, A. Zallo17A,
S. L. Zang24, Y. Zeng15, B. X. Zhang1,
B. Y. Zhang1, C. Zhang24, C. C. Zhang1,
D. H. Zhang1, H. H. Zhang32, H. Y. Zhang1,
J. Q. Zhang1, J. W. Zhang1, J. Y. Zhang1,
J. Z. Zhang1, LiLi Zhang15, R. Zhang36,
S. H. Zhang1, X. J. Zhang1, X. Y. Zhang28,
Y. Zhang1, Y. H. Zhang1, Z. P. Zhang40,
Z. Y. Zhang44, Zhenghao Zhang4, G. Zhao1,
H. S. Zhao1, J. W. Zhao1, K. X. Zhao23,
Lei Zhao40, Ling Zhao1, M. G. Zhao25, Q. Zhao1,
S. J. Zhao46, T. C. Zhao1, X. H. Zhao24,
Y. B. Zhao1, Z. G. Zhao40, A. Zhemchugov19,a,
B. Zheng41, J. P. Zheng1, Y. H. Zheng36,
B. Zhong23, L. Zhou1, X. Zhou44, X. K. Zhou36,
X. R. Zhou40, C. Zhu1, K. Zhu1, K. J. Zhu1,
S. H. Zhu1, X. L. Zhu33, Y. C. Zhu40,
Y. M. Zhu25, Y. S. Zhu1, Z. A. Zhu1, J. Zhuang1,
B. S. Zou1, J. H. Zou1
(BESIII Collaboration)
1 Institute of High Energy Physics, Beijing 100049, People’s Republic of China
2 Bochum Ruhr-University, D-44780 Bochum, Germany
3 Carnegie Mellon University, Pittsburgh, Pennsylvania 15213, USA
4 Central China Normal University, Wuhan 430079, People’s Republic of China
5 China Center of Advanced Science and Technology, Beijing 100190, People’s Republic of China
6 G.I. Budker Institute of Nuclear Physics SB RAS (BINP), Novosibirsk 630090, Russia
7 GSI Helmholtzcentre for Heavy Ion Research GmbH, D-64291 Darmstadt, Germany
8 Guangxi Normal University, Guilin 541004, People’s Republic of China
9 GuangXi University, Nanning 530004, People’s Republic of China
10 Hangzhou Normal University, Hangzhou 310036, People’s Republic of China
11 Helmholtz Institute Mainz, Johann-Joachim-Becher-Weg 45, D-55099 Mainz, Germany
12 Henan Normal University, Xinxiang 453007, People’s Republic of China
13 Henan University of Science and Technology, Luoyang 471003, People’s Republic of China
14 Huangshan College, Huangshan 245000, People’s Republic of China
15 Hunan University, Changsha 410082, People’s Republic of China
16 Indiana University, Bloomington, Indiana 47405, USA
17 (A)INFN Laboratori Nazionali di Frascati, I-00044, Frascati, Italy; (B)INFN and University of Perugia, I-06100, Perugia, Italy
18 Johannes Gutenberg University of Mainz, Johann-Joachim-Becher-Weg 45, D-55099 Mainz, Germany
19 Joint Institute for Nuclear Research, 141980 Dubna, Moscow region, Russia
20 KVI, University of Groningen, NL-9747 AA Groningen, The Netherlands
21 Lanzhou University, Lanzhou 730000, People’s Republic of China
22 Liaoning University, Shenyang 110036, People’s Republic of China
23 Nanjing Normal University, Nanjing 210023, People’s Republic of China
24 Nanjing University, Nanjing 210093, People’s Republic of China
25 Nankai University, Tianjin 300071, People’s Republic of China
26 Peking University, Beijing 100871, People’s Republic of China
27 Seoul National University, Seoul, 151-747 Korea
28 Shandong University, Jinan 250100, People’s Republic of China
29 Shanxi University, Taiyuan 030006, People’s Republic of China
30 Sichuan University, Chengdu 610064, People’s Republic of China
31 Soochow University, Suzhou 215006, People’s Republic of China
32 Sun Yat-Sen University, Guangzhou 510275, People’s Republic of China
33 Tsinghua University, Beijing 100084, People’s Republic of China
34 (A)Ankara University, Dogol Caddesi, 06100 Tandogan, Ankara, Turkey; (B)Dogus University, 34722 Istanbul, Turkey; (C)Uludag University, 16059 Bursa, Turkey
35 Universitaet Giessen, D-35392 Giessen, Germany
36 University of Chinese Academy of Sciences, Beijing 100049, People’s Republic of China
37 University of Hawaii, Honolulu, Hawaii 96822, USA
38 University of Minnesota, Minneapolis, Minnesota 55455, USA
39 University of Rochester, Rochester, New York 14627, USA
40 University of Science and Technology of China, Hefei 230026, People’s Republic of China
41 University of South China, Hengyang 421001, People’s Republic of China
42 University of the Punjab, Lahore-54590, Pakistan
43 (A)University of Turin, I-10125, Turin, Italy; (B)University of Eastern Piedmont, I-15121, Alessandria, Italy; (C)INFN, I-10125, Turin, Italy
44 Wuhan University, Wuhan 430072, People’s Republic of China
45 Zhejiang University, Hangzhou 310027, People’s Republic of China
46 Zhengzhou University, Zhengzhou 450001, People’s Republic of China
a Also at the Moscow Institute of Physics and Technology, Moscow 141700, Russia
b On leave from the Bogolyubov Institute for Theoretical Physics, Kiev 03680, Ukraine
c Also at the PNPI, Gatchina 188300, Russia
d Present address: Nagoya University, Nagoya 464-8601, Japan
Abstract
Based on a sample of 225.3 million events accumulated with
the BESIII detector at the BEPCII, the decays of
are studied via . A clear
signal is observed in the mass spectrum, and
the branching fraction is measured to be
, which is in good agreement with
theoretical predictions and the previous measurement, but is
determined with much higher precision. No signal is found in
the mass spectrum, and the upper limit is
determined to be at the
90% confidence level.
pacs:
25.75.Gz, 14.40.Df, 12.38.Mh
I Introduction
Since the was discovered in
1964 Kalbfleisch:1964ve ; Goldberg:1964jn , there has been
considerable interest in its decay both theoretically and
experimentally because of its special role in low energy scale
Quantum Chromodynamics (QCD) theory. Its main decay modes, including
hadronic and radiative decays, have been well
measured PDG2012 , but the study of anomalous
decays is still an open field.
Recently, using the radiative decay via
as the source of
mesons, CLEO Naik:2009fj reported the first observation of the
conversion decay , which has been discussed for
many years based on
the Vector Meson Dominance (VMD) model and Chiral Perturbation
Theory Faessler:2000ef ; Borasoy:2007pr ; Petri:2010jy .
Theoretically this decay is expected to proceed via a virtual photon
intermediate state, , and
provides a more stringent test of the theories since it involves
off-shell photons. In accordance with theoretical predictions, the
two prominent features expected for this decay are a peak with a
long tail just above in the () mass
spectrum, and a dominant contribution in .
CLEO with limited statistics was unable to explore these
distributions, although their measured branching fraction,
Naik:2009fj ,
was consistent with predicted values around . In
addition, the search for , which is predicted
to be lower by two order of magnitude, was also performed. No
evident signal was observed, and the upper limit,
, at the 90% confidence
level (C.L.), was determined.
At BESIII a sample of Ablikim:2012vd
events, corresponding to events
produced through the radiative decay , was collected
in 2009, and offers a unique opportunity to study decays. In
addition to ,
is also studied in order to determine
the ratio of to
. The advantage of measuring is that
uncertainties due to the number of events, tracking
efficiency from and the radiative photon detection
efficiency cancel.
II The experiment and monte carlo simulation
BEPCII is a double-ring collider designed for a peak
luminosity of at the center of
mass energy of 3770 MeV. The cylindrical core of the BESIII detector
consists of a helium-gas-based drift chamber (MDC) for charged track
and particle identification (PID) by , a plastic scintillator
time-of-flight system (TOF), and a 6240-crystal
CsI(Tl) Electromagnetic Calorimeter (EMC) for electron
identification and photon detection. These components are all
enclosed in a superconducting solenoidal magnet providing a 1.0-T
magnetic field. The solenoid is supported by an octagonal
flux-return yoke with resistive-plate-counter muon detector modules
(MU) interleaved with steel. The geometrical acceptance for charged
tracks and photons is of , and the resolutions for
charged track momentum and photon energy at 1 GeV are and
, respectively. More details on the features and capabilities
of BESIII are provided in Ref. Ablikim:2009vd .
The estimation of backgrounds and the determinations of detection
efficiencies are performed through Monte Carlo (MC) simulations. The
BESIII detector is modeled with the geant4Agostinelli:2003hh ; Allison:2006ve . The production of the
resonance is implemented with MC event generator
kkmcJadach:1999vf ; Jadach:2000ir , while the decays
are performed with evtgenPing2008 . The possible
hadronic backgrounds are studied using a sample of inclusive
events in which the known decays of the are modeled with
branching fractions being set to the world average values in
PDG PDG2012 , while the unknown decays are generated with the
lundcharm model Chen:2000 . For
decays, a model Zhangzy2012 based on theoretical calculations
using the vector meson dominant model with infinite-width corrections
and pseudoscalar meson mixing Petri:2010jy was developed.
III analysis
III.1
The final state in this analysis is , with being an
electron or a muon. The charged tracks in the polar angle range
are reconstructed from hits in the MDC. Good
charged tracks are required to pass within of the
interaction point in the beam direction and in the
plane perpendicular to the beam. Photon candidates are reconstructed
by clustering the EMC crystal energies. The minimum energy is for barrel showers () and for
end-cap showers (). To eliminate the showers
from charged particles, a photon must be separated by at least
from any good charged track. An EMC timing requirement is
used to suppress noise and energy deposits unrelated to the
event. Candidate events are required to contain exactly four good
charged tracks with zero net charge and at least one good photon. To
determine the species of the final state particles and select the best
photon when additional photons are found in an event, the combination
with the minimum value of is retained. Here
is the sum of the chi-square from
the four-constraint () kinematic fit, and that from PID,
formed by combining TOF and information of each
charged track for each particle hypothesis (pion, electron, or muon).
Events with are kept as
candidates. A kinematic fit under the hypothesis of
is also performed, and is required to reject possible
background events from .
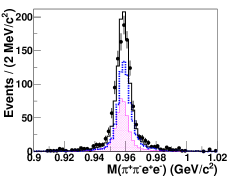
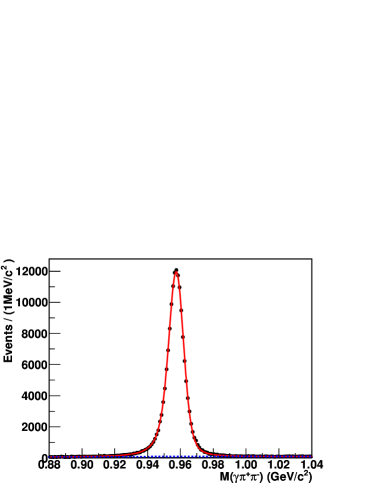
Figure 1: Kinematical distributions for the to
decay: The invariant mass distributions of (a)
and (b) . Dots with error bars
represent the data; the shaded area is MC signal shape, the
dashed histogram is the MC
line shape, and the solid histogram is the sum of MC signal
and MC background from . Both
of these MC simulations are normalized to the yields found
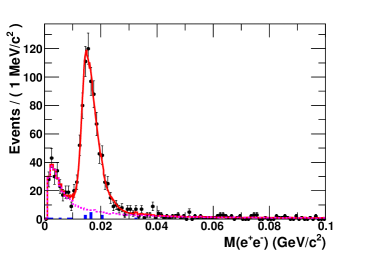
in Table I.Figure 2: The invariant mass spectrum of data (dots with error
bars) after all selection criteria are applied. The solid line
represents the fit result, the dotted histogram is the MC signal
shape and the shaded histogram is background obtained from
sideband events.
A very clear signal is observed in the invariant
mass distribution, shown in Fig. 1(a) after
the above event selection. MC study shows that the dominant
background events come from ,
with the photon subsequently converted into an
electron-positron pair; this background is displayed as the dashed
histogram in Fig. 1(a). The di-pion invariant
mass distribution, which is shown in
Fig. 1(b), shows good agreement between data
and MC simulation. Figure 2 displays the
mass spectrum after requiring
GeV/; the background from conversions can be easily
distinguished. The enhancement close to mass threshold
corresponds to the signal from the decay, and
the clear peak around 0.015 GeV/ comes from the background events
of where the photon undergoes conversion to an
pair and the electron (positron)’s momentum is improperly
reconstructed assuming that all the charged tracks are from the
interaction point. The background contributions of
and are
estimated from the sideband region (0.88 GeV/ 0.90 GeV/ or 1.02 GeV/
1.04 GeV/).
To extract the events, a maximum likelihood
fit is performed on the observed invariant mass
distribution with the signal shape described by the MC generator
specifically developed for this analysis, the dominant background
shape parameterized by a smooth function describing the
conversion events from , and the contribution
(17 events) obtained from sideband fixed in the fit to
account for the non- background. The fit, shown in
Fig. 2, yields events,
and the detection efficiency obtained from MC simulation is
%; both are summarized in
Table 1.
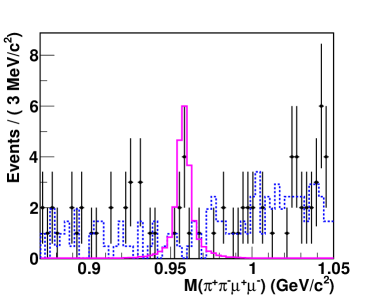
Figure 3: The invariant mass distributions of data and MC
simulation with all selection criteria applied. Dots with error bars
represent the data, the solid histogram is MC signal, and the dashed
line indicates inclusive MC.
Figure 3 shows the invariant mass
spectrum for candidates surviving all selection criteria. The
contribution from background events, mainly coming from
and and
estimated with the inclusive MC events, is shown as the dashed
histogram. Although a few events accumulate in the mass
region, they are not significant.
To determine the upper limit on the signal, a series of
unbinned maximum likelihood fits is performed to the mass spectrum of
with an expected signal. In the fit, the line
shape of the signal is determined by MC simulation, and the
background is represented with a second-order Chebychev
polynomial. The likelihood distributions of the fit are taken as the
probability density function (PDF) directly. The upper limit on the
number of signal events at the 90% C.L. is defined as ,
corresponding to the number of events at 90% of the integral of the
PDF. The fit-related uncertainties on are estimated by
using different fit ranges and different orders of the background
polynomial. The maximum one, , and the detection
efficiency from MC simulation, , are used to
evaluate the upper limit on the branching fraction.
III.2 ,
q
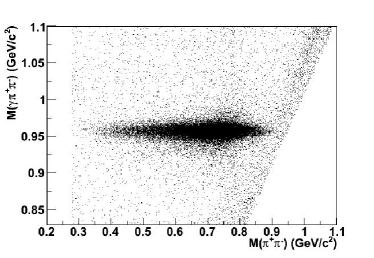
Figure 4: Scatter plot of versus
for data.Figure 5: The invariant mass spectrum for data after all
selection criteria are applied. The solid curve is the fit
result, and the dashed line represents the background polynomial.
The final state is for this mode. The charged track and
good photon selection are the same as those described above, but no PID is
applied in the event selection. A 4C kinematic fit is performed under
the hypothesis of , and
is required. For events with more than two photon candidates, the
combination with the minimum is retained. To
reject background events with in the final state, the
invariant mass of the two photons is required to satisfy
0.16 GeV/; this removes 94% background while the efficiency loss
is only 0.73%. The experimental signature of
is given by the radiative photon from
decays, that carries a unique energy of 1.4 GeV. Consequently it is
easy to distinguish this photon from those from decays. In
this analysis, the combination of invariant mass closest
to the mass is chosen to reconstruct the .
Figure 4 shows the scatter plot of
versus for the candidate events, where
the distinct band corresponds to the decay
. A very clean peak is observed in the
distribution, as displayed in
Fig. 5. The peak is fitted
with the MC simulated signal shape convolved with a Gaussian mass
resolution function to account for the difference in mass resolution
between data and MC simulations, plus a second-order Chebychev
polynomial background shape. The fit, shown as the smooth curve in
Fig. 5 gives
events, and the detection
efficiency, , is obtained from the MC simulation;
these are tabulated in
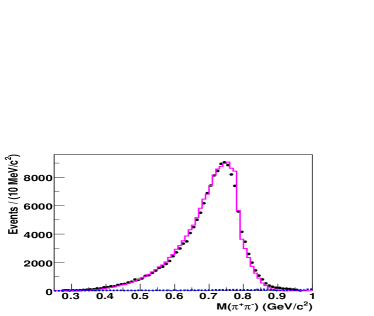
Table 1. In the
simulation of , since the
resonant contribution from is
insufficient to describe the data, the non-resonant contribution
(known as the ”box anomaly”) is also included using a decay rate
formula dacay_rate deduced from the ones used in
Refs. theory1 ; theory2 ; theory3 . With the parameters tuned
with data, the comparison of the simulated dipion mass spectrum to
data in Fig. 6 shows good
agreement.
Figure 6: The comparison of the simulated mass spectrum with
data. Dots with error bars are data within the region (
[0.938, 0.978] GeV/ ), the dashed histogram is background
obtained from the sideband, and the solid histogram
represents the MC simulation.
Table 1: Numbers used in the branching fraction calculations: the fitted signal yields, (or 90% C.L. upper limit); the detection efficiency, .
decay mode
(%)
16.94 0.08
429 24
35.47 0.11
12
45.39 0.07
158916 425
IV Systematic errors
In the measurement of the ratio of the branching fractions, the
possible systematic error sources and the corresponding
contributions are discussed in detail below.
•
Form factor uncertainty. In the MC generator used to determine
the detection efficiency of , the VMD factor defined for the hidden gauge model is
introduced to account for the contribution from the
meson. The detection efficiency dependence is evaluated by replacing
the factor above with the modified VMD factors denoted in
Ref. Petri:2010jy . The maximum change of the detection
efficiencies is assigned as the systematic error, which is listed in
Table 2.
•
MDC tracking efficiency. Since the systematic errors for the two
charged pions cancel by measuring the relative branching fraction of
and , only the systematic
error caused by the MDC tracking from the leptonic pairs need be
considered. As the momenta of the two charged leptons are quite low,
it is difficult to select a pure sample from data. In this analysis
the MDC tracking uncertainty of charged pions at low momentum is
determined and used to estimate that of the leptons by
reweighting
in accordance with their momenta. The data sample of
, is used to evaluate the
data-MC difference of pions at low momentum and finally the MDC
tracking uncertainty is estimated to be 2.1% for electrons and
1.6% for muons, where the dominant contribution is from the
momentum region below 200 MeV/. Therefore 4.2% and 3.2% are
taken as the systematic errors on the tracking efficiency for the
channels with and , respectively, in the final
states.
•
Photon detection efficiency. The photon detection efficiency is
studied with three independent decay modes, ,
and
photondec . The results indicate that
the difference between the detection efficiency of data and MC
simulation is within 1% for each photon. Since the uncertainty from
the radiative photons cancel by measuring the relative branching
fraction of and , 1% is
taken to be the systematic error from the photon in decaying
into .
•
Particle ID. The study of the particle ID efficiency of the pion
is performed using the clean control sample of
, and indicates that the pion particle ID
efficiency for data agrees within 1% of that of the MC simulation
in the pion momentum region. The particle ID efficiency of the
electron was checked with radiative Bhabha events, and the difference
between data and MC simulation is found to be 1%. In this analysis,
4% is taken as the systematic error from the particle ID efficiency
of the four charged tracks in decaying into .
•
Kinematic fit. The clean sample (, ) selected without a kinematic fit is
used to estimate the systematic error associated with the 4C
kinematic fit. The difference between data and MC is determined to
be %, with . In this paper, 1.9% is
taken to be the systematic error from the kinematic fit for the
analyzed decays of . For
, channel, the 4C kinematic
fit uncertainty is estimated to be less than 0.7% using the control
sample . Thus, the error from kinematic fit is,
2.0%, the sum of them added in quadrature.
•
Background uncertainty. Studies have shown that the mass
resolution of , as simulated by the MC, is
underestimated. To evaluate the systematic effect associated with
this, the invariant mass of in the MC sample is smeared
with a Gaussian function, where the width of this Gaussian is
floated in the fit. The change of the result, 0.9%, is assigned to
be the systematic error.
•
mass window requirement. Another source of systematic
uncertainty is the requirement on the mass window selection
GeV/. The
uncertainty is studied using a looser requirement of 0.90 GeV/
GeV/, and an uncertainty of 2.0%
is assigned for this item.
•
Uncertainty of the number of events
(). The uncertainty from this item, 0.5%,
contains the error due to the veto cut ( 0.16
GeV/) and the fit-related error.
Except for the systematic uncertainties studied above, a small
uncertainty due to the statistical error of the efficiencies in
and is also considered; all
errors are summarized in Table 2. The total systematic
error is the sum of them added in quadrature.
Table 2: Impact (in %) of the systematic uncertainties on the measured branching fractions.
Sources
Form factor uncertainty
0.2
0.3
MDC tracking
4.2
3.2
Photon detection
1.0
1.0
PID
4.0
4.0
4C kinematic fit
2.0
2.0
Background uncertainty
0.9
–
mass window
2.0
–
0.5
0.5
MC statistics
0.6
0.4
Total
6.6
5.6
V Results
The ratio (upper limit) of to
is calculated with
where and are the
observed events (or the 90% C.L. upper limit) of
and , and
and
are the corresponding detection efficiencies. With the numbers given
in Table 1, the
ratio is
determined to be ,
where the first error is the statistical error from
and . To
calculate the upper limit, the systematic error is taken into
account by a factor of . Therefore the
upper limit, , on the ratio
is given
at the 90% confidence level.
VI Summary
The measurements of , are performed using the sample of 225.3 million
events collected with the BESIII detector. A clear signal is
observed in the invariant mass spectrum of , and the
ratio is
determined to be .
Using the PDG world average of and its
uncertainty PDG2012 , the branching fraction is measured to be
which is consistent with the theoretical
predictions and previous measurement, but with the precision improved
significantly. The mass spectra of and are also
consistent with the theoretical predictions that is
dominated by , and has a peak just above
2 with a long tail. No evidence for decaying into
is found, and an upper limit of on
the ratio of
is obtained
at the 90% confidence level. The corresponding branching fraction
upper limit of is
.
VII Acknowledgment
The BESIII collaboration thanks the staff of BEPCII and the
computing center for their hard efforts. This work is supported in
part by the Ministry of Science and Technology of China under
Contract No. 2009CB825200; National Natural Science Foundation of
China (NSFC) under Contracts Nos. 10625524, 10821063, 10825524,
10835001, 10935007, 10979033, 10979012, 11175189, 11125525,
11235011; Joint Funds of the National Natural Science Foundation of
China under Contracts Nos. 11079008, 11179007; the Chinese Academy
of Sciences (CAS) Large-Scale Scientific Facility Program; CAS under
Contracts Nos. KJCX2-YW-N29, KJCX2-YW-N45; 100 Talents Program of
CAS; German Research Foundation DFG under Contract No. Collaborative
Research Center CRC-1044; Istituto Nazionale di Fisica Nucleare,
Italy; Ministry of Development of Turkey under Contract No.
DPT2006K-120470; U. S. Department of Energy under Contracts Nos.
DE-FG02-04ER41291, DE-FG02-05ER41374, DE-FG02-94ER40823; U.S.
National Science Foundation; University of Groningen (RuG) and the
Helmholtzzentrum fuer Schwerionenforschung GmbH (GSI), Darmstadt;
WCU Program of National Research Foundation of Korea under Contract
No. R32-2008-000-10155-0. This paper is also supported by the
Natural Science Foundation of Shandong Province, China under
Contracts Nos. 2009ZRB02465.
References
(1)
G. R. Kalbfleisch et al.,
Phys. Rev. Lett. 12, 527 (1964).
(2)
M. Goldberg et al.,
Phys. Rev. Lett. 12, 546 (1964).
(3)
J. Beringer et al.,
Phys. Rev. D 86, 010001 (2012).
(4)
P. Naik et al.,
Phys. Rev. Lett. 102, 061801 (2009).
(5)
A. Faessler, C. Fuchs, M. I. Krivoruchenko,
Phys. Rev. C 61, 035206 (2000).
(6)
B. Borasoy, R. Nissler,
Eur. Phys. J. A 33, 95 (2007).
(7)
T. Petri,
arXiv:1010.2378 [nucl-th].
(8)
M. Ablikim et al.,
Chin. Phys. C 36, 915 (2012).
(9)
M. Ablikim et al.,
Nucl. Instrum. Meth. A 614, 345 (2010).
(10)
S. Agostinelli et al.,
Nucl. Instrum. Meth. A 506, 250 (2003).
(11)
J. Allison, K. Amako, J. Apostolakis, H. Araujo, P. Dubois et
al.,
IEEE Trans. Nucl. Sci. 53, 270 (2006).
(12)
S. Jadach, B. Ward, Z. Was,
Comput. Phys. Commun. 130, 260 (2000).
(13)
S. Jadach, B. Ward, Z. Was,
Phys. Rev. D 63, 113009 (2001).
(14)
R. G. Ping et al.,
Chin. Phys. C 32, 599 (2008).
(15)
J. C. Chen et al.,
Phys. Rev. D 62, 1 (2000).
(16)
Z. Y. Zhang, L. Q. Qin, S. S. Fang,
Chin. Phys. C 36, 926 (2012).
(17)
, where is the photon energy and is the momentum of pion in the rest frame.
is the Breit-Wigner dsitribution in GS parameterazation theory4 .
represents the contribution from resonance and the complex phase of represents the interference between and resonance. is the mass of the resonance. represents the contribution from the non-resonance.
(18) A. Abele et al., Phys. Lett., B402, 195 (1997).
(19) R. R. Akhmetshin et al., Phys. Lett., B527, 161 (2002).
(20) M. Benayoun et al., Z. Phys. C58, 31 (1993).
(21)
M. Ablikim et al.,
Phys. Rev. D 83, 112005 (2011).
(22) G. J. Gounaris, J. J. Sakurai, Phys. Rev. Lett. 21, 244 (1968).