Fermi LAT pulsed detection of PSR J07373039A in the double pulsar system
Abstract
We report the Fermi Large Area Telescope discovery of -ray pulsations from the 22.7 ms pulsar A in the double pulsar system J07373039A/B. This is the first mildly recycled millisecond pulsar (MSP) detected in the GeV domain. The 2.7 s companion object PSR J07373039B is not detected in rays. PSR J07373039A is a faint -ray emitter, so that its spectral properties are only weakly constrained; however, its measured efficiency is typical of other MSPs. The two peaks of the -ray light curve are separated by roughly half a rotation and are well offset from the radio and X-ray emission, suggesting that the GeV radiation originates in a distinct part of the magnetosphere from the other types of emission. From the modeling of the radio and the -ray emission profiles and the analysis of radio polarization data, we constrain the magnetic inclination and the viewing angle to be close to 90, which is consistent with independent studies of the radio emission from PSR J07373039A. A small misalignment angle between the pulsar’s spin axis and the system’s orbital axis is therefore favored, supporting the hypothesis that pulsar B was formed in a nearly symmetric supernova explosion as has been discussed in the literature already.
Subject headings:
gamma rays: stars – pulsars: general – pulsars: individual (PSR J07373039A, PSR J07373039B)1. Introduction
Pulsed GeV -ray emission from more than 100 pulsars111A list of -ray pulsar detections is available at
https://confluence.slac.stanford.edu/display/GLAMCOG/Public+List+of+LAT-Detected+Gamma-Ray+Pulsars. has been observed by the Large Area Telescope (LAT; FermiLAT) aboard the Fermi satellite, launched in 2008 June (see The Second Fermi Large Area Catalog of Gamma-Ray Pulsars; Fermi2PC, hereafter 2PC). The current population of -ray pulsars includes objects known from independent radio or X-ray observations and detected in rays by folding the Fermi LAT data at the known rotational periods (e.g., Fermi8MSPs; FermiJ2043; Espinoza2013), and -ray pulsars found through direct blind searches of the LAT data (FermiBlindSearch; Pletsch9PSRs) or radio searches for pulsars in unassociated -ray sources (see Ray2012, and references therein). These pulsars are energetic (spin-down luminosities erg s, where is the spin period, is its first time derivative, and denotes the moment of inertia, assumed to be g cm in this work) and are typically nearby. They therefore have large values of the “spin-down flux” and of the heuristic detectability metric (FermiPSRCatalog).
The double pulsar system PSR J07373039A/B (Burgay2003; Lyne2004) consists of two radio-emitting neutron stars in a tight 2.4 hr orbit. Radio timing observations of the two pulsars provide high-precision tests of strong field gravity (Kramer2006). The 2.7 s pulsar J07373039B has a low spin-down luminosity erg s, three orders of magnitude smaller than that of the least energetic -ray pulsar currently known, making this pulsar unlikely to be detectable by the LAT. On the other hand, the higher of erg s—for which the Shklovskii effect (Shklovskii1970) is negligible due to the system’s low transverse velocity—and the modest parallax distance of pc measured with very long baseline interferometry observations (Deller2009) make the 22.7 ms pulsar J07373039A a credible candidate for a detection in rays.
Searching for high-energy pulsations from PSRs J07373039A and B allows exploration of regions of the diagram that are devoid of -ray pulsars (FermiPSRCatalog): mildly recycled millisecond pulsars (MSPs) for the former (mildly recycled pulsars being pulsars that were only partially spun-up by accretion of matter from a companion star), and slowly-rotating normal pulsars for the latter. Increasing the variety of -ray pulsar types helps understand the phenomenology of high-energy emission from these stars, and how emission properties evolve with, e.g., or age (with the caveat that the evolution could be masked by effects arising from the geometry). Additionally, the modeling of pulse profiles at different wavelengths can yield constraints on the geometry of emission, in particular, the inclination angle of the magnetic axis () and the observer viewing angle () with respect to the spin axis. Constraints on and can also be determined by studying the radio polarization. Since the inclination of the binary system with respect to the line-of-sight is accurately known, directly measures the misalignment between the pulsar’s spin axis and the orbital angular momentum, a quantity which gives important clues about the formation of the binary system (for a discussion, see, e.g., Ferdman2008).
We here report the discovery of -ray pulsations from the 22.7 ms pulsar J07373039A, in 43 months of data recorded by the Fermi LAT. In Section 2 we describe the analysis of the LAT data and the resulting light curve and spectrum for PSR J07373039A. In Sections 3.1 and 3.2, we model the offset radio and -ray light curves, as well as the radio polarization, under various emission models, allowing us to constrain the pulsar’s geometrical characteristics. We conclude with a brief discussion on the implication of these results.
2. LAT analysis
We analyzed Fermi LAT events recorded between 2008 August 4 and 2012 March 7, belonging to the “Source” class under the P7_V6 instrument response functions, and with zenith angles smaller than 100. We rejected events recorded when the rocking angle of the telescope exceeded 52, when the instrument was not operating in the science observations mode or when the data quality flag was not set as good. Analyses of the LAT data were carried out using the Fermi Science Tools222http://fermi.gsfc.nasa.gov/ssc/data/analysis/scitools/overview.html (STs) v9r28p0. The data were phase-folded with the Fermi plug-in (Ray2011) distributed with the Tempo2 pulsar timing package (tempo2), and the ephemerides for PSRs J07373039A and B published in Kramer2006. Since 2008 March PSR J07373039B has been invisible in the radio domain (Perera2010) because of the precession of its spin axis (Breton2008) causing its radio beam to miss the Earth, precluding timing measurements contemporaneous with the Fermi mission. Additionally, changes in the radio profile of PSR J07373039B prevented Kramer2006 from constructing a coherent timing model for this pulsar. Our ability to accurately fold the Fermi LAT data using this ephemeris is therefore limited. Nevertheless, the very low spin-down luminosity of this pulsar makes it unlikely to be detected in rays.
From initial pulsation searches using standard data selection cuts we found no evidence of -ray pulsations from PSR J07373039B. However, selecting events found within from PSR J07373039A and with energies above 0.2 GeV we obtained a value for the bin-independent H-test parameter (deJager2010) of 21.3, corresponding to a pulsation significance of . The -ray pulse profile of PSR J07373039A comprises two peaks, which is reminiscent of known -ray pulsar light curves (e.g., FermiPSRCatalog), with no evidence for emission in the phase interval.
| Parameter | Value |
|---|---|
| Rotational period, (ms) | |
| Period derivative, () | |
| Spin-down luminosity, ( erg s) | |
| Magnetic field at the light cylinder, ( G) | |
| Distance, (pc) | |
| First peak position, | |
| First peak full width at half-maximum, FWHM | |
| Distance from the closest radio peak maximum, | |
| Second peak position, | |
| Second peak full width at half-maximum, FWHM | |
| Distance from the closest radio peak maximum, | |
| -ray peak separation, | |
| Photon index, | |
| Cutoff energy, (GeV) | |
| Photon flux, ( GeV) ( photons cm s) | |
| Energy flux, ( GeV) ( erg cm s) | |
| Luminosity, ( erg s) | |
| Efficiency, |
Note. — See Section 2 for details on the measurement of these parameters. Quoted errors are statistical, while numbers in parentheses represent canonical values, obtained by fixing the photon index of PSR J07373039A at 1.3 in the spectral analysis.
As illustrated in Kerr2011weights and Guillemot2012a, weighting the -ray events by the probability that they originate from the putative pulsar increases the sensitivity to faint pulsations. To measure these probabilities we performed a binned likelihood analysis of the spectra of the sources in the region of interest, using the PyLikelihood module of the STs. Our spectral model included the 50 2FGL catalog sources (Fermi2FGL) within 20 of PSR J07373039A. The contribution from the pulsar, which is not associated with any 2FGL source, was modeled as an exponentially cutoff power law (ECPL) of the form , where is the photon index and is the cutoff energy of the spectrum. The source model also included contributions from the extragalactic diffuse emission and the residual instrumental background, jointly modeled using the iso_p7v6source template, and from the Galactic diffuse emission, modeled with the gal_2yearp7v6_v0 map cube333See http://fermi.gsfc.nasa.gov/ssc/data/access/lat/BackgroundModels.html. The parameters of PSR J07373039A, of the seven sources within 10 of the pulsar, and the normalization factors of diffuse components were left free in the fit. A Test Statistic (TS; for a definition see Fermi2FGL) value of 20.3 was found for PSR J07373039A at this stage.
To improve the quality of the spectral results we analyzed the phase interval (OFF pulse), removing the contribution from the pulsar. This allowed us to obtain an improved fit of the spectra of neighboring sources. Sources with TS values below 2 were excluded from the best-fit model obtained at this point, and the spectral parameters of sources beyond 3 from the double pulsar system were frozen at their best-fit values. We finally analyzed events in the complementary phase interval (ON pulse) with the resulting source model, refitting the contributions of the pulsar and of the three sources within 3, to determine the spectral parameters for PSR J07373039A listed in Table 1. A TS value of 31.2 is obtained for PSR J07373039A. Refitting the data with a power law shape for the pulsar, we found that the ECPL model is preferred by the likelihood at the 4 level. A cross-check of this analysis performed with the independent Pointlike analysis tool (KerrThesis) yielded results consistent with those listed in Table 1. Also listed in the table are the -ray luminosity where is the phase-averaged energy flux above 0.1 GeV and assuming a beaming correction factor , and the derived efficiency . The photon flux and energy flux of PSR J07373039A are among the lowest values of any -ray pulsars detected to date, probably a consequence of its low value. We also note that PSR J07373039A has the lowest value of the magnetic field at the light cylinder of any recycled pulsars detected in rays, G (see Equation 3.22 of Handbook).
None of the different attempts to model the spectrum of PSR J07373039A presented above yielded satisfactory measurements of its photon index, . In all cases, a small value consistent with 0 was favored. This is likely a consequence of the cutoff energy being too low to reliably determine the photon index . Limits on the other spectral parameters can thus be placed by repeating the analysis using a value for the photon index which is representative of the values observed for other MSPs. Table 1 lists the results obtained by fixing at 1.3, this value being the average photon index measured for the strongest MSPs in 2PC. The spectral parameters quoted in parentheses represent canonical values, arising from the lack of constraints on .
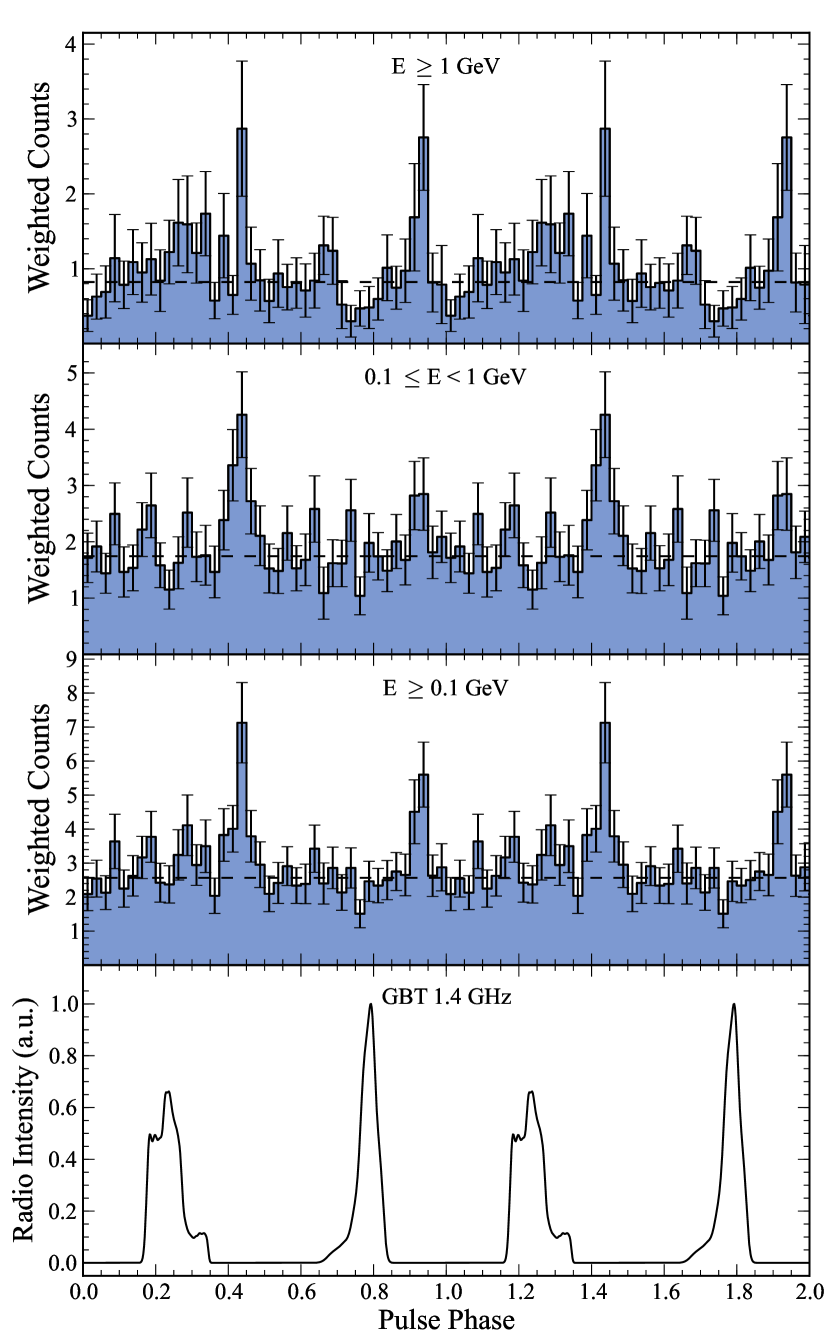
The tool gtsrcprob was finally used to assign each event a probability that it originated from PSR J07373039A based on the fluxes and spectra obtained from the likelihood analysis. The integrated pulse profile of PSR J07373039A over 0.1 GeV and for probabilities larger than 0.05 is shown in Figure 1. The zero of phase is defined by the maximum of the first Fourier harmonic of the signal transferred back to the time domain. We find a weighted -test parameter of 41 (Kerr2011weights; deJager2010), corresponding to a significance of 5.4.
As can be seen from Figure 1, the -ray profile comprises two peaks, with indications for additional complexity. We fitted the profile above 0.1 GeV with Lorentzian functions and found the peak positions and full widths at half-maxima for the first and second -ray peaks as listed in Table 1. Defining and as the separation between the -ray peaks and the maxima of the closest 1.4 GHz radio peaks, respectively at and , we find and . The uncertainty on and caused by the error on the dispersion delay is , where pc cm is the uncertainty on the dispersion measure (DM) reported in Kramer2006, is the dispersion constant (see Handbook) and GHz, is found to be in phase, and can thus be neglected. The -ray emission from PSR J07373039A is thus offset from the radio emission, suggesting distinct origins in the magnetosphere of the pulsar. This also holds for the X-ray peaks detected by Chatterjee2007 in Chandra HRC data, which are likewise aligned with the radio peaks.
Finally, we have searched the OFF-pulse fraction of the data for modulation at the orbital period, caused by the collision of the particle winds from the pulsars, and we have also searched the ON-pulse signal for attenuation of the emission from pulsar A around conjunction, caused by, e.g., photon–light-pseudoscalar-boson oscillation in the magnetosphere of B, as proposed by Dupays2005. In both cases, we observed only steady emission as a function of orbital phase.
3. Constraining the Viewing
Geometry of PSR J07373039A
We can place constraints on the magnetic inclination and viewing angle by modeling the radio and -ray light curves and the radio polarization. For all models we assume the vacuum, retarded-dipole magnetic field geometry (Deutsch1955). The emission is assumed to originate in the open zone, determined by field lines that do not close within the light cylinder (at ), traced to foot points on the star surface at (radius of the neutron star), which define the polar cap. The computation and fitting procedure are described in Watters2009, Venter2009, RomaniWatters2010, and references therein.
In two of the prevalent models of -ray emission, uniformly emissive zones of the magnetosphere stand in for more physical models. The first is the outer gap picture (OG; Cheng1986; Yadigaroglu1995) in which radiation is emitted between the null charge surface where and . The second is the two-pole caustic model (TPC; Dyks2003), which we take to be a geometric realization of the slot gap model (Muslimov2004). In the original TPC model emission extends from the surface to 0.75 . In both geometries the -ray emission is confined toward the edge of the open zone coinciding with the last open field lines, in a “gap” idealized as a region of width , interior to an accelerating layer of width . In the OG model the -ray emission originates from a thin layer on the inner edge of the gap, closest to the magnetic pole, whereas in the TPC model emission is produced throughout the gap. The radio emission can occupy a large fraction of the open field lines, albeit generally at lower altitude.
3.1. Joint Radio and -Ray Light Curve Fits
One approach is to fit the -ray and radio light curves directly, following the geometrical light curve modeling of Venter2009, with the fitting procedure described in more detail in, e.g., Guillemot2012a. For these computations we assume ms and s s, and treat the radio pulse as a classical single-altitude, hollow-cone beam centered on the magnetic axis as described by Story2007. For this analysis we start from a grid of models with 1 steps in both and , and fit the emission zone accelerating and emitting gap widths, and , with steps of 2.5% of the polar cap opening angle (). For this computation we extend the emission to 0.95 .
The models are fit to an unweighted-counts -ray light curve for PSR J07373039A, constructed by selecting events from the data described in Section 2 found within 2 of the pulsar, with energies above 0.1 GeV and with probabilities of being associated with the pulsar larger than 0.05. In the case of low-statistics -ray light curves with sharp peaks such as those observed for PSR J07373039A, using a statistic with binned light curves may not be optimal as this statistic is often insensitive to the peaks. We have thus found that it is preferable to use the unweighted counts, which allow the use of Poisson likelihood, as opposed to the weighted counts which require using a statistic for binned light curves. The radio profile is fit with a statistic, assuming the same relative uncertainty for each phase bin, which is combined with the likelihood from the -ray fit to determine the best-fit model parameters from a scan over the model phase space. We used 30 bins for both the -ray and radio light curves in these fits.
One difficulty in joint fitting of the radio and -ray profiles is that the low statistical uncertainty of the radio light curve compared to the uncertainty of the -ray bins causes the fit to be dominated by the radio data and to ignore the constraints provided by the rays. Because our radio model is simplistic, this can lead to unrealistic solutions. We have therefore investigated different prescriptions for the “uncertainty” on the radio profile bins, in order to balance the radio and -ray contributions to the joint likelihood. The following prescription gives the most satisfactory results. First, we select an on-peak interval for the -ray light curve, which should dominate the likelihood, and define as the average, fractional uncertainty of the -ray bins in this interval. We then define a radio uncertainty , where denotes the maximum radio light curve bin. Although this prescription gives satisfactory results, it is arbitrary. We tested its sensitivity by varying by a factor of two (see Guillemot2012b); the resulting best-fit geometries changed by and for the TPC (OG) model. The latter values can be considered systematic errors on our fit results.
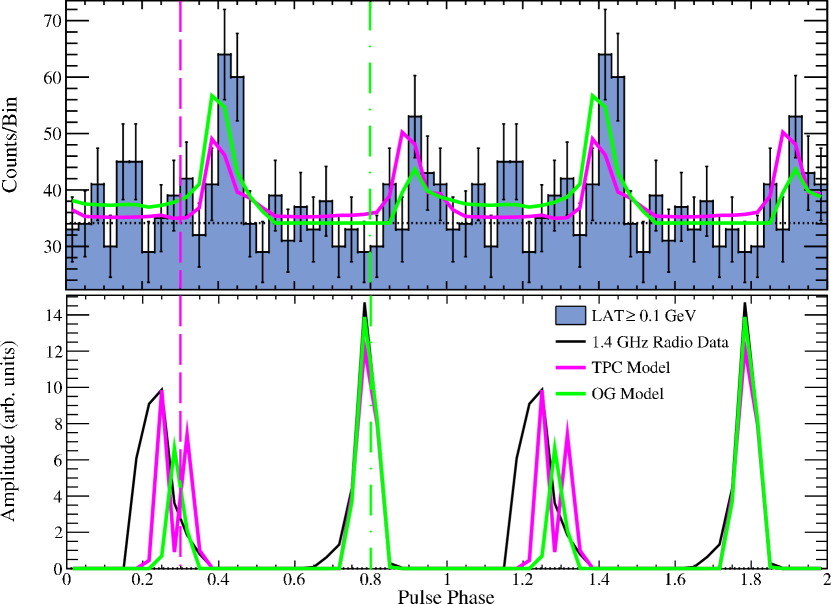
The best-fitting model light curves are shown in Figure 2, and the parameters are given in Table 2. The uncertainties are estimated from two-dimensional likelihood profiles for and and one-dimensional profiles for the other parameters. The best-fit gap widths for both models have size 0, indicating that they are unresolved by our simulations. The simple geometric models we use neglect important physics, e.g., the effects of magnetospheric charges and currents on the gaps, and cannot perfectly fit the data. We use this discrepancy to set the scale of our parameter constraints by rescaling the likelihood by its best fit value, reduced by one-half the degrees of freedom (dof). In the Gaussian approximation, this is equivalent to setting the best-fit reduced . With this normalization, the differences between the TPC and OG models are not significant. Also shown in Figure 2 are the closest approaches to the magnetic axis under the best-fit TPC and OG light curves. We note that our modeling finds different locations for the magnetic axis under the two geometries, due to the ambiguity in defining the first and second -ray peaks when the phase separation is close to 0.5.
Using these geometric models, the light curves obtained when reflecting across and are the same, but shifted by 0.5 in phase. We report confidence regions for and , but note that identical, reflected regions exist in the other three quadrants.
From the simulations, we can estimate the beaming correction factor (Watters2009) which relates emission along a given line-of-sight to the total flux. The values for the models are given in Table 2 with estimated uncertainties based on the confidence regions in the – plane. Both models suggest that this factor should be 1, implying corrected -ray efficiencies close to 10%.
| Model | aaIn the TPC model the accelerating and emitting gaps are the same. (% | (% | dof | ||||
|---|---|---|---|---|---|---|---|
| TPC | . . . | 0.02.5 | 121.0 | 54 | |||
| OG | 0.010.0 | 0.02.5 | 123.1 | 53 |
Note. — Using these geometric models the results are invariant under either a reflection across or .
In addition to standard TPC and OG models, we have explored two alternative geometries. In the first approach, a very low-altitude radio cone (low-altitude slot gap radio geometry) was invoked in conjunction with the usual TPC model for the rays. This was done in the context of a radio cone producing peaks leading the caustic -ray peaks. The second alternative, motivated by the idea that the radio may indeed have a dominating leading peak with the radio profile lagging the -ray light curve, assumed conal radio and -ray geometries, with the -ray cone being lower than that of the radio. The fits from these alternative approaches were not satisfactory, as they were unable to reproduce the observed radio and -ray peak shapes and separations, leading us to abandon these scenarios. However, they point to interesting avenues of model refinement, e.g., investigation of cones with non-uniform emissivities (such as patchy or one-sided radio cones), or non-aligned -ray and radio cones. Such refinements, which are expected to lead to improved light curve fits, are beyond the scope of the current paper and will be developed in future work (Seyffert2013).
We remark that the fitting results presented in this section were obtained by assuming that the observed radio emission from PSR J07373039A originates from both magnetic poles. It has been proposed that the non- separation of the two radio peaks and the overall symmetry of the profile imply that the radio emission originates from magnetic field lines associated with a single pole (see, e.g., Manchester2005). However, Ferdman2013 showed that this scenario would imply a high altitude origin for the radio emission in the pulsar’s magnetosphere. If both the radio and the rays originate from the outer magnetosphere, we would expect the pulses to be aligned in phase (Venter2012). The two-pole origin for the radio emission therefore seems to be a more natural solution.
3.2. Polarization Fitting
When attempting to understand pulsar viewing geometry, radio polarization can provide very powerful constraints. Although recycled pulsars are notoriously difficult to model, PSR J07373039A shows substantial linear polarization structure, and thus offers good prospects of constraining the orientation. In our polarization modeling we follow the conventional assumption that the electric vector position angle (P.A.) follows the projection onto the plane of the sky of the magnetic field line at the emission point. The P.A. sweep as one moves past the radio pole(s) thus probes the viewing geometry, with particularly strong constraints on . Our modeling extends beyond the point dipole rotating vector model (RVM; Radhakrishnan1969), to follow the distortion of the magnetic field as the emission zone moves to a non-negligible fraction of (Craig2012). In addition, we follow Karastergiou2009 in treating “orthogonal mode jumps” for which the P.A. shifts by , and optionally account for the effects of interstellar scattering (negligible for PSR J07373039A). For details see Craig2013.
| dof | ||||||
|---|---|---|---|---|---|---|
Note. — Errors are the extrema of the contours in the full multidimensional parameter space. is the emission altitude of the central component of P1 and the altitude of the central component of P2. marks the offset of the closest approach of the surface magnetic axis (in P1) from the total intensity peak in P2; this is phase 0.243 in Figure 1.