Evidence for AGN-driven Outflows in Young Radio Quasars
Abstract
We present near-infrared spectra of young radio quasars ( W Hz-1) selected from the Wide-Field Infrared Survey Explorer. The detected objects have typical redshifts of and bolometric luminosities erg s-1. Based on the intensity ratios of narrow emission lines, we find that these objects are mainly powered by active galactic nuclei (AGNs), although star formation contribution cannot be completely ruled out. The host galaxies experience moderate levels of extinction, mag. The observed [O III] 5007 luminosities and rest-frame -band magnitudes constrain the black hole masses to lie in the range . From the empirical correlation between black hole mass and host galaxy mass, we infer stellar masses of . The [O III] line is exceptionally broad, with full width at half maximum 1300 to 2100 km s-1, significantly larger than that of ordinary distant quasars. We argue that these large line widths can be explained by jet-induced outflows, as predicted by theoretical models of AGN feedback.
1 Introduction
Supermassive black holes (BHs) and their host galaxies appear to be closely linked in their formation and evolution (e.g., Magorrian et al. 1998; Gebhardt et al. 2000; Ferrarese & Merritt 2000). While the exact origin of their relationship is still under debate (Kormendy & Ho 2013), theoretical models often invoke feedback from active galactic nuclei (AGNs) as a crucial mechanism for establishing the correlation. Outflows are believed to be associated with AGN feedback, which regulate the growth of BHs and quench star formation by expelling gas (e.g., Di Matteo et al. 2005). AGN feedback also appears to be required for cosmological models to explain the upper end of the luminosity function of galaxies (e.g., Bower et al. 2006). Despite the potential importance of AGN feedback, direct observational evidence of this process is limited. For example, extended [O III] emission in high- radio galaxies and ultraluminous infrared galaxies (ULIRGs) associated with AGNs are thought to be signs of AGN-driven outflows (e.g., Nesvadba 2007; Nesvadba et al. 2011; Harrison et al. 2012).
Numerical simulations indicate that feedback is triggered during an intense and rapidly accelerated BH fueling phase during a gas-rich galaxy merger (Hopkins et al. 2008; Narayanan et al. 2010). Objects in the early feedback phase are likely to be both highly luminous and highly obscured by dust (Haas et al. 2003). Thus, young quasars can be effectively searched using their mid-infrared (MIR) spectral energy distribution (SED). However, to avoid confusion with dusty starbursts, whose MIR SED can be similarly red, an additional diagnostic besides the MIR color is needed to identify AGN-powered sources. Here we use the presence of a strong, compact radio source to confirm the AGN nature of our mid-infrared selected objects, in a similar fashion to Martínez-Sansigre et al. (2005; Nature, 436, 666). Our goal is to see whether young radio quasars show signatures of outflows that might be indicative of AGN feedback during the early stages of their evolution.
We use the Wide-Field Infrared Survey Explorer (WISE; Wright et al. 2010) to find luminous, obscured quasars (C. J. Lonsdale et al., in preparation). The sample is selected to be bright in 22 m ( mJy) and to have extremely red colors in the MIR, in the Vega magnitude system. Then we match the red objects from WISE to the NRAO VLA Sky Survey (Condon et al. 1998) to select sources with to ensure that the sample is powered by AGNs (Ibar et al. 2008). Finally, we only include sources with no extended radio structure, in order to avoid evolved radio galaxies. This results in 156 sources. We are in the process of performing follow-up observations to explore the origin of these sources and to search for observational signatures of AGN feedback. Here we present near-infrared (NIR) spectroscopic data of a subset of these young luminous quasars. Throughout the paper we adopt km s-1 Mpc-1, , and .
2 Spectroscopic Observations
As our sources are selected from WISE and are chosen to be very dusty,
they are expected to be very faint at shorter wavelengths. No reliable
photometry is available in the optical or NIR. From the observed W1
(3.6 m) flux density and an SED template for type 2 AGNs (Polletta et al.
2007), we estimate that our sources are fainter than 1921 AB mag in the
band. We obtained NIR (simultaneous , , and ) spectra for
24 objects using the Folded-port InfraRed Echellette (FIRE) on the Baade 6.5
meter telescope at Las Campanas Observatory on 27–29 July 2012 UT. The data
were taken in low-resolution prism mode using a 06 slit. The sky
conditions were clear and the seeing was 08 16. The
observations were taken at low airmasses
![[Uncaptioned image]](/html/1303.7194/assets/x1.png) (), with the slit aligned
along the parallactic angle.
Each object was dithered along the slit, with a
position offset of 9″ and an exposure time of 158 s in each position.
The total integration times range from 1902 s to 2536 s, split into several
repeats of ABBA sequences. Following each science target, we observed a
nearby A0V star (from a catalog provided by the Observatories) for telluric
and relative flux calibration. Since a majority of the selected A0V stars are
fairly bright, we slightly offset the slit from the center of the stars to
avoid saturation. Absolute flux calibration was performed using two fainter,
unsaturated stars that were properly centered on the slit. Since all of the
science objects are too faint to be seen on the slit image, we had to apply a
blind offset from the nearest Two-Micron All-Sky Survey (2MASS; Skrutskie et
al. 2006) source in order to place the object on the slit. For the typical
brightnesses of our sample, the relative astrometric
uncertainty111http://wise2.ipac.caltech.edu/docs/release/allsky/
between WISE and 2MASS is 04.
Given the seeing conditions
during the observing run, our absolute flux scale may have been underestimated
by up to . Moreover, it is possible that our source blind offset
acquisition procedure may have entirely missed some of the objects; this may
partly account for the low detection rate reported below.
The FIRE spectra cover 0.8 to 2.6 m with an instrumental resolution
of (1200 km s-1), as estimated from the
full width at half maximum (FWHM) of the arc lines.
(), with the slit aligned
along the parallactic angle.
Each object was dithered along the slit, with a
position offset of 9″ and an exposure time of 158 s in each position.
The total integration times range from 1902 s to 2536 s, split into several
repeats of ABBA sequences. Following each science target, we observed a
nearby A0V star (from a catalog provided by the Observatories) for telluric
and relative flux calibration. Since a majority of the selected A0V stars are
fairly bright, we slightly offset the slit from the center of the stars to
avoid saturation. Absolute flux calibration was performed using two fainter,
unsaturated stars that were properly centered on the slit. Since all of the
science objects are too faint to be seen on the slit image, we had to apply a
blind offset from the nearest Two-Micron All-Sky Survey (2MASS; Skrutskie et
al. 2006) source in order to place the object on the slit. For the typical
brightnesses of our sample, the relative astrometric
uncertainty111http://wise2.ipac.caltech.edu/docs/release/allsky/
between WISE and 2MASS is 04.
Given the seeing conditions
during the observing run, our absolute flux scale may have been underestimated
by up to . Moreover, it is possible that our source blind offset
acquisition procedure may have entirely missed some of the objects; this may
partly account for the low detection rate reported below.
The FIRE spectra cover 0.8 to 2.6 m with an instrumental resolution
of (1200 km s-1), as estimated from the
full width at half maximum (FWHM) of the arc lines.
We used the IDL package FIREHOSE for data reduction. Flat-field correction was done using images taken with an external quartz lamp. We used He+Ne+Ar arc lamp spectra for wavelength calibration. After extracting the one-dimensional spectra, we corrected for telluric absorption and applied flux calibration using the xtellcor package within the Spextool pipeline (Cushing et al. 2004; see Vacca et al. 2003 for a detailed description).
![[Uncaptioned image]](/html/1303.7194/assets/x4.png)
3 Spectral Properties
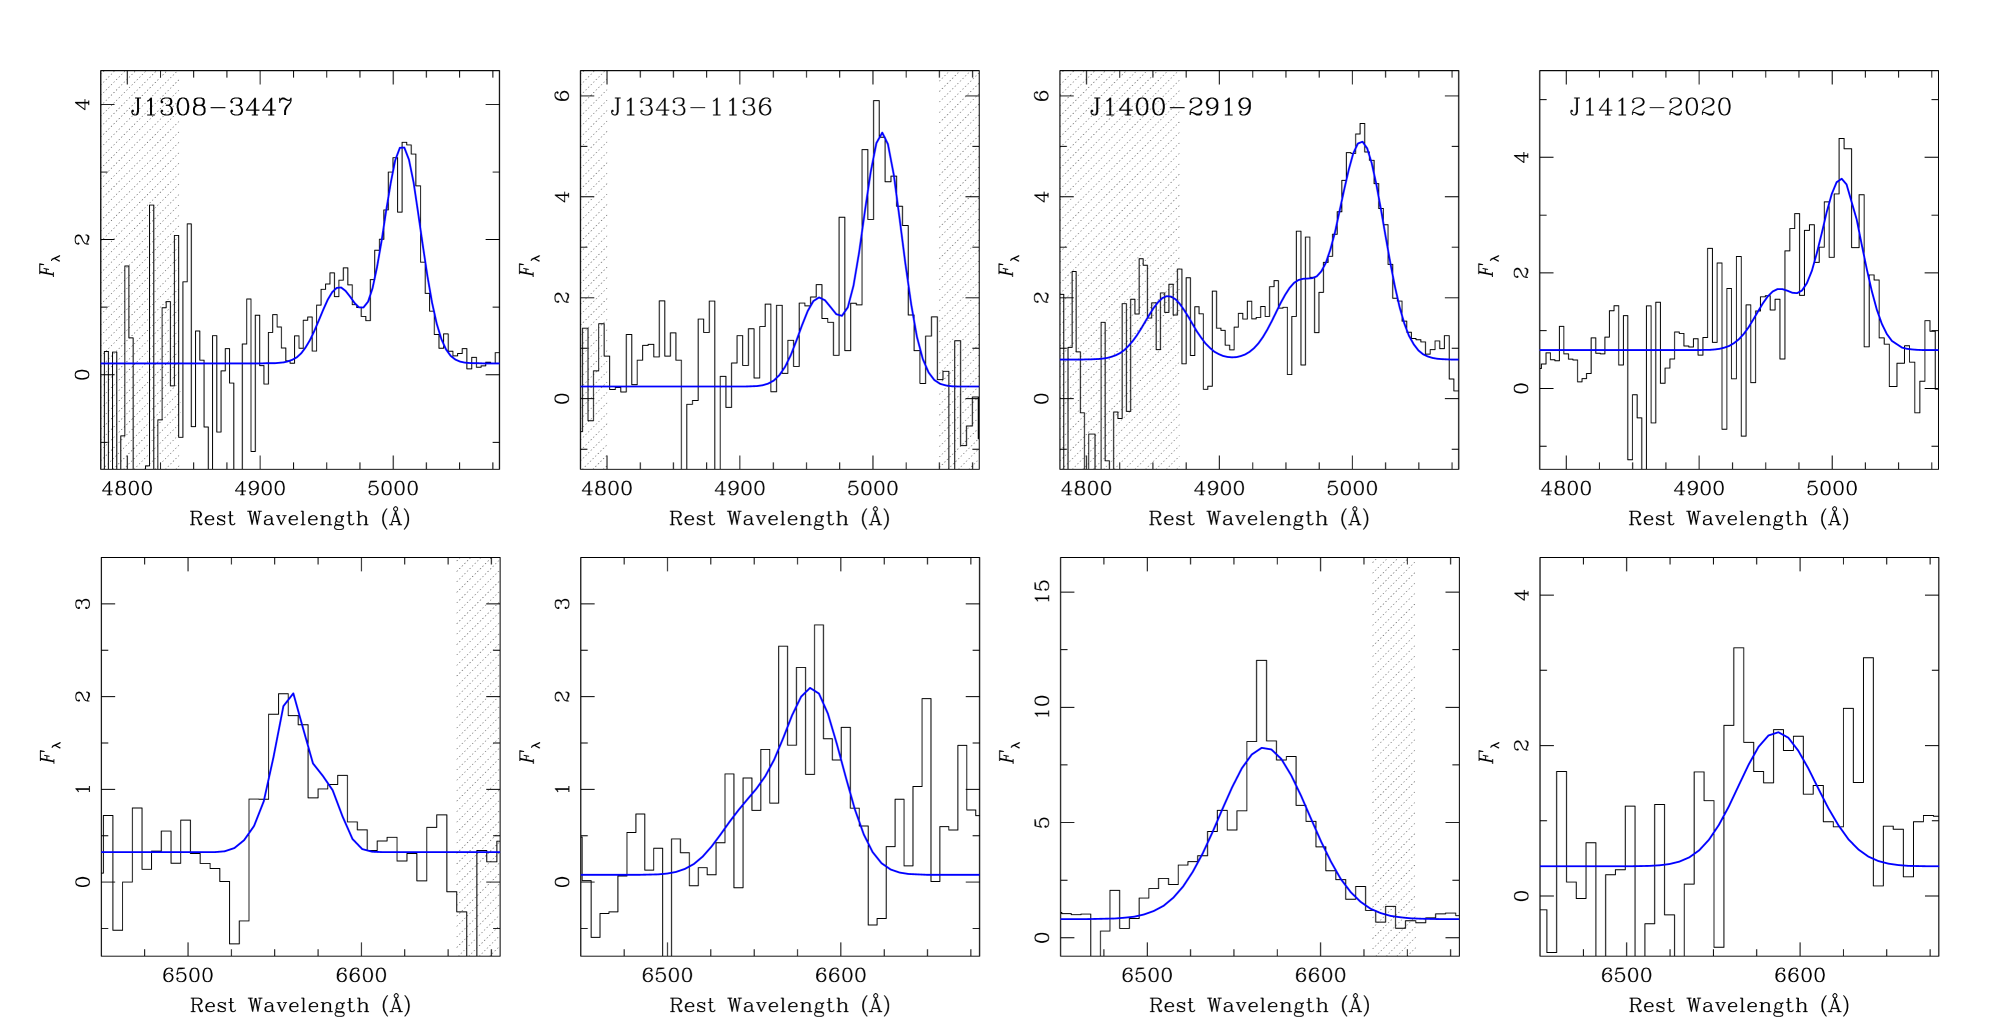
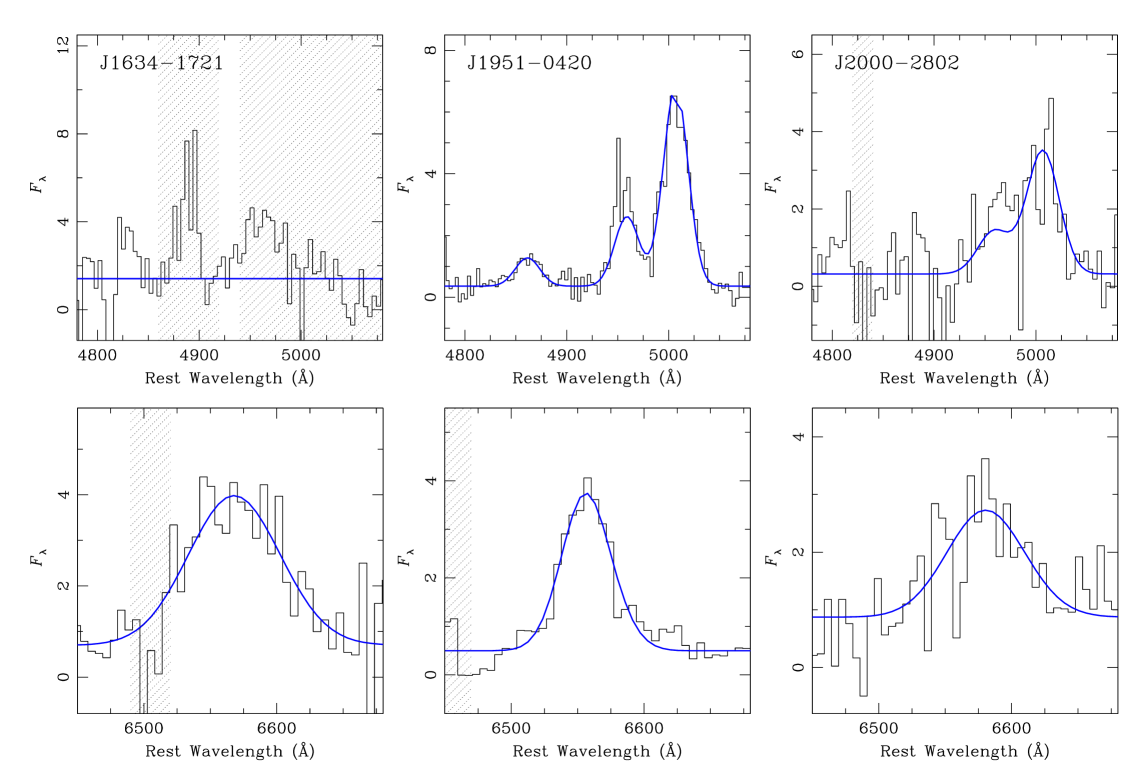
Table 1 lists the basic properties of the sample, including the total exposure times and the quality of the observed spectra. The signal-to-noise ratio of the FIRE spectra is too low to see the underlying continuum. We positively detected identifiable emission lines in seven out of the 24 objects observed (Table 2); their spectra are shown in Figure 1 and 2. The redshifts lie in the range . Six show [O III] 4959, 5007 and H, but in J the lines lie in spectral regions of strong telluric absorption and thus are somewhat uncertain. In J only H is detected. It is difficult to know why the majority of the sample was undetected. Possible reasons include: (1) the narrow-line region is heavily reddened by dust; (2) the emission lines coincide with strong OH lines or sky absorption; or (3) the slit was misplaced due to the astrometric uncertainty between WISE and 2MASS. In particular, since the accuracy of the telescope offsets is not precisely known throughout the night, it is hard to know which factors are dominantly responsible for the non-detection of emission lines. The detected sources are essentially indistinguishable from the undetected ones in terms of MIR flux, MIR color, or radio brightness.
We do not detect broad H or H in any of the objects. Assuming FWHM = 5000 km s-1 for a hypothetical broad component and , we can use the H virial mass formalism of Greene & Ho (2005b) to estimate the flux of broad H that should be present if our objects are genuinely unobscured type 1 AGNs. Comparing these expected values with the observed upper limits of broad H flux, we conclude that the broad-line region, if present, must be reddened by mag. This suggests that our objects are true type 2 quasars rather than the lightly reddened quasars usually selected using NIR colors (e.g., Glikman et al. 2012).
We follow the procedures outlined in Ho & Kim (2009) to fit the spectra to obtain basic parameters for the emission lines. We use a single Gaussian to fit H and each component of the doublet of [O III] 4959, 5007. The width is fixed to be the same for all three lines. We constrain the peak ratio of [O III] 4959 to [O III] 5007 to 2.88 and fix the separation between the two lines to the known value. For objects with no detection of H, we estimate a upper limit of its flux by using the width of [O III]. For J16341721, where [O III] is also undetected, we assume a Gaussian profile with km s-1. For H and [N II] 6548, 6583, we simply measure the integrated flux of the lines because they are severely blended at our spectral resolution.
Although H is reliably detected in only two sources (J14002919 and J19510420), the relatively high flux ratios of [O III] 5007 to H (3.4 and 7.0, respectively) suggest that the primary ionizing source of our sample is associated with AGNs rather than young stars. This finding is consistent with the strong radio emission relative to 22 m flux. However, because we do not resolve H from [N II], we cannot use the [N II]/H ratio and traditional optical line ratio diagnostic diagrams (e.g., Ho 2008) to completely rule out the possibility that star formation also contributes to the ionizing continuum. For the same reason, it is also hard to properly constrain the extinction of the host galaxy from the Balmer decrement. To estimate the H flux from the total flux of H+[N II], we adopt an average value of [N II]/H () derived from quasars selected from the Sloan Digital Sky Survey (SDSS; Shen et al. 2011). We estimate = 1.3 and 0.0 mag for J14002919 and J19510420, respectively; the upper limit of H for J20002802 yields a lower limit of mag. These values of are surprisingly low for MIR-selected sources, but they might be biased in view of the large number of nondetections, which may be heavily extincted.
Interestingly and quite surprisingly, the [O III] lines are spectrally resolved for all detected sources. The FWHM of the line, corrected for instrumental resolution, ranges from 1320 to 2120 km s-1.
4 Discussion
4.1 Black Hole Mass and Host Galaxy Mass
Since the bolometric luminosity of an AGN should not exceed the Eddington limit for a given BH mass (but see Abramowicz et al. 1988), we can estimate a lower limit to the BH mass from the observed luminosity, using, as commonly done, the [O III] luminosity as a proxy for the bolometric luminosity. The [O III] luminosities of our sample range between and erg s-1. These are likely conservative lower limits because we have not accounted for extinction, and, in any case, our observations may suffer from significant slit losses (see Section 2). Yet, these [O III] luminosities lie in the upper end of the luminosity distribution of optically selected type 2 quasars (Reyes et al. 2008). Using a bolometric correction factor of (Shen et al. 2011), we obtain . A caveat is that the correction factor can be slightly overestimated in the radio-loud AGNs due to the enhanced [O III] (e.g., Stern & Laor et al. 2012). From the correlation between BH mass and host galaxy mass, we suspect that these systems may be hosted by very massive galaxies at this epoch. Taking into account the cosmic evolution of the BH mass-stellar mass relation (Decarli et al. 2010), we estimate . These mass estimates are, of course, highly uncertain, depending on, among other things, the strict validity of the Eddington limit, the bolometric correction for [O III], reddening and slit loss corrections, and the relation and its uncertain redshift dependence.
On the other hand, we can independently estimate upper limits to the mass of the hosts using the observed MIR luminosity. Given the redshift range of the sample (), the 3.4 m band roughly corresponds to the rest-frame band. Since the contribution from hot dust emission heated by the AGN might not be negligible in this band (e.g., Urrutia et al. 2012), it only allows us to derive an upper limit to the stellar mass of the hosts. We convert the observed 3.4 m flux to the rest-frame band using the template spectrum of type 2 Seyferts from Polletta et al. (2007). Different choices in templates (e.g., starbursts instead of Seyfert 2s) lead to only moderate (0.1 mag) differences in the resulting -band magnitudes. For simplicity, we adopt spectral models from Bruzual & Charlot (2003) by assuming a single stellar population with formation redshift 2.5, 3, 3.5, and 5, solar metallicity, and a Salpeter (1955) stellar initial mass function. With these assumptions, we derive as a function of redshift; it varies between 0.4 and 1. The average scatter in at a given redshift due to different is dex. Thus, and correspondingly . These estimates neglect the effects of dust extinction.
The above considerations suggest that the host galaxies of our young quasars have stellar masses . They populate the massive end of the galaxy stellar mass function at (Daddi et al. 2004) and will evolve to become the most massive early-type galaxies at .
The width of [O III] can serve as a surrogate for the stellar velocity dispersion (; e.g., Nelson 2000; Greene & Ho 2005a; Ho 2009). The derived range from 550 to 890 km s-1. These are clearly implausible: no galaxy is known to exceed km s-1 (Salviander et al. 2008). The [O III] line must be significantly broadened by non-gravitational forces, presumably associated with an outflow or disk-wind (e.g., Whittle 1992; Greene & Ho 2005a).
4.2 AGN Feedback
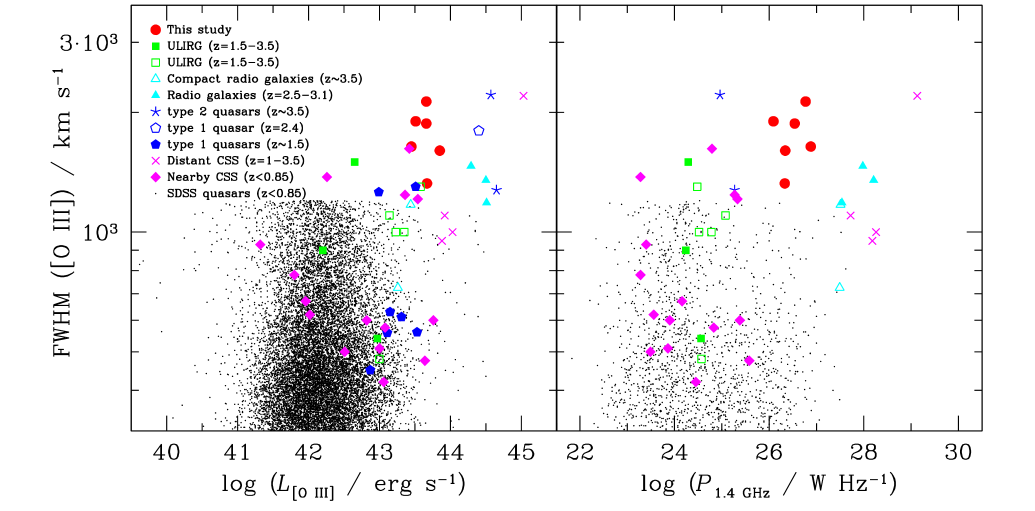
There is mounting evidence that broad [O III] emission is related to AGN-driven outflows (e.g., Nesvadba et al. 2007; Harrison et al. 2012). Figure 3 (left) shows the correlation between the FWHM and luminosity of [O III] for various types of quasars and radio galaxies. Where the line was fit with two Gaussians in the literature, we plot the broad and narrow components open and filled symbols, respectively; single-Gaussian fits are plotted with solid symbols. Clearly, our sample has extremely broad [O III] line widths compared to other sources with similar redshift and luminosity. Excluding the SDSS quasars222We include the low- SDSS quasars for illustration purposes only. The [O III] FWHM for the sample (Shen et al. 2011), may be somewhat biased toward lower values because they were derived from a narrow component, while the fit was done with two (narrow+broad) components., we find a weak correlation between FWHM and with a Spearman’s rank correlation coefficient of 0.54 (). This correlation has been known for various types of AGNs (e.g., Ho et al. 2003, and references therein), although our trend is driven by sources with extreme line widths (1000 km s-1) compared to those in previous studies (a few hundred km s-1). While the origin of the correlation between FWHM and is still unclear (e.g., Whittle 1992; Ho et al. 2003), the very large line widths seen in our sample almost certainly do not track gravitational motions (see §4.1). Instead, the most natural explanation for the supervirial velocities is that they reflect the kinematics of AGN-driven outflows, which seem to be prevalent in our sample of young radio quasars. The flux ratio of radio to [O III] for our sources is slightly lower than in high- radio galaxies and compact steep-spectrum (CSS) sources, indicating that our sample is moderately radio-loud.
A jet-induced origin for the large velocities is supported by the distribution of [O III] FWHM and radio power (Figure 3, right), which qualitatively resembles trends noted by Heckman et al. (1981) and Nesvadba et al. (2011). Integral-field spectroscopy of high-z AGNs with broad [O III] lines finds that the emission is often associated with extended outflows of ionized gas (e.g., Nesvadba et al. 2011; Cano-Díaz et al. 2012). The energy deposition of the outflows cannot be fully explained by star formation, suggesting that an additional source of energy must come from the AGN (e.g., Harrison et al. 2012). Spatially resolved spectroscopy is needed to estimate the energy contribution from AGNs in our sample.
Our WISE-selected, radio-emitting AGNs bears an interesting similarity to CSS sources, whose small physical extent ( a few kpc) and steep radio spectrum suggest that they are young radio galaxies (Fanti et al. 1990). The broad and complex velocity profiles of [O III] observed in CSS sources are thought to arise from interaction between the radio jet and the interstellar medium of the host (Gelderman & Whittle 1994; Holt et al. 2008). Figure 3 shows that bona fide CSS sources tend to have larger [O III] widths compared to ordinary SDSS quasars; the line width enhancement is largest for more distant systems. Our sample, selected to be both dusty and compact in radio morphology, qualitatively resembles CSS sources, although we presently do not yet have sufficient radio spectral information to firmly confirm this association. Follow-up interferometric radio observations are under way.
Theoretical models of galaxy formation that invoke AGN feedback often link ULIRGs and quasars through an evolutionary sequence mediated by galaxy merging (e.g., Di Matteo et al. 2005). In this model, a massive, gas-rich merger begins with a ULIRG phase dominated by star formation, which then evolves into ULIRGs that host AGNs, young quasars, and then finally to optically revealed quasars with suppressed star formation. The strength of AGN feedback is expected to dramatically increase in the later stages. In ULIRGs with AGNs, Harrison et al. (2012) found striking evidence for AGN feedback from the detection of spatially extended [O III] emission and broad line widths ranging from 900 to 1400 km s-1. Their sample is also detected in the submillimeter, indicating substantial ongoing star formation. Interestingly, our sample has even larger line widths than theirs, although the stellar masses of the host galaxies we deduced for our sources are comparable (e.g., Hickox et al. 2012).
References
- (1) Abramowicz, M. A., Czerny, B., Lasota, J. P., & Szuszkiewicz, E. 1988, ApJ, 332, 646
- (2) Bower, R. G., Benson, A. J., Malbon, R., et al. 2006, MNRAS, 370, 645
- (3) Bruzual, G., & Charlot, S. 2003, MNRAS, 344, 1000
- (4) Cano-Díaz, M., Maiolino, R., Marconi, A., et al. 2012, A&A, 537, L8
- (5) Condon, J. J., Cotton, W. D., Greisen, E. W., et al. 1998, AJ, 115, 1693
- (6) Cushing, M. C., Vacca, W. D., & Rayner, J. T. 2004, PASP, 116, 362
- (7) Daddi, E., Cimatti, A., Renzini, A., et al. 2004, ApJ, 617, 746
- (8) Decarli, R., Falomo, R., Treves, A., et al. 2010, MNRAS, 402, 2453
- (9) Di Matteo, T., Springel, V., & Hernquist, L. 2005, Nature, 433, 604
- (10) Fanti, R., Fanti, C., Schilizzi, R. T., et al. 1990, A&A, 231, 333
- (11) Ferrarese, L., & Merritt, D. 2000, ApJ, 539, L9
- (12) Gebhardt, K., Bender, R., Bower, G., et al. 2000, ApJ, 539, L13
- (13) Gelderman, R., & Whittle, M. 1994, ApJS, 91, 491
- (14) Glikman, E., Urrutia, T., Lacy, M., et al. 2012, ApJ, 757, 51
- (15) Greene, J. E., & Ho, L. C. 2005a, ApJ, 627, 721
- (16) Greene, J. E., & Ho, L. C. 2005b, ApJ, 630, 122
- (17) Gültekin, K., Richstone, D. O., Gebhardt, K., et al. 2009, ApJ, 698, 198
- (18) Haas, M., Klaas, U., Müller, S. A. H., et al. 2003, A&A, 402, 87
- (19) Harrison, C. M., Alexander, D. M., Swinbank, A. M., et al. 2012, MNRAS, 426, 1073
- (20) Heckman, T. M., Miley, G. K., van Breugel, W. J. M., & Butcher, H. R. 1981, ApJ, 247, 40
- (21) Hickox, R. C., Wardlow, J. L., Smail, I., et al. 2012, MNRAS, 421, 284
- (22) Hirst, P., Jackson, N., & Rawlings, S. 2003, MNRAS, 346, 1009
- (23) Ho, L. C. 2008, ARA&A, 46, 475
- (24) Ho, L. C. 2009, ApJ, 699, 638
- (25) Ho, L. C., Filippenko, A. V., & Sargent, W. L. W. 2003, ApJ, 583, 159
- (26) Ho, L. C., Goldoni, P., Dong, X.-B., Greene, J. E., & Ponti, G. 2012, ApJ, 754, 11
- (27) Ho, L. C., & Kim, M. 2009, ApJS, 184, 398
- (28) Holt, J., Tadhunter, C. N., & Morganti, R. 2008, MNRAS, 387, 639
- (29) Hopkins, P. F., Cox, T. J., Keres̆, D., & Hernquist, L. 2008, ApJS, 175, 390
- (30) Ibar, E., Cirasuolo, M., Ivison, R., et al. 2008, MNRAS, 386, 953
- (31) Kormendy, J., & Ho, L. C. 2013, ARA&A, in press
- (32) Magorrian, J., Tremaine, S., Richstone, D., et al. 1998, AJ, 115, 2285
- (33) Martínez-Sansigre, A., Rawlings, S., Lacy, M., et al. 2005, Nature, 436, 666
- (34) McConnell, N. J., Ma, C.-P., Murphy, J. D., et al. 2012, ApJ, 756, 179
- (35) Narayanan, D., Dey, A., Hayward, C. C., et al. 2010, MNRAS, 407, 1701
- (36) Nelson, C. H. 2000, ApJ, 544, L91
- (37) Nesvadba, N. P. H., Lehnert, M. D., Davies, R. I., Verma, A., & Eisenhauer, F. 2008, A&A, 479, 67
- (38) Nesvadba, N. P. H., Lehnert, M. D., De Breuck, C., Gilbert, A., & van Breugel, W. 2007, A&A, 475, 145
- (39) Nesvadba, N. P. H., Polletta, M., Lehnert, M. D., et al. 2011, MNRAS, 415, 2359
- (40) Polletta, M., Tajer, M., Maraschi, L., et al. 2007, ApJ, 663, 81
- (41) Reyes, R., Zakamska, N. L., Strauss, M., et al. 2008, AJ, 136, 2373
- (42) Salpeter, E. E. 1955, ApJ, 121, 161
- (43) Salviander, S., Shields, G. A., Gebhardt, K., Bernardi, M., & Hyde, J. B. 2008, ApJ, 687, 828
- (44) Shen, Y., Richards, G. T., Strauss, M. A., et al. 2011, ApJS, 194, 45
- (45) Skrutskie, M. F., Cutri, R. M., Stiening, R., et al. 2006, AJ, 131, 1163
- (46) Stern, J. & Laor, A. 2012, MNRAS, 426, 2703
- (47) Urrutia, T., Lacy, M., Sppon, H. W. W., et al. 2012, ApJ, 757, 125
- (48) Vacca, W. D., Cushing, M. C., & Rayner, J. T. 2003, PASP, 115, 389
- (49) Whittle, M. 1992, ApJ, 387, 121
- (50) Wright, E. L., Eisenhardt, P. R. M., Mainzer, A. K., et al. 2010, AJ, 140, 1868