![[Uncaptioned image]](/html/1303.7142/assets/x1.png)
Why a Windy Torus?
S. C. Gallagher1,
M. M. Abado1,
J. E. Everett2,
S. Keating3,
and
R. P. Deo4
1
University of Western Ontario
2 Northwestern University
3 University of Toronto
Abstract
Mass ejection in the form of winds or jets appears to be as fundamental to quasar activity as accretion, and can be directly observed in many objects with broadened and blue-shifted UV absorption features. A convincing argument for radiation pressure driving this ionized outflow can be made within the dust sublimation radius. Beyond, radiation pressure is even more important, as high energy photons from the central engine can now push on dust grains. This physics underlies the dusty-wind model for the putative obscuring torus. Specifically, the dusty wind in our model is first launched from the outer accretion disk as a magneto-centrifugal wind and then accelerated and shaped by radiation pressure from the central continuum. Such a wind can plausibly account for both the necessary obscuring medium to explain the ratio of broad-to-narrow-line objects and the mid-infrared emission commonly seen in quasar spectral energy distributions. A convincing demonstration that large-scale, organized magnetic fields are present in radio-quiet active galactic nuclei is now required to bolster the case for this paradigm.
1 Introduction
Researchers currently studying active galactic nuclei agree on a few key premises. The central engine is powered by a supermassive black hole, and the optical through ultraviolet continuum emission is generated by optically thick material in an accretion disk within the central parsec down to a few gravitational radii. Important specifics such as the thickness of the disk as a function of radius are still being hashed out, but the overall picture is consistent; it is hard to avoid disk formation given the persistence of angular momentum. Moving to larger radii, ionized gas moving at high velocities covers approximately % of the sky and gives rise to broad (1000s km s-1) resonance and semi-forbidden emission lines that characterize Type 1 quasars and Seyfert galaxies. In many luminous quasars, the broad UV emission lines show signatures of winds. The most obvious are the P Cygni profiles seen in the high ionization resonance lines of Broad Absorption Line (BAL) quasars (e.g., [19]). More subtle are the blue-shifts and asymmetries seen in the same lines in other luminous quasars (e.g., [17]). The wind manifest in these lines is understood to be driven by radiation pressure on ions at UV resonance transitions. For the wind to be launched in the vicinity of the broad-line region, the quasar continuum must not only have significant power in the UV – the source of the line-driving photons – but not too much power in the X-ray. X-rays will strip atoms such as C and O of their electrons, thus dropping the absorption cross section dramatically. Overionized gas can therefore only be driven by Thomson scattering, which is much less efficient than line driving (e.g., [5]). The elegant picture of Murray et al. [15] that unifies the broad emission lines seen in all quasars with the BAL wind directly observed in only % (e.g., [9]) by generating broad emission lines in an equatorial disk wind is compelling, but has not been widely adopted in other models. Broad-line “clouds” are still evoked as the source of the broad-line emission, though the smoothness of the broad-line profiles and the requirement of some means of pressure-confinement to prevent the putative clouds from shredding remain persistently unsolved problems in the cloud picture (e.g., [14]).
One structure that is even more uncertain is the so-called torus. The inner radius of the torus is set by the dust sublimation radius, beyond which some fraction of the accretion disk continuum is absorbed by grains and reradiated. Operationally, the torus must account for the of the integrated radiant quasar power that comes out in the near-to-mid-infrared. Furthermore, it must obscure the central continuum and broad-line region in a significant fraction of Type 2 objects. While a static toroidal structure (whether smooth or clumpy) beyond the dust sublimation radius will serve these purposes, such a cold (100–1500 K) structure with the dust mass implied by the mid-infrared luminosity would quickly become gravitationally unstable and collapse. This is an old problem, which was addressed by Königl & Kartje [12] with a magneto-hydrodynamically launched wind, shaped also by radiation pressure, on dust. This picture was expanded by our group ([11]; hereafter K12) by incorporating dust-radiation driving into the magneto-hydrodynamic (MHD) wind models of Everett [4], and then illuminating the wind with the central continuum to generate a model spectral energy distribution (SED). While the details of the shape of the output continuum still require some refining to match those observed, the overall power and general shape generated by our ‘fiducial’ model is promising. This model uses as inputs the empirical SDSS composite quasar continuum [16], a black hole mass of , an Eddington ratio of , and a column density at the base of the wind of cm-2. We assume a Milky Way interstellar-medium dust distribution. In this article, we expand on the results presented in K12 by exploring how key input model properties affect the structure of the wind.
2 The Dusty Wind Model
Following Blandford & Payne [2] and Königl & Kartje [12], we model the torus as a self-similar dusty wind driven by MHD forces and radiation pressure. The MHD radiative wind code has been described in more detail previously [4, 11], and we give only a brief outline here. First, a purely MHD-driven wind solution is calculated given a set of initial conditions input by the user. Next, Cloudy (version 06.02.09b, as described by [6]) is called to calculate the radiation field and dust opacity in the wind, allowing for the model to determine the radiative acceleration of the wind due to the central accretion disk continuum. A new MHD solution is calculated for the wind, now taking into account the radiative acceleration, and the process is iterated until the wind converges to a stable profile.
Operationally, our assumption of self-similarity means that several important quantities, including magnetic field strength and mass density, scale with spherical radius; this simplifies the calculation of the solution to the MHD equations considerably. Furthermore, it allows for the incorporation of radiation pressure from the disk by simply reducing the effective gravitational potential. Importantly, it allows us to use one streamline as an approximate template for the entire wind, simply scaling appropriately inwards or outwards to find properties of the specific region of the wind under consideration.
The final, converged MHD radiative wind model therefore provides the wind structure necessary to calculate the mass density of the wind as a function of r, the radial distance from the axis of rotation of the disk, and z, the vertical distance from the plane of the disk. The model supplies the density along each streamline as a function of the mass density at the base of the streamline and of polar angle. The density of the wind at any arbitrary point is then relatively easy to calculate as a consequence of the self-similarity assumption. Because we know the shape of the wind streamlines, we can use the shape of a single streamline to trace back from an arbitrary point to the disk-launching radius for any wind streamline. From there, we use our knowledge of the number density of particles on the disk at the inner launch radius and the fact that it is assumed to be proportional to [2] to find the number density at the launch radius of that particular streamline. We convert from mass density to number density by assuming that the average particle has the mass of a proton, thus allowing us to find the number density at our specified point.
3 Properties of the Wind
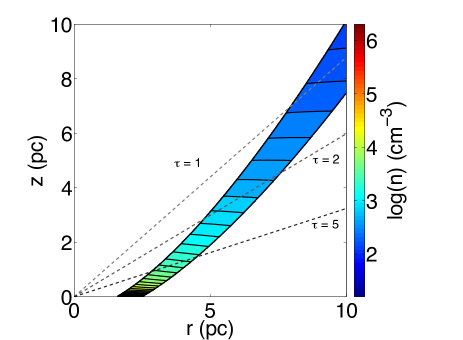
In Figure 1 we present a color map plot of the number density of the dusty wind as a function of r and z for the fiducial model. The inner wind launch radius is set by the dust sublimation radius. The notable thinness of the wind is a consequence of the model parameters: in general, the outer wind launch radius is given by:
| (1) |
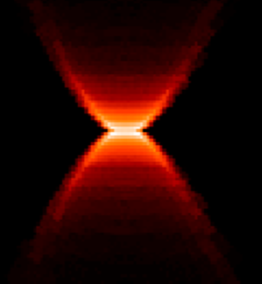
for user-specified values of the inner launch radius , the number density at the inner launch radius , and the column density along the base of the wind . A simulated high-resolution image of the wind at 9.5 m heated by the central continuum is shown in the right panel of Fig. 1. The hourglass shape is characteristic of MHD winds, and reminiscent of the outflows seen in young stars. It illustrates clearly that the base of the wind and the inner streamlines dominate the emission at this wavelength; the brightest 9.5 m emission regions would correspond to the largest extinction values in the optical. Eight to 13 m interferometric observations have led Hönig et al. [10] to infer a similar structure and characteristic size scale ( pc) for the dust distribution in the Seyfert 2 galaxy NGC 424.
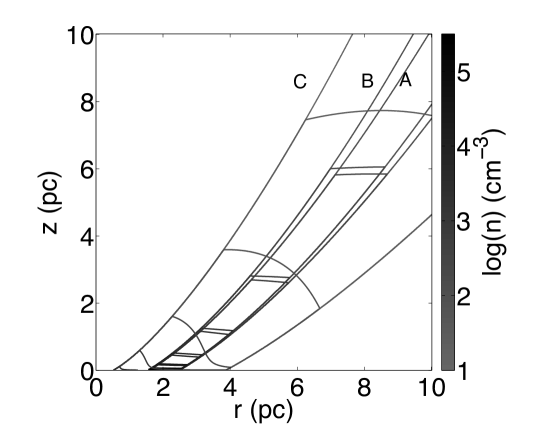
As luminous quasars are typically farther away and therefore fainter and of smaller angular size compared to nearby Seyferts, they are beyond the reach of the current generation of interferometers. Nonetheless, within the context of our model we can explore what might be expected by investigating the effects of changing luminosity, , and on the structure of the wind. Figure 2 illustrates the shape of the fiducial wind model (labeled as A) compared to two other models. Model B has a black hole mass of , ten times that of the fiducial model. Because the value of is fixed at 0.1, this model is 10 times more luminous than the fiducial model. The resultant shape of the wind is nearly identical to that of the fiducial model; the streamlines are slightly more vertical. The third model, C, is also similar to the fiducial model, this time changing only the inner wind launch radius to approximately one third of the fiducial model’s inner radius. The change in the inner radius was made to approximate the difference between the launch radius of graphites (with a higher sublimation temperature) versus silicates. This decrease in the inner launch radius causes the wind to be notably broader in our model (see Fig. 3), as expected from Equation 1. Because the bulk of the near-infrared emission is coming from the innermost streamlines, it therefore follows that a smaller for a given generates more near-IR emission because of the higher dust temperatures [11]. The strength of the 3–5 m bump – the manifestation of a larger contribution to the near-to-mid-infrared SED from hot dust – is seen empirically to increase with increasing quasar luminosity (e.g., [16, 7, 13]). Within the dusty wind paradigm, this implies some mechanism for decreasing the wind launching radius as a function of luminosity which is challenging to arrange. A second way of reducing is to reduce while keeping the black hole mass constant. This is also consistent with the expected movement of the dust sublimation boundary to smaller radii. The slight change in wind structure from altering but keeping constant compared with the large change from decreasing by a factor of 10 shows that the Eddington ratio is the relevant driver given our assumed wind structure. However, while the effects on the wind structure are noticeable when compared to the fiducial model, this physical difference did not lead to a significant change in the shape of the output SED [11].
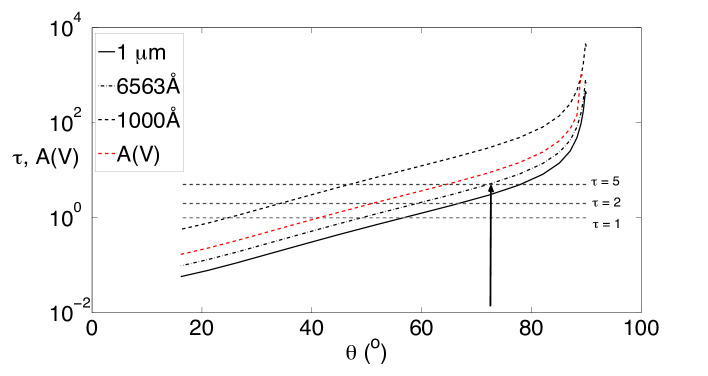
The column densities of 30 elements at each ionization state as well as those of several important molecules are calculated by Cloudy. Because they are part of a wind, these column densities are smooth functions of inclination angle, monotonically increasing toward the plane of the disk, where the polar angle . Therefore, they offer no obvious inclination angle to choose as the boundary for our wind. Therefore, a plot of column density versus height does not show any obvious features that define a ‘height’ for the wind. Also available from Cloudy is the cross section per proton for the dust in the wind as a function of photon energy. When multiplied by the total column density of hydrogen (i.e., both neutral and ionized), this serves as a measure of the optical depth of the wind. Figure 3 shows the optical depth as a function of polar angle for a few selected wavelengths. This optical depth is also a smooth function of for a wide range of wavelengths, and similarly provides no obvious angle to mark the boundary of the wind. We have therefore chosen the angle at which the dust reaches an optical depth of 5 for light at a wavelength of 6563 Å (the wavelength of emission) to be a reasonable definition of the opening angle of the dusty wind. At this value of , only 0.7% of the broad emission is transmitted through the wind, and so a quasar viewed from this inclination angle (or closer to the disk) would be classified as an optical narrow-line object.
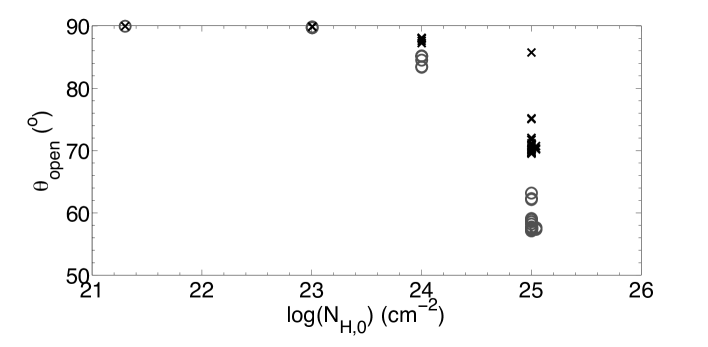
Typical opening angles using this criterion are around 70∘, which would lead to Type 2 to Type 1 ratios of %. This is on the low end of the range of estimates (e.g., [8, 18]). However, if accretion disks are randomly oriented with respect to their host galaxies as expected, the observed Type 2 fractions are inflated with respect to the torus-covering fraction because of line-of-sight obscuration occurring from dust within the host galaxy. The modeled range of opening angles is tight, and shows little dependence on model input parameters with the exception of the column density at the base of the wind, and the inner wind launch radius. This can be seen in Figure 4, where there is a clear trend relating the opening angle and the base column density with relatively little spread among the suite of models from K12.
4 Conclusions and Future Work
Getting the dusty-wind model to the point where it can plausibly account for the detailed structure in near-to-mid-infrared quasar SEDs requires additional refinement. In particular, we have not taken into account the expected dust-free component of the wind that is interior to the dust sublimation radius. The strong absorption within the wind as seen in the X-ray and UV spectra of BAL quasars will significantly modify the continuum impinging upon the dusty wind. Specifically, we expect the dust sublimation radius to be pushed to smaller values. However, the specific effects of the broad-line region gas shielding the dusty wind from the continuum will depend on its column density and ionization state; this is the subject of ongoing investigations.
More generally, the viability of the dusty MHD disk wind paradigm requires an investigation into whether relatively strong (mG to G), large-scale poloidal magnetic fields persist within the central parsecs of quasar host galaxies. Certainly quasars with jets have magnetic fields; radio synchrotron emission is observed. Galaxies also show organized magnetic fields on large scales, but they are much weaker, of order 10 G (e.g., [1]). Within the dense cores of molecular clouds in our Galaxy, magnetic fields with strengths up to a few mG have been measured (e.g., [3]). The physical scale and number density of such cores (0.02–20 pc and cm-3) span that expected in tori. In the near future, the available sensitivity and spatial resolution of ALMA and the Jansky VLA are promising for placing meaningful constraints on the strengths of organized fields within the central few parsecs of radio-quiet active galactic nuclei.
Acknowledgments
This work was supported by the Natural Science and Engineering Research Council of Canada and the Ontario Early Researcher Award Program.
References
- [1] Beck, R., Brandenburg, A., Moss, D., Shukurov, A., & Sokoloff, D. 1996, ARAA, 34, 155
- [2] Blandford, R. D. & Payne, D. G. 1982, MNRAS, 199, 883
- [3] Crutcher, R. M. 1999, ApJ, 520, 706
- [4] Everett, J. E. 2005, ApJ, 631, 689
- [5] Everett, J. E. & Ballantyne, D. R. 2004, ApJ, 615, L13
- [6] Ferland, G. J., Korista, K. T., Verner, D. A., Ferguson, J. W., Kingdon, J. B., & Verner, E. M. 1998, PASP, 110, 761
- [7] Gallagher, S. C., Richards, G. T., Lacy, M., Hines, D. C., Elitzur, M., & Storrie-Lombardi, L. J. 2007, ApJ, 661, 30
- [8] Hao, L., et al. 2005, AJ, 129, 1795
- [9] Hewett, P. C. & Foltz, C. B. 2003, AJ, 125, 1784
- [10] Hönig, S. F., Kishimoto, M., Antonucci, R., Marconi, A., Prieto, M. A., Tristram, K., & Weigelt, G. 2012, ApJ, 755, 149
- [11] Keating, S. K., Everett, J. E., Gallagher, S. C., & Deo, R. P. 2012, ApJ, 749, 32
- [12] Königl, A. & Kartje, J. F. 1994, ApJ, 434, 446
- [13] Krawczyk, C. M., et. al 2013, ApJ, submitted
- [14] Murray, N. & Chiang, J. 1997, ApJ, 474, 91
- [15] Murray, N., Chiang, J., Grossman, S. A., & Voit, G. M. 1995, ApJ, 451, 498
- [16] Richards, G. T., et al. 2006, ApJS, 166, 470
- [17] — 2011, AJ, 141, 167
- [18] Simpson, C. 2005, MNRAS, 360, 565
- [19] Weymann, R. J., Morris, S. L., Foltz, C. B., & Hewett, P. C. 1991, ApJ, 373, 23
- [20] Wolf, S. 2003, Computer Physics Communications, 150, 99