Potential of EBL and cosmology studies with the Cherenkov Telescope Array
Abstract
Very high energy (VHE, E 100 GeV) -rays are absorbed via interaction with low-energy photons from the extragalactic background light (EBL) if the involved photon energies are above the threshold for electron-positron pair creation. The VHE gamma-ray absorption, which is energy dependent and increases strongly with redshift, distorts the VHE spectra observed from distant objects. The observed energy spectra of the AGNs carry, therefore, an imprint of the EBL. The detection of VHE gamma-ray spectra of distant sources (z = 0.11 - 0.54) by current generation Imaging Atmospheric Cherenkov Telescopes (IACTs) enabled to set strong upper limits on the EBL density, using certain basic assumptions about blazar physics. In this paper it is studied how the improved sensitivity of the Cherenkov Telescope Array (CTA) and its enlarged energy coverage will enlarge our knowledge about the EBL and its sources. CTA will deliver a large sample of AGN at different redshifts with detailed measured spectra. In addition, it will provide the exciting opportunity to use gamma ray bursts (GRBs) as probes for the EBL density at high redshifts.
keywords:
1 Introduction
1.1 Cherenkov Telescope Array
The proposed Cherenkov Telescope Array (CTA)111http://www.cta-observatory.org/ [1, 2] is a large array of Cherenkov telescopes of different sizes for the detection of very-high energy gamma-rays. CTA will cover an energy range from 10s of GeV up to 100s of TeV with an unprecedented sensitivity – a factor of 10 or more improvement over current generation instruments such as H.E.S.S 222http://www.mpi-hd.mpg.de/hfm/HESS/, MAGIC333http://wwwmagic.mpp.mpg.de/, and VERITAS444http://veritas.sao.arizona.edu/ –, and provide an excellent precision in energy (order of 10–15%), angular (down to arcmin scale) and temporal (down to seconds) resolution [1]. Different layouts of CTA with different performance characteristics are currently under investigation to balance the financial budget vs. the science return. The different CTA layouts and their estimated performance are described in detail in a separate paper in this issue [2]. The present paper is focused on the projected performance of particular CTA layouts in respect to studying the extragalactic background light and cosmology. It is demonstrated that CTA has a large potential to provide a significant contribution to such studies making them one of the central science drivers for the instrument.
1.2 The extragalactic background light
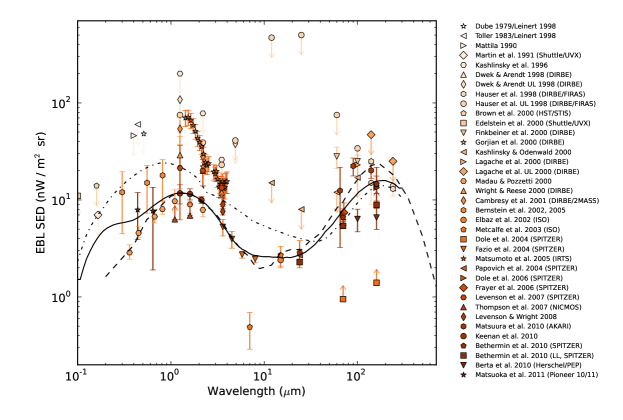
During the star and galaxy formation history diffuse extragalactic radiation in the ultraviolet (UV) to far-infrared wavelength (FIR) regimes was accumulated. This radiation field, commonly referred to as the extragalactic background light (EBL), is the second largest background after the Cosmic Microwave Background of 2.7 K (CMB) in terms of energy contained. While the CMB conserves the information on the structure of the universe at the moment of decoupling of matter and radiation following the Big Bang (at redshift z 1000), the EBL is an integral measure of the entire radiative energy released dominantly by star formation that has occurred since the decoupling. The EBL energy density from UV to FIR is expected to display a two peak structure: a first peak around m from integrated starlight and a second peak at m from infrared emission from dust, which reprocesses the direct emission in the UV to optical.
The precise level of the EBL density is not well known (see [8] for a review). It is difficult to measure directly due to strong foregrounds from our solar system and the Galaxy [9]. Lower limits on the EBL density can be derived from integrated deep galaxy counts at optical and infrared wavelengths [e.g. 10, 11, 12, 13]. The observation of distant sources of very high energy (VHE, typical GeV) -rays using Imaging Atmospheric Cherenkov Telescopes (IACT, such as H.E.S.S., MAGIC, or VERITAS) provides a unique way to derive indirect limits on the EBL density. This method will be discussed in more detail in the next section. The precision of the EBL constraints set by the IACTs improved remarkably in the last few years (e.g. [14, 6, 15]). Recently, data in the GeV energy range from the Fermi-LAT instrument provided new tools to derive constraints from VHE data (e.g. [16, 17]). Contemporaneously with the IACT constraints, there has been rapid progress in resolving a significant fraction of this background with the deep galaxy counts at infrared wavelengths from the Spitzer satellite (e.g. [11, 12, 18]) as well as at sub-millimeter wavelengths from Herschel or the Submillimeter Common User Bolometer Array (SCUBA) instrument (e.g. [19]). Furthermore, the trends of source counts at the faintest magnitudes as measured by HST and 8m-class ground-based telescopes (Keck, Subaru, VLT) indicate that the EBL contribution from standard galaxies is largely resolved [10, 20]. The current status of direct and indirect EBL measurements are summarized in an accompanying review article in this journal and can also be found in [7].
In total, the collective limits on the EBL between the UV and FIR confirm the expected two peak structure, although the absolute level of the EBL density remains uncertain by a factor of two to ten (Fig. 1). In addition to this consistent picture, several direct measurements in the near IR have also been reported (e.g. [21]), significantly exceeding the expectations from source counts (see [8] and [22] for reviews). If this claimed excess of the EBL is real (but see [23, 14]), it might be attributed to emission from more exotic sources like, e.g., the first stars in the history of the universe.
Alternative models do exist, which could, in principle, reconcile the observations with a high level of the EBL: axion like particles (ALPs), which had been introduced to address the strong-CP violation problem in particle physics, could lead to a conversion of VHE gamma-rays to ALPs. This mechanism and the related physics for CTA is discussed in a separate paper in this special issue [24]. Recently, the secondary gamma-rays produced along the line of sight by the interactions of cosmic-ray protons with background photons have been invoked to explain the VHE spectra of distant sources [25].
1.3 VHE -rays from blazars as a probe of the EBL
On the way from the source to the observer, VHE -rays can suffer absorption losses by interaction with the low energy photons of the EBL via the pair-production mechanism [26, 27]:
| (1) |
VHE -ray photon fluxes measured on earth are, therefore, altered from the flux emitted at the location of the source
| (2) |
The optical depth, , encountered by VHE -rays of energy emitted at redshift and traveling toward the observer can then be calculated by solving the three-fold integral (see e.g. [28]):
| (3) |
where , is EBL photon number density and the distance element (expressed in co-moving coordinates).
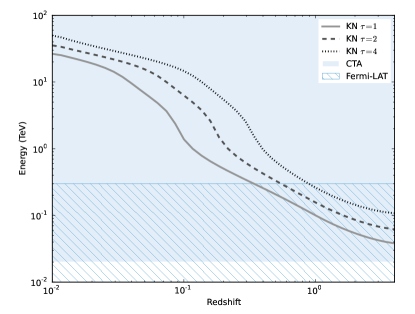
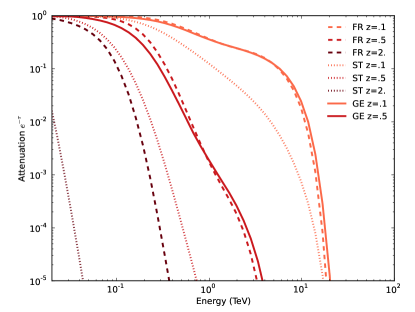
Fig. 2 displays the resulting attenuation due to the EBL for VHE -ray sources at different redshifts and for different EBL models (see Fig. 1). Several features can be identified:
-
1.
At low energies ( GeV) the spectrum is practically unattenuated (with the exception of extreme EBL models at high redshifts, i.e. the fast evolution model from Stecker et al. at ). Since this energy range will be sampled by the CTA with high statistical precision, it will be possible to measure the unabsorbed spectrum.
-
2.
At energies from 80 GeV to 2 TeV the strength of the attenuation is increasing due to the EBL photons in the optical to near-infrared range peak of the EBL density.
-
3.
At energies between 2 to 10 TeV a flattening of the attenuation is expected at low redshifts (as seen for in Fig. 2 for FR and GEN models), due to the behavior of the EBL density in the near to mid-infrared, resulting in a constant attenuation. Such a modulation of the EBL attenuation has been considered as a possible key signature for EBL attenuation [e.g. 30, 31, 32, 16]. Unfortunately, the intrinsic weakness of the sources combined with the sensitivity of the instruments makes it difficult to probe such a feature with previous or current generation experiments (but see [33]).
-
4.
At energies around 10 TeV the turnover in the EBL density towards the far-infrared peak of the EBL results in a strong attenuation, effectively resulting in a cut-off in the measured spectra.
The strength and the position of these features vary with the distance of the VHE sources, the assumed EBL model, and the overall EBL density. This can also be seen in Fig. 3, which shows the energies where the EBL gets optically thick for different redshifts (i.e. the optical depth reaches unity or higher).
It should be noted that only distant extragalactic VHE -ray emitters suffer from the absorption by the EBL. For galactic sources the attenuation effect from the EBL is negligible up to energies of about 100 TeV. For higher energies, the absorption by the photon field of the CMB starts to be important. Galactic diffuse photon fields also produce a weak attenuation signature, which might be seen with CTA [34].
The produced e+/e- pairs can initiate electromagnetic cascades by upscattering low-energy CMB photons to high energies; these latter photons would produce, yet again, e+/e- pairs by interacting with EBL photons (see, e.g., [35, 36]). The -rays resulting from the cascade would mostly appear at lower energies than the ones accessible by CTA but they would modify the overall energy spectra of the sources, which is important for their modeling. If the strength of intergalactic magnetic fields and interaction length are low enough, the cascade component would appear to arrive from the direction of the source. Higher magnetic fields would isotropize the cascade component.
Since the EBL attenuation alters the VHE -ray spectra of all distant sources, understanding the EBL’s properties are crucial for studying the intrinsic source physics. On the other hand, VHE -rays from distant sources can be used as probes for the intervening photon fields. This requires some assumptions about the intrinsic spectra, which, e.g., can be derived from nearby sources or unattenuated parts of the spectrum. In addition, EBL attenuation should be a global phenomenon affecting the spectra of all sources in a consistent way. In particular, sources at the same distance should show the same attenuation imprint from the EBL.
2 The CTA EBL & cosmology physics case
2.1 Disentangling intrinsic blazar spectra from EBL effects: precision measurement of the EBL density
There is a fundamental difficulty to distinguish between intrinsic blazar effects (e.g. intrinsic cut-offs or possible multi-zone emission regions) and the absorption effect caused by the EBL. This ambiguity is also the main reason why, with already more than 40 extragalactic sources measured by H.E.S.S., MAGIC and VERITAS, only upper limits on EBL density have been derived yet (as in, e.g., [14]). The number of sources detected at VHE will increase further in the next 5 years, in particular owing to the upgrades of the existing facilities aiming at enhanced sensitivity and lower the energy thresholds: MAGIC II, H.E.S.S. II and VERITAS II. However, the real boost in the field will be achieved with CTA only, when it will become possible to measure simultaneously and with high precision both the unattenuated (usually at energies below 100 GeV) and attenuated (at higher energies) parts of the AGN spectra. Such measurements will allow to disentangle between intrinsic features, which can vary from source to source and even for the same source depending on its flux state, and the EBL induced signature, which solely depends on the redshift of the source. Also, precise measurements at energies 10-20 GeV (the foreseen energy threshold of CTA) in combination of multiwavelength data would ease and improve the modeling accuracy of AGNs [37].
Disentangling the intrinsic AGN features and the EBL induced attenuation signature in the measured AGN spectra will unambiguously lead to a precise measurement of the EBL density at a redshift of . The precision of the measurement will depend on the richness of the AGN sample available, in particular on the number of sources at different redshifts to enable a robust modeling of the intrinsic features of the sources. The power of CTA to simultaneously measure the intrinsic and the EBL attenuated part of an energy spectrum is investigated in Section 3.2.1 utilizing the measured VHE of the blazar PKS 2155-304 as a template.
In individual sources an intrinsic break or cut-off cannot be excluded. However, with CTA it is estimated (see [38]) that over a period of 5 years conservatively 100 new AGN sources could be expected to be discovered. This gives a sizable source sample to check for global features/trends in the spectrum as a function of the expected opacity (see, e.g., [17] for a study on the current VHE AGN sample), or redshift (see, e.g., [39] for a simulated AGN sample) allowing to exclude biases due to source specific features. Combined with statistical studies of a large number of objects, precision measurements point to a unique and powerful method to probe the EBL that is difficult to achieve with present-day instruments.
Owing to the dependence of the pair-production cross section on the energy of the participating photons, distinct AGN types are crucially important in the indirect EBL measurements at different wavelengths. For measuring the EBL in UV, the sources must be distant to experience a measurable absorption in UV and they must be sufficiently bright to provide enough flux for a CTA measurement. Moreover, their intrinsic spectra must reach energies up to 300–500 GeV in order to connect from UV to the optical regime. Therefore, distant bright AGNs, mostly FSRQs (e.g. 3C 279 [15] and PKS 1222 [40]), and maybe GRBs if extending to high enough energies are the sources with the best potential to probe the EBL in UV. For measuring the EBL in optical to mid IR regimes, AGNs with hard spectra extending to few TeV are the ones providing the best results. The redshift of the sources must not be too large (z0.5) in order to avoid a total absorption of the flux at energies above 1 TeV. This is a guaranteed science case, since good candidates with hard energy spectra already exist: 1ES 0229+200 [41], RGB J0710+591 [42], 1ES 1101-232 [43]. A similar case can be made for the far IR regime. There, few close by sources (e.g. Mrk 421 [44], Mrk 501 [45], M 87 [46], IC 310 [47]) are the best ones provided they produce intrinsic spectra up to energies of at least E20 TeV.
The promising technique of the indirect EBL measurements can be combined with measurements from deep source counts at optical to IR wavelengths. Through this, the contribution to the EBL from faint unresolved sources or any exotic populations can be disentangled from relatively bright and known populations.
2.2 Star formation history and the early universe
The cosmic star formation rate density (SFRD), one of the fundamental quantities of cosmology, strongly evolves over the redshift range to with a peak expected at redshifts between 1 and 2. While the SFRD up to is reasonable well measured from different tracers, at higher redshifts the uncertainties are large. Since stellar and dust emissions are expected to be the dominant contributors to the EBL, a precise measurement of the EBL density can provide strong constraints on the SFRD [48]. The science output is guaranteed since the SFRD is a highly debated topic of the modern cosmology. It is estimated that the precision of the SFRD determination, which can be achieved using VHE spectra, will be on a level of 20–30% (based on [49]).
The end of the dark ages of the universe - the epoch of reionization - is a topic of great interest [50, 51]. Not (yet) accessible via direct observations, most of our knowledge comes from simulations and from integral observables like, e.g., the cosmic microwave background. The first (Population III) and second (Population II) generations of stars are natural candidates for the sources of reionization. If the first stars are hot and massive, as predicted by simulations [52, 53], their UV photons emitted at would be redshifted to the near-infrared regime and could leave a unique signature on the EBL density [54]. If the EBL contribution from lower redshift galaxies is sufficiently well known (e.g., as derived from source counts) upper limits on the EBL density can be used to probe the properties of early stars and galaxies [55]. Combining detailed model calculations with redshift dependent EBL density measurements could enable to probe the reionization history of our universe. Detection of spectral cutoffs in sources at very high redshifts () would directly probe the evolving UV background at these redshifts, providing invaluable insight into the cosmic reionization epoch.
While blazars may be difficult to detect much beyond , this may be feasible for GRBs. GRBs are the most luminous and distant gamma-ray sources known in the Universe, typically arising at redshifts , which correspond to the peak epoch of cosmic star formation activity. Furthermore, they are known to occur at least up to [56, 57], well into the cosmic reionization era, and possibly even beyond, out to the very first epochs of star formation in the Universe. The recent detections by Fermi/LAT of dozens of GRBs including GRB 080916C at [58] clearly demonstrate that at least some GRBs have luminous emission extending to few tens of GeV [59, 60]. Moreover, the duration of the multi-GeV emission is seen to last up to several thousand seconds, in agreement with reasonable theoretical expectations for the high-energy afterglow emission see e.g. [60]. Thanks to CTA’s much greater effective area compared to Fermi/LAT (by about a factor of at 30 GeV if using CTA array layout ) together with its rapid slewing capability (180 degrees within 20 seconds), there are good prospects for high precision measurements of the GeV-TeV spectra of GRBs at , as well as the detection of GRBs at and beyond, a regime that cannot be explored with AGNs.
2.3 Particle physics and the unknown
Data collected so far by H.E.S.S., MAGIC and VERITAS on absorption for AGNs have constrained the maximum EBL density to a level close to the lower limits from integrated galaxy counts. Once CTA goes online and significantly improves the indirect EBL measurements, several scenarios are possible. In the first scenario the joint efforts of direct and indirect measurements converge and the EBL density is resolved. If the EBL density is well measured, EBL absorption in VHE spectra can be used as a distance indicator, somewhat analogues to what is done for Supernovae of type 1A but with very different systematic uncertainties (see [49]). The evolution of such an attenuation signature with redshift would allow us to put constraints on cosmological models and measure the Hubble parameter and cosmological densities. The proposed method would provide independent and complementary constraints on the cosmological parameters with different systematic uncertainties to what projects as LSST [61] or PLANCK [62] are planning to reach. An independent distance measurement of AGNs using the EBL absorption feature in their VHE spectra is also important for getting redshifts for many BL Lacs, since only 50% of all BL Lacs have reliable redshift measurements.
In a second scenario, the EBL level determined from the VHE observations will be remain to be a factor of two to three higher than the level resolved through the galaxy counts. This would point to a large population of yet hidden sources, maybe also to a truly diffuse background such as due to decaying big-bang relict particles. In case the discrepancy between the lower and upper limits will be restricted to a narrow wavelength range, the search for the missing background photons will be easier.
In an alternative scenario, the upper limits on EBL from indirect measurements will contradict lower limits from galaxy counts. This opens up a completely new window in particle and astroparticle physics since one of the two following options must be true: either the intrinsic source physics is fundamentally different than the models predict or the properties of gamma ray propagation through space are fundamentally different than we know today, which can become a major challenge for the modern physics (see e.g. [63, 24]).
3 Investigating the CTA response
3.1 Simulations
For the studies presented here the CTA physics response simulation tools presented in [64] are used. In short, a source intrinsic spectrum is assumed in each case and then folded with a given CTA response. The source is located at the center of the telescopes’ field of view and the background (especially important at low energies) is assumed to be measured with a 5-times better statistics than the exposure of the source region. Only significant, i.e. larger than 3 standard deviations, reconstructed flux points have been considered in the analysis. Furthermore, the systematic uncertainty is considered to be 1% of the background level, and we require the signal to be at least 3 times higher than that. The performance files for 20 zenith angle (fixed) are used and no correction for source motion along the sky is made.
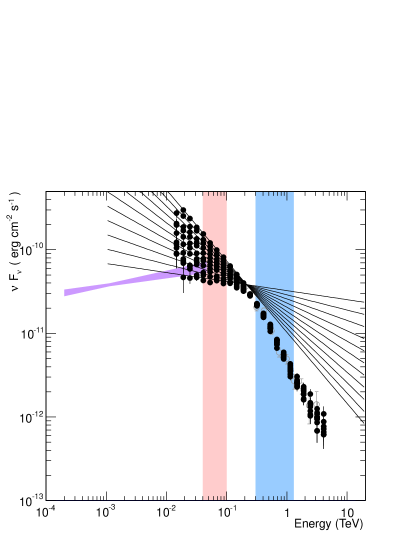
An example of such a simulated spectrum is shown in Fig. 5, where the measured spectrum of the blazar PKS 2155-304 is used together with different assumptions about the EBL density (here a scaled version of the EBL model by [5]) to calculate the spectrum as it would have been detected by CTA in a 20 h exposure (CTA array layout: B) (more details can be found in [66]).
3.2 Results
3.2.1 Disentangling intrinsic blazar spectra and EBL effects.
One of the main features of CTA will be a high sensitivity in the energy range between 20 and 100 GeV, an energy range which holds the possibility to directly sample parts of the energy spectrum of a source, which are not affected by the EBL attenuation. With the difference between the measured spectrum in the unabsorbed part of the VHE spectrum and in the absorbed part of the spectrum, especially if studied for several sources with good statistics, the strength of the near-IR EBL can be derived. Here, exemplarily, the case of PKS 2155-304 is studied following the approach described in [66].
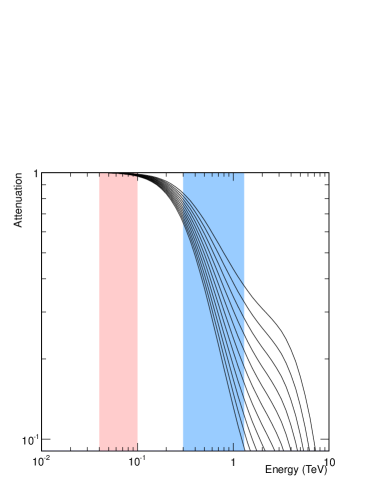
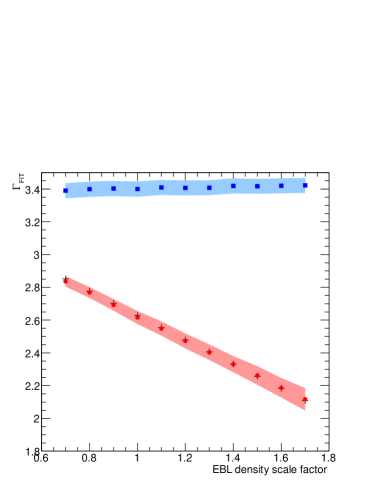
For different levels of the EBL density, generated by scaling the EBL model from [5], the intrinsic source spectrum is reconstructed and used to simulate the corresponding spectrum as measured by CTA (Fig. 5). The resulting attenuations for the scaled EBL models are shown in Fig. 4 left panel. In the CTA simulated spectrum two distinct regions in energy can be identified: (i) the unabsorbed region, roughly from 40 to 100 GeV for the redshift of PKS 2155-304 of (red band), where no or little EBL attenuation is present and the intrinsic spectrum can be observed directly, and the (ii) absorbed region at energies GeV, where the EBL attenuation can be measured (blue band). In each of the two bands the spectrum is characterized by a power law and the derived photon indices , shown in Fig. 4 right panel, are then investigated. The fit in the low energy band reproduces very well the assumed intrinsic spectral indices (red dots vs black crosses in Fig. 4 right panel).
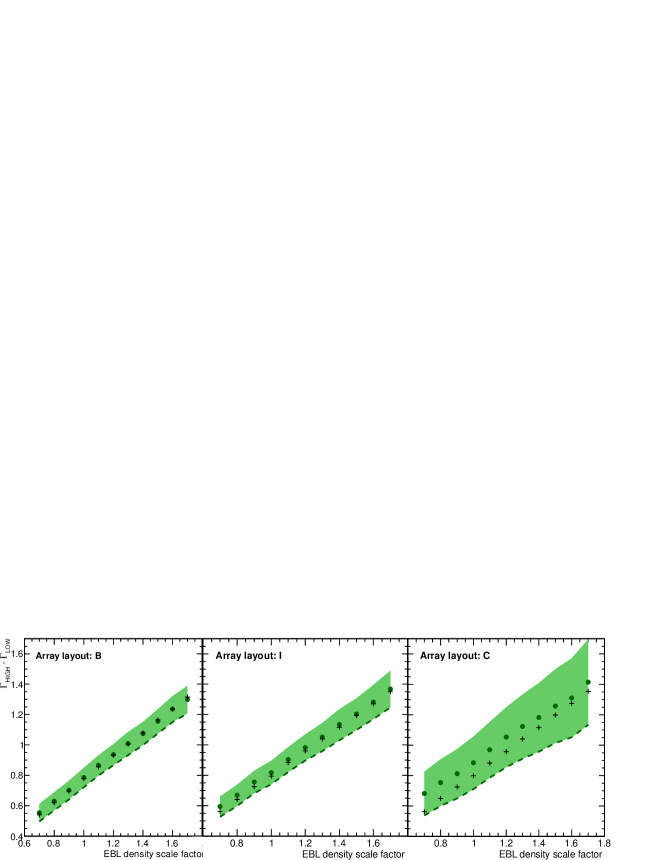
Fig. 6 displays the strength of the spectral break between the two power laws for different CTA array layouts, with the error bands calculated via error propagation. For array layout (best low energy performance) an EBL density a step in scale factor of 0.1 corresponds to one to two standard deviations difference in the strength of the break. Array layout I provides a comparable but slightly worse performance while the decreased low energy sensitivity of array layout makes studies of this type difficult (resolution factor two to three worse and the intrinsic index cannot be reconstructed). Note that a scaling of 0.1 corresponds to an EBL density of 1 nW m-2sr-1 at 2 m which is of the same order as the error on the lower limits from integrated source counts at this wavelength. Since EBL attenuation is a global, redshift dependent phenomenon, in general, a combined fit to all available VHE data should be used to derive limits on the EBL density [see e.g. 6].
While for many of the up to now detected extragalactic VHE sources the energy spectrum in the VHE range is well described by the extrapolation of the spectrum in the HE range folded with an EBL attenuation some of the sources show an intrinsic break between the two energy regimes (e.g. PKS 2155-304) [67]. For individual sources, such an intrinsic break could lead to a wrongly determined EBL density when blindly applying the methods outlined above. The solution, again, lies in utilizing a sample of source: while intrinsic features are different between the sources the EBL attenuation signature can be precisely determined for each of them enabling one to disentangle the two.
3.2.2 Distant sources, GRBs
Due to the low energy threshold of CTA and its high sensitivity CTA will have the opportunity to detect even distant GRBs. Whereas a discussion on GRB physics is beyond the scope of this article, GRBs start playing a crucial role in understanding EBL density at high redshifts [68]. A common expectation is that only GRBs will provide high enough -ray luminosity to detect a source located at high redshifts (). Also AGN in extreme flaring states could be detected at (see Figure 6 in AGN paper, same issue). As mentioned before, -ray sources beyond a redshift of two can be used as beacons probing the star formation rate density and, in particular, its peak position.
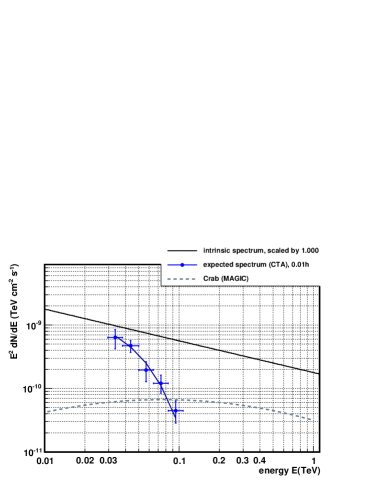
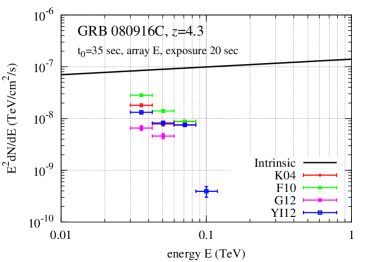
The power of CTA to detect distant GRBs can be demonstrated by utilizing the Fermi-LAT detection of the extraordinary GRB 080916C, which took place at a redshift of [58]. In Fig. 7 we compare simulated spectra as they were measured by CTA of the GRB. In the left panel, we assume the instrinsic spectrum as it was measured by Fermi-LAT for the time-span s (45 s, interval ”e” as defined in [58]). The result is that a clear detection can be made, here on an example of CTA array layout (see [2] for details on individual array configurations. For this array layout, it would also have been possible to derive a detailed spectrum. Comparing performance of different array layouts for this physics case, we see only marginal improvement using the array layout (low threshold) instead of or (balanced arrays): the resulting error bars are only few percent better and the reconstructed energy range is identical. However, for the array layout (high threshold), no detection of this GRB can be achieved and, consequently, no spectrum can be derived. Since GRBs are short lived events, a high repositioning speed of CTA is required. In the right panel of Fig. 7 we see a simulation of the GRB080916C spectrum for the interval ”d” [58])555 The assumed source flux is , whereas the index -1.85 is derived from a fit to the LAT-only data (Figure S4 in the Supplement to [58] and private communication from the Fermi-LAT team).. The intrinsic spectrum is harder and the flux level is higher than for the interval ”e”, which results in clear detection even for an integration time of 20s. Results for four different EBL models Kneiske et al. “best fit” [69] (red), Finke et al. [70] (green), Gilmore et al. [71] (magenta), and Inoue et al. (private communication, blue) are presented, which show clear difference and permits distinguishing between the models. We note that catching a GRB at a time s after the onset of the GRB, which would correspond to the interval ”d” in case of GRB080916C, is challenging even if CTA would be able to reposition to any pace in the sky within 20 s. It is, however, withing the reach of the instrument. Observations at , corresponding to the interval ”e” in case of GRB080916C, are easier to achieve and can be considered as a secured case. It is important to mention that GRB080916C was the brightest GRB observed by the Fermi/LAT so far. The probability that GRBs with sufficiently high flux will be observed by CTA within its life time has been addressed by several authors [72, 73] finding that CTA, if having a low energy threshold of 20–30GeV would be able to detect 0.1–0.2 GRBs per year during the prompt phase and about 1 per year in the afterglow phase.
As discussed by a number of authors [59, 60, 75], UV radiation with sufficient intensities to cause the reionization of the intergalactic medium (IGM) are also likely to induce appreciable gamma-ray absorption in sources at at observed energies in the multi-GeV range, with a potentially important contribution from Pop III stars. Measurements of these effects can thus provide important cross-checks of current models of cosmic reionization, a unique and invaluable probe of the evolving UV EBL during the era of early star formation, as well as a test for the existence of the yet hypothetical Pop III stars. For more details we refer to the GRB paper in this issue.
3.2.3 Precision measurement of today’s EBL
The measured energy spectra of AGNs in the energy range between 100 GeV and few TeV follow usually a smooth shape. For most of the measured sources, a simple power law fit is sufficient to describe the available data well, whereas for sources in a flare state (like the flare of PKS 2155-304 in 2006) or with a generally high emission state (like Mkn 421), either a curved power law or a power law with a cut-off are successfully used. The curved power law (also known in the literature as the double-log parabola) is expected to describe the spectra well at energies close to the position of the Inverse-Compton peak. The power law with a cut-off instead is the expected behavior of a source which does not provide necessary conditions for acceleration of charged particles to sufficiently high energies. All scenarios, assuming the one-zone model, which seems adequate to describe most VHE spectra of AGNs rather well, do have one common feature: the measured spectra can be described by smooth functions, i.e., no features, wiggles or pile-ups are expected, especially after de-convolving the spectra for the effect of the EBL absorption. This property can, therefore, be used to distinguish between different overall EBL levels in the optical to infrared regime: whereas the ”correct” EBL model and level will produce a smooth intrinsic AGN spectrum, an ”incorrect” EBL level would result in a signature (in form of well defined wiggles) in the reconstructed intrinsic spectrum [23, 66]. Possible spectral features in the intrinsic spectra could complicate the analysis, though other methods like investigating the spectral properties of variable sources on short time-scales or using multiwavelength based modeling might help to disentangle source intrinsic and EBL effects (see Sec 2.1). It is also important to observe the same effect on spectra of different sources to become independent of possible intrinsic source features. Another caveat is that the form of the wiggles will have some dependency on the exact spectral shape of the ”correct” EBL model, which is not known a-priori. Though the state-of-the-art EBL models agree within 10% on the expected EBL shape (with the only exception being the model of [3]), a possibility of a significantly different shape, e.g., due to a contribution from early stars, cannot be excluded.
The strength of the method is that the EBL signatures in the reconstructed AGN spectra will not only be visible (measurable) in the case where the assumed EBL level is higher than the real one, but also in case the assumed EBL level is lower than the real one. It is, therefore, the first indirect method to really measure the EBL density at z=0.
Simulation example
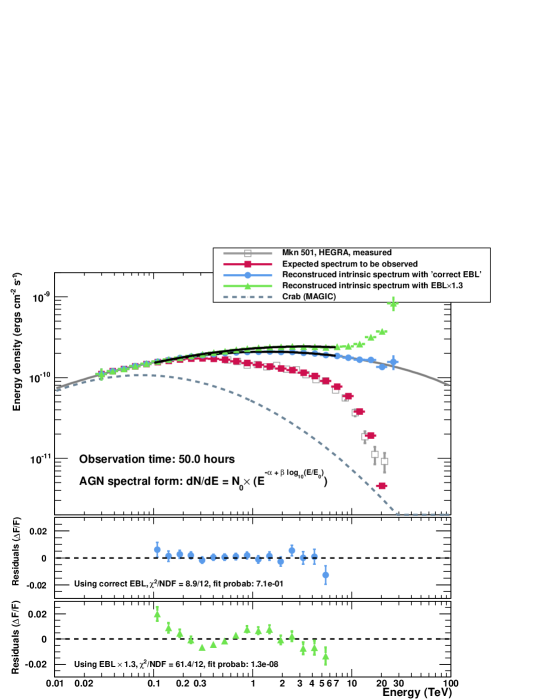
The method is illustrated in Fig. 8 for the VHE spectrum of Mkn 501. The assumed spectral shape and the flux level of the intrinsic spectrum are adapted to the average flux measured by HEGRA [76] during the outburst of the source in 1997 (110 h observation time): the original data are shown by grey open squares in the upper panel of the figure. The simulated CTA spectrum calculated using the ’correct EBL’ (model from [4]) is shown in red, whereas the assumed intrinsic spectrum of Mkn 501 is shown by the solid grey line and the reconstructed intrinsic spectrum is shown by the blue filled circles. The effect of the mis-reconstruction of the intrinsic spectrum is shown for the example of an EBL scaled by a factor of 1.3: the reconstructed intrinsic spectrum (green filled triangles) clearly shows wiggles in the fit range. The effect of the wiggles is more visible in the lower panel of the figure where the residuals to the best fit function are shown. The wiggles are quantified by a fit in the energy range between 100 GeV and 7 TeV, well before a possible pile-up in the spectrum arises, which can be additionally used to rule out an EBL realization [28, 6]. The choice of the fit range is made in order not to bias the result by the level of the EBL above 10 m, to which the VHE spectra are very sensitive due to a super exponential dependency of the attenuation with the wavelength in that range. Using the correct EBL level to reconstruct the intrinsic spectrum, the intrinsic spectrum is well described by a smooth function (Fig. 8, middle panel). Instead, when using a ”wrong” scaled EBL density characteristic deviations (wiggles) from a smooth function are visible (Fig. 8, lower panel). The wiggles are quantified by a reduced value of 61.4/12, corresponding to a fit probability of . The small fit probability for the assumed scaled EBL level implies (under used assumptions) significant presence of the unphysical wiggles and, therefore, the exclusion of that particular EBL realization.
Results of the analysis
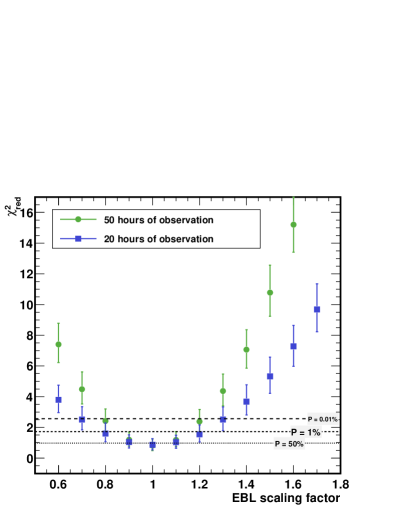
This procedure is repeated 1000 times for every scaled EBL density in order to achieve a solid statistical mean and a (68%) coverage of the reduced values. The results are shown in Fig. 9 for two different CTA exposures (20 and 50 hours) plotting the mean reduced values including 68% error bars versus the EBL scaling factor. As a result one can see a parabola-like curve with the minimum at EBL scaling factor of 1.0, which is via construction the correct EBL model. The expected mean reduced values are shown by the blue filled squares and the green filled circles for the exposures of 20 hr and 50 hr, respectively. The corresponding fit probabilities of P=50%, 1% and 0.01% are shown by the dotted, short-dashed and long-dashed lines, respectively. An EBL scaling is considered to be excluded when the mean reduced value including its 68% error exceeds the value for P=0.01%. For the case constructed here this means that in case of 50 hours observation, the EBL scalings below 0.70 and above 1.30 are excluded. In the case of 20 hours observation, the EBL scalings factors above 1.40 and below 0.6 are excluded.
When comparing performance of different CTA array layouts for this particular study, no significant differences between the results was found for the array layouts , , and . The reason for low discrepancies is that the study mainly relies on the energy resolution of the array in the range 200 GeV up to few TeV and per construction this is the regime where all CTA arrays have similar performances.
4 Conclusions, recommendations, & caveats
CTA will be a superb machine for probing the EBL. Key features are the high sensitivity, providing a large and rich sample of sources for EBL studies, and the huge energy coverage, enabling to simultaneously measure the EBL attenuation and the un-attenuated intrinsic spectrum. CTA will deliver definite answers to some of the most pressing topics in this field, including a precise measurement of the EBL density and it evolution up to redshifts of one and beyond, providing new insights into structure formation and galaxy evolution. In addition, it will open up the field of EBL studies towards more fundamental physics, allowing to probe for effects of fundamental particles like hidden photons or axions (see [24]), and give constraints on cosmology.
The currently proposed layouts come in three different flavors: (1) emphasis on low energy sensitivity and lower threshold with worse high energy performance (array layout ), and (2) increased high energy performance with worse acceptance at low energies (array layout ), and (3) overall balanced sensitivity with emphasis on the core energy range between 100 GeV and 10 TeV (e.g. array layout or ). Each of the setups have their advantages for certain topics of the EBL studies: arrays of type (1) are thought to be better suited for studies of UV radiation and early universe using GRBs and distant AGNs where the most observational emphasis is put on energies below 100 GeV; array layouts of type (2) provide the opportunity to study in great detail the mid and far IR with sources like M 87 and 1ES 0229+200 where VHE gamma ray emission extends in energy up to 10s of TeV; and while array layouts of type (3) seem to deliver the best compromise of the previous two types.
Several CTA array layouts have been investigated in detail for their performance for different EBL and cosmology physics cases. The results are:
-
1.
For low energy studies of steady objects (i.e. implying long exposure), array of type is superior in its performance thanks to its large collection area and good background rejection at energies below 100 GeV. Due to their decreased sensitivity at lower energies, the capability of sampling the un-attenuated part of the spectrum with array layouts and is slightly worse (see Sec.3.2.1). Array layout shows significant disadvantages for these type of studies.
-
2.
For low energy studies of rapid transient phenomena like GRBs, no significant difference between the performance of arrays and could be found. Due to the short exposure, the background rejection does not play an important role, equalizing the performance of the two types of arrays (see Sec. 3.2.2). Instead, an array of type (3) (e.g. ) with a significantly higher energy threshold does not allow for a detection of the phenomena and is, therefore, unsuited for such studies.
-
3.
For the precision measurements of the EBL density as discussed in Sec. 3.2.3, all tested arrays show very similar performance. The EBL can be resolved down to 20-30% thanks to the superb spectral resolution of the planned CTA. However, in order to be sensitive to the differences between the state-of-the-art EBL models, an energy resolution of 5-10% in the energy range between 100 GeV and few TeV is required.
Acknowledgement
The authors thank the CTA consortium members for fruitful discussions and the referees for insightful comments and suggestions.
References
References
- [1] M. Actis, G. Agnetta, F. Aharonian, A. Akhperjanian, J. Aleksić, et al., Design concepts for the Cherenkov Telescope Array CTA: an advanced facility for ground-based high-energy gamma-ray astronomy, Experimental Astronomy 32 (2011) 193–316. arXiv:1008.3703, doi:10.1007/s10686-011-9247-0.
- [2] K. Bernlöhr, A. Barnacka, Y. Becherini, et al., Monte Carlo design studies for the Cherenkov Telescope Array, Astroparticle PhysicsTo be submitted.
- [3] F. W. Stecker, M. A. Malkan, S. T. Scully, Intergalactic Photon Spectra from the Far-IR to the UV Lyman Limit for 0 z 6 and the Optical Depth of the Universe to High-Energy Gamma Rays, The Astrophysical Journal 648 (2006) 774–783. arXiv:astro-ph/0510449, doi:10.1086/506188.
- [4] M. Raue, D. Mazin, Optical depth for VHE -rays from distant sources from a generic EBL density, International Journal of Modern Physics D 17 (2008) 1515–1520. arXiv:0802.0129, doi:10.1142/S0218271808013091.
- [5] A. Franceschini, G. Rodighiero, M. Vaccari, Extragalactic optical-infrared background radiation, its time evolution and the cosmic photon-photon opacity, Astronomy & Astrophysics 487 (2008) 837–852. arXiv:0805.1841, doi:10.1051/0004-6361:200809691.
- [6] D. Mazin, M. Raue, New limits on the density of the extragalactic background light in the optical to the far infrared from the spectra of all known TeV blazars, Astronomy & Astrophysics 471 (2007) 439–452. arXiv:arXiv:astro-ph/0701694, doi:10.1051/0004-6361:20077158.
- [7] M. Raue, D. Mazin, EBL studies with ground-based VHE gamma-ray detectors: Current status and potential of next-generation instruments, in: Il Nuovo Cimento C 34 03, 2011. arXiv:1106.4384.
- [8] M. G. Hauser, E. Dwek, The cosmic infrared backround: Measurements and implications, Annual Review of Astronomy and Astrophysics 39 (2001) 249.
- [9] M. G. Hauser, R. G. Arendt, T. Kelsall, E. Dwek, N. Odegard, et al., The cobe diffuse infrared background experiment search for the cosmic infrared background. i. limits and detections, The Astrophysical Journal 508 (1998) 25.
- [10] P. Madau, L. Pozzetti, Deep galaxy counts, extragalactic background light and the stellar baryon budget, MNRAS 312 (2000) L9.
- [11] G. G. Fazio, M. L. N. Ashby, P. Barmby, et al., Number Counts at 3 m 10 m from the Spitzer Space Telescope, Astrophysical Journal, Supplement 154 (2004) 39–43. arXiv:astro-ph/0405595, doi:10.1086/422585.
- [12] D. T. Frayer, M. T. Huynh, R. Chary, et al., Spitzer 70 Micron Source Counts in GOODS-North, The Astrophysical Journal, Letters 647 (2006) L9–L12. arXiv:astro-ph/0606676, doi:10.1086/507149.
- [13] H. Dole, G. Lagache, J.-L. Puget, K. I. Caputi, N. Fernández-Conde, E. Le Floc’h, C. Papovich, P. G. Pérez-González, G. H. Rieke, M. Blaylock, The cosmic infrared background resolved by Spitzer. Contributions of mid-infrared galaxies to the far-infrared background, Astronomy & Astrophysics 451 (2006) 417–429. arXiv:astro-ph/0603208, doi:10.1051/0004-6361:20054446.
- [14] F. Aharonian, A. G. Akhperjanian, A. R. Bazer-Bachi, et al., A low level of extragalactic background light as revealed by -rays from blazars, Nature 440 (2006) 1018–1021. doi:10.1038/nature04680.
- [15] J. Albert, E. Aliu, H. Anderhub, L. A. Antonelli, P. Antoranz, et al., Very-High-Energy gamma rays from a Distant Quasar: How Transparent Is the Universe?, Science 320 (2008) 1752. arXiv:0807.2822, doi:10.1126/science.1157087.
- [16] M. R. Orr, F. Krennrich, E. Dwek, Strong New Constraints on the Extragalactic Background Light in the Near- to Mid-infrared, The Astrophysical Journal 733 (2011) 77. arXiv:1101.3498, doi:10.1088/0004-637X/733/2/77.
- [17] M. Meyer, M. Raue, D. Mazin, D. Horns, Limits on the extragalactic background light in the Fermi era, accepted for publications in Astronomy & Astrophysics 542 (2012) A59. arXiv:1202.2867.
- [18] M. Béthermin, H. Dole, A. Beelen, H. Aussel, Spitzer deep and wide legacy mid- and far-infrared number counts and lower limits of cosmic infrared background, Astronomy & Astrophysics 512 (2010) A78. arXiv:1001.0896, doi:10.1051/0004-6361/200913279.
- [19] S. Berta, B. Magnelli, D. Lutz, B. Altieri, H. Aussel, et al., Dissecting the cosmic infra-red background with Herschel/PEP, Astronomy & Astrophysics 518 (2010) L30. arXiv:1005.1073, doi:10.1051/0004-6361/201014610.
- [20] T. Totani, Y. Yoshii, F. Iwamuro, T. Maihara, K. Motohara, Diffuse Extragalactic Background Light versus Deep Galaxy Counts in the Subaru Deep Field: Missing Light in the Universe?, The Astrophysical Journal, Letters 550 (2001) L137–L141. arXiv:0102328, doi:10.1086/319646.
- [21] T. Matsumoto, S. Matsuura, H. Murakami, M. Tanaka, M. Freund, M. Lim, M. Cohen, M. Kawada, M. Noda, Infrared Telescope in Space Observations of the Near-Infrared Extragalactic Background Light, The Astrophysical Journal 626 (2005) 31–43. arXiv:astro-ph/0411593, doi:10.1086/429383.
- [22] A. Kashlinsky, Cosmic infrared background and early galaxy evolution [review article], Phys. Rep. 409 (2005) 361–438. arXiv:astro-ph/0412235, doi:10.1016/j.physrep.2004.12.005.
- [23] E. Dwek, F. Krennrich, R. G. Arendt, Is There an Imprint of Primordial Stars in the TeV -Ray Spectrum of Blazars?, The Astrophysical Journal 634 (2005) 155–160. arXiv:astro-ph/0508133, doi:10.1086/462400.
- [24] J. Barrio, E. Birsin, J. Bolmont, et al., Dark Matter and Fundamental Physics with the Cherenkov Telescope Array, Astroparticle Physics, 2011, this issue.
- [25] W. Essey, O. Kalashev, A. Kusenko, J. F. Beacom, Role of Line-of-sight Cosmic-ray Interactions in Forming the Spectra of Distant Blazars in TeV Gamma Rays and High-energy Neutrinos, The Astrophysical Journal 731 (2011) 51. arXiv:1011.6340, doi:10.1088/0004-637X/731/1/51.
- [26] A. I. Nikishov, Sov. Phys. JETP 14 (1962) 393.
- [27] R. J. Gould, G. P. Schréder, Opacity of the Universe to High-Energy Photons, Physical Review 155 (1967) 1408–1411. doi:10.1103/PhysRev.155.1408.
- [28] E. Dwek, F. Krennrich, Simultaneous Constraints on the Spectrum of the Extragalactic Background Light and the Intrinsic TeV Spectra of Markarian 421, Markarian 501, and H1426+428, The Astrophysical Journal 618 (2005) 657–674. arXiv:astro-ph/0406565, doi:10.1086/426010.
- [29] T. M. Kneiske, H. Dole, A lower-limit flux for the extragalactic background light, Astronomy & Astrophysics 515 (2010) A19. arXiv:1001.2132, doi:10.1051/0004-6361/200912000.
- [30] J. Guy, C. Renault, F. A. Aharonian, M. Rivoal, J.-P. Tavernet, Constraints on the cosmic infra-red background based on BeppoSAX and CAT spectra of Markarian 501, Astronomy & Astrophysics 359 (2000) 419.
- [31] F. A. Aharonian, A. G. Akhperjanian, J. A. Barrio, et al., TeV gamma rays from the blazar H 1426+428 and the diffuse extragalactic background radiation, Astronomy & Astrophysics 384 (2002) L23.
- [32] L. Costamante, F. Aharonian, G. Ghisellini, D. Horns, The SED of the TeV BLLac 1ES 1426+428 after correction for the TeV-IR absorption, New Astronomy Review 47 (2003) 677–680. arXiv:astro-ph/0301211, doi:10.1016/S1387-6473(03)00121-0.
- [33] M. R. Orr, F. Krennrich, in: Proc. of the 32nd ICRC, Beijing, Vol. 8, 2011, p. 161.
- [34] I. V. Moskalenko, T. A. Porter, A. W. Strong, Attenuation of Very High Energy Gamma Rays by the Milky Way Interstellar Radiation Field, The Astrophysical Journal, Letters 640 (2006) L155–L158. arXiv:arXiv:astro-ph/0511149, doi:10.1086/503524.
- [35] F. A. Aharonian, P. S. Coppi, H. J. Voelk, Very high energy gamma rays from active galactic nuclei: Cascading on the cosmic background radiation fields and the formation of pair halos, The Astrophysical Journal, Letters 423 (1994) L5–L8. arXiv:arXiv:astro-ph/9312045, doi:10.1086/187222.
- [36] A. Neronov, D. V. Semikoz, Sensitivity of -ray telescopes for detection of magnetic fields in the intergalactic medium, Phys. Rev. D80 (12) (2009) 123012. arXiv:0910.1920, doi:10.1103/PhysRevD.80.123012.
- [37] N. Mankuzhiyil, M. Persic, F. Tavecchio, High-frequency-peaked BL Lacertae Objects as Spectral Candles to Measure the Extragalactic Background Light in the Fermi and Air Cherenkov Telescopes Era, The Astrophysical Journal, Letters 715 (2010) L16–L20. arXiv:1004.2032, doi:10.1088/2041-8205/715/1/L16.
- [38] Y. Inoue, T. Totani, M. Mori, Prospects for a Very High-Energy Blazar Survey by the Next-Generation Cherenkov Telescopes, PASJ62 (2010) 1005. arXiv:1002.4782.
- [39] B. Behera, S. J. Wagner, Spectral trends in the Very High Energy blazar sample due to EBL absorption, in: F. A. Aharonian, W. Hofmann, & F. Rieger (Ed.), American Institute of Physics Conference Series, Vol. 1085 of American Institute of Physics Conference Series, 2008, pp. 526–529. doi:10.1063/1.3076725.
- [40] J. Aleksić, L. A. Antonelli, P. Antoranz, M. Backes, J. A. Barrio, et al., MAGIC Discovery of Very High Energy Emission from the FSRQ PKS 1222+21, The Astrophysical Journal, Letters 730 (2011) L8+. arXiv:1101.4645, doi:10.1088/2041-8205/730/1/L8.
- [41] F. Aharonian, A. G. Akhperjanian, U. Barres de Almeida, et al., New constraints on the mid-IR EBL from the HESS discovery of VHE -rays from 1ES 0229+200, Astronomy & Astrophysics 475 (2007) L9–L13. arXiv:arXiv:0709.4584, doi:10.1051/0004-6361:20078462.
- [42] V. A. Acciari, E. Aliu, T. Arlen, T. Aune, M. Bautista, et al., The Discovery of -Ray Emission from the Blazar RGB J0710+591, The Astrophysical Journal, Letters 715 (2010) L49–L55. arXiv:1005.0041, doi:10.1088/2041-8205/715/1/L49.
- [43] F. Aharonian, A. G. Akhperjanian, A. R. Bazer-Bachi, et al., Detection of VHE gamma-ray emission from the distant blazar 1ES 1101-232 with HESS and broadband characterisation, Astronomy & Astrophysics 470 (2007) 475–489. doi:10.1051/0004-6361:20077057.
- [44] M. Błażejowski, G. Blaylock, I. H. Bond, S. M. Bradbury, J. H. Buckley, D. A. Carter-Lewis, O. Celik, P. Cogan, W. Cui, M. Daniel, C. Duke, A. Falcone, D. J. Fegan, S. J. Fegan, J. P. Finley, L. Fortson, S. Gammell, K. Gibbs, G. G. Gillanders, J. Grube, K. Gutierrez, J. Hall, D. Hanna, J. Holder, D. Horan, B. Humensky, G. Kenny, M. Kertzman, D. Kieda, J. Kildea, J. Knapp, K. Kosack, H. Krawczynski, F. Krennrich, M. Lang, S. LeBohec, E. Linton, J. Lloyd-Evans, G. Maier, D. Mendoza, A. Milovanovic, P. Moriarty, T. N. Nagai, R. A. Ong, B. Power-Mooney, J. Quinn, M. Quinn, K. Ragan, P. T. Reynolds, P. Rebillot, H. J. Rose, M. Schroedter, G. H. Sembroski, S. P. Swordy, A. Syson, L. Valcarel, V. V. Vassiliev, S. P. Wakely, G. Walker, T. C. Weekes, R. White, J. Zweerink, B. Mochejska, B. Smith, M. Aller, H. Aller, H. Teräsranta, P. Boltwood, A. Sadun, K. Stanek, E. Adams, J. Foster, J. Hartman, K. Lai, M. Böttcher, A. Reimer, I. Jung, A Multiwavelength View of the TeV Blazar Markarian 421: Correlated Variability, Flaring, and Spectral Evolution, The Astrophysical Journal 630 (2005) 130–141. arXiv:arXiv:astro-ph/0505325, doi:10.1086/431925.
- [45] F. A. Aharonian, A. G. Akhperjanian, J. A. Barrio, et al., Measurement of the flux, spectrum, and variability of tev -rays from mkn 501 during a state of high activity, Astronomy & Astrophysics 327 (1997) L5.
- [46] F. Aharonian, A. G. Akhperjanian, A. R. Bazer-Bachi, et al., Fast Variability of Tera-Electron Volt gamma-rays from the Radio Galaxy M87, Science 314 (2006) 1424. arXiv:astro-ph/0612016.
- [47] J. Aleksić, L. A. Antonelli, P. Antoranz, M. Backes, J. A. Barrio, et al., Detection of Very High Energy -ray Emission from the Perseus Cluster Head-Tail Galaxy IC 310 by the MAGIC Telescopes, The Astrophysical Journal, Letters 723 (2010) L207–L212. arXiv:1009.2155, doi:10.1088/2041-8205/723/2/L207.
- [48] M. Raue, M. Meyer, Probing the peak of the star formation rate density with the extragalactic background light, ArXiv e-printsAccepted for publication in MNRAS, arXiv:1203.0310. arXiv:1203.0310.
- [49] O. Blanch, M. Martinez, Exploring the gamma ray horizon with the next generation of gamma ray telescopes. Part 1: Theoretical predictions, Astroparticle Physics 23 (2005) 588–597. arXiv:astro-ph/0107582, doi:10.1016/j.astropartphys.2005.03.008.
- [50] R. Barkana, A. Loeb, In the beginning: the first sources of light and the reionization of the universe, Phys. Rep. 349 (2001) 125–238. arXiv:astro-ph/0010468.
- [51] B. Ciardi, A. Ferrara, The First Cosmic Structures and Their Effects, Space Science Reviews 116 (2005) 625–705. arXiv:astro-ph/0409018, doi:10.1007/s11214-005-3592-0.
- [52] V. Bromm, R. B. Larson, The First Stars, ARA&A 42 (2004) 79–118. arXiv:astro-ph/0311019.
- [53] S. Glover, The Formation Of The First Stars In The Universe, Space Science Reviews 117 (2005) 445–508. arXiv:astro-ph/0409737, doi:10.1007/s11214-005-5821-y.
- [54] M. Santos, V. Bromm, M. Kamionkowski, The contribution of the first stars to the cosmic infrared background, MNRAS 336 (2002) 1082.
- [55] M. Raue, T. Kneiske, D. Mazin, First stars and the extragalactic background light: how recent -ray observations constrain the early universe, Astronomy & Astrophysics 498 (2009) 25–35. arXiv:0806.2574, doi:10.1051/0004-6361/200810396.
- [56] N. R. Tanvir, D. B. Fox, A. J. Levan, E. Berger, K. Wiersema, et al., A -ray burst at a redshift of z~8.2, Nature 461 (2009) 1254–1257. arXiv:0906.1577, doi:10.1038/nature08459.
- [57] R. Salvaterra, M. Della Valle, S. Campana, G. Chincarini, S. Covino, et al., GRB090423 at a redshift of z~8.1, Nature 461 (2009) 1258–1260. arXiv:0906.1578, doi:10.1038/nature08445.
- [58] A. A. Abdo, M. Ackermann, M. Arimoto, K. Asano, W. B. Atwood, et al., Fermi Observations of High-Energy Gamma-Ray Emission from GRB 080916C, Science 323 (2009) 1688. doi:10.1126/science.1169101.
- [59] S. P. Oh, Probing High-Redshift Radiation Fields with Gamma-Ray Absorption, The Astrophysical Journal 553 (2001) 25–32. arXiv:astro-ph/0005263, doi:10.1086/320641.
- [60] S. Inoue, R. Salvaterra, T. R. Choudhury, A. Ferrara, B. Ciardi, R. Schneider, Probing intergalactic radiation fields during cosmic reionization through gamma-ray absorption, MNRAS 404 (2010) 1938–1943. arXiv:0906.2495, doi:10.1111/j.1365-2966.2010.16414.x.
- [61] Z. Ivezic, J. A. Tyson, E. Acosta, R. Allsman, S. F. Anderson, et al., LSST: from Science Drivers to Reference Design and Anticipated Data Products, ArXiv e-printsarXiv:0805.2366.
- [62] Planck Collaboration, P. A. R. Ade, N. Aghanim, M. Arnaud, M. Ashdown, J. Aumont, et al., Astronomy & Astrophysics 536 (2011) A1. arXiv:1101.2022, doi:10.1051/0004-6361/201116464.
- [63] A. de Angelis, M. Roncadelli, O. Mansutti, Evidence for a new light spin-zero boson from cosmological gamma-ray propagation?, Phys. Rev. D76 (12) (2007) 121301. arXiv:0707.4312, doi:10.1103/PhysRevD.76.121301.
- [64] J. Hinton, et al., Monte-Carlo studies for the Cherenkov Telescope Array, Astroparticle Physics, 2011, this issue.
- [65] A. A. Abdo, M. Ackermann, M. Ajello, W. B. Atwood, M. Axelsson, et al., Bright Active Galactic Nuclei Source List from the First Three Months of the Fermi Large Area Telescope All-Sky Survey, The Astrophysical Journal 700 (2009) 597–622. arXiv:0902.1559, doi:10.1088/0004-637X/700/1/597.
- [66] M. Raue, D. Mazin, Potential of the next generation VHE instruments to probe the EBL (I): The low- and mid-VHE, Astroparticle Physics 34 (2010) 245–256. arXiv:1005.1196, doi:10.1016/j.astropartphys.2010.08.005.
- [67] A. A. Abdo, M. Ackermann, M. Ajello, W. B. Atwood, M. Axelsson, et al., Fermi Observations of TeV-Selected Active Galactic Nuclei, The Astrophysical Journal 707 (2009) 1310–1333. arXiv:0910.4881, doi:10.1088/0004-637X/707/2/1310.
- [68] A. A. Abdo, for the Fermi-LAT Collaboration, Fermi-LAT Constraints on the Gamma-ray Opacity of the Universe, ArXiv e-printsAstro-ph/1005.0996. arXiv:1005.0996.
- [69] T. M. Kneiske, T. Bretz, K. Mannheim, D. H. Hartmann, Implications of cosmological gamma-ray absorption. II. Modification of gamma-ray spectra, Astronomy & Astrophysics 413 (2004) 807–815. arXiv:astro-ph/0309141, doi:10.1051/0004-6361:20031542.
- [70] J. D. Finke, S. Razzaque, C. D. Dermer, Modeling the Extragalactic Background Light from Stars and Dust, The Astrophysical Journal 712 (2010) 238–249. arXiv:0905.1115, doi:10.1088/0004-637X/712/1/238.
- [71] R. C. Gilmore, R. S. Somerville, J. R. Primack, A. Domínguez, Semi-analytic modelling of the extragalactic background light and consequences for extragalactic gamma-ray spectra, MNRAS 422 (2012) 3189–3207. arXiv:1104.0671, doi:10.1111/j.1365-2966.2012.20841.x.
- [72] J. Kakuwa, K. Murase, K. Toma, S. Inoue, R. Yamazaki, K. Ioka, Prospects for Detecting Gamma-Ray Bursts at Very High Energies with the Cherenkov Telescope Array, ArXiv e-printsarXiv:1112.5940.
- [73] R. C. Gilmore, A. Bouvier, V. Connaughton, A. Goldstein, N. Otte, J. R. Primack, D. A. Williams, IACT observations of gamma-ray bursts: prospects for the Cherenkov Telescope Array, ArXiv e-printsarXiv:1201.0010.
- [74] A. Domínguez, J. R. Primack, D. J. Rosario, F. Prada, R. C. Gilmore, S. M. Faber, D. C. Koo, R. S. Somerville, M. A. Pérez-Torres, P. Pérez-González, J.-S. Huang, M. Davis, P. Guhathakurta, P. Barmby, C. J. Conselice, M. Lozano, J. A. Newman, M. C. Cooper, Extragalactic background light inferred from AEGIS galaxy-SED-type fractions, MNRAS 410 (2011) 2556–2578. arXiv:1007.1459, doi:10.1111/j.1365-2966.2010.17631.x.
- [75] Y. Inoue, M. A. R. Kobayashi, R. Makiy, S. Inoue, T. Totani, Y. Niino, 2011, in preparation.
- [76] F. A. Aharonian, A. G. Akhperjanian, J. A. Barrio, et al., The time averaged TeV energy spectrum of MKN 501 of the extraordinary 1997 outburst as measured with the stereoscopic Cherenkov telescope system of HEGRA, Astronomy & Astrophysics 349 (1999) 11.