A Terradynamics of Legged Locomotion on Granular Media
The theories of aero- and hydrodynamics predict animal movement and device design in air and water through the computation of lift, drag, and thrust forces. Although models of terrestrial legged locomotion have focused on interactions with solid ground, many animals move on substrates that flow in response to intrusion. However, locomotor-ground interaction models on such flowable ground are often unavailable. We developed a force model for arbitrarily-shaped legs and bodies moving freely in granular media, and used this “terradynamics” to predict a small legged robot’s locomotion on granular media using various leg shapes and stride frequencies. Our study reveals a complex but generic dependence of stresses in granular media on intruder depth, orientation, and movement direction and gives insight into the effects of leg morphology and kinematics on movement.
The locomotion of animals (1) and devices (2–4) emerges from the effective interaction of bodies and/or appendages with an environment. For flying in air and swimming in water, there is a history of theoretical predictive models (3–5) to describe the complex interactions between the locomotor and the surrounding fluids, based on the fundamental equations for fluid flow, the Navier-Stokes equations. These models have not only allowed understanding of the movement of a variety of aerial and aquatic organisms (5) [such as bacteria and spermatazoa (6), insects (7), birds (8), and fish and whales (9)] and their functional morphology, evolution, and ecology (9, 10), but also advanced the engineering design of aircraft (3), marine vehicles (4), and flying (11) and swimming (12) robots. For running and walking on ground, studies using solid ground such as running tracks and treadmills have inspired general models (13, 14); building on these models, researchers have begun to apply dynamical systems theory (15). In these studies, the leg-ground interaction was often approximated as a point contact on a rigid, flat, and nonslip ground (13–15).
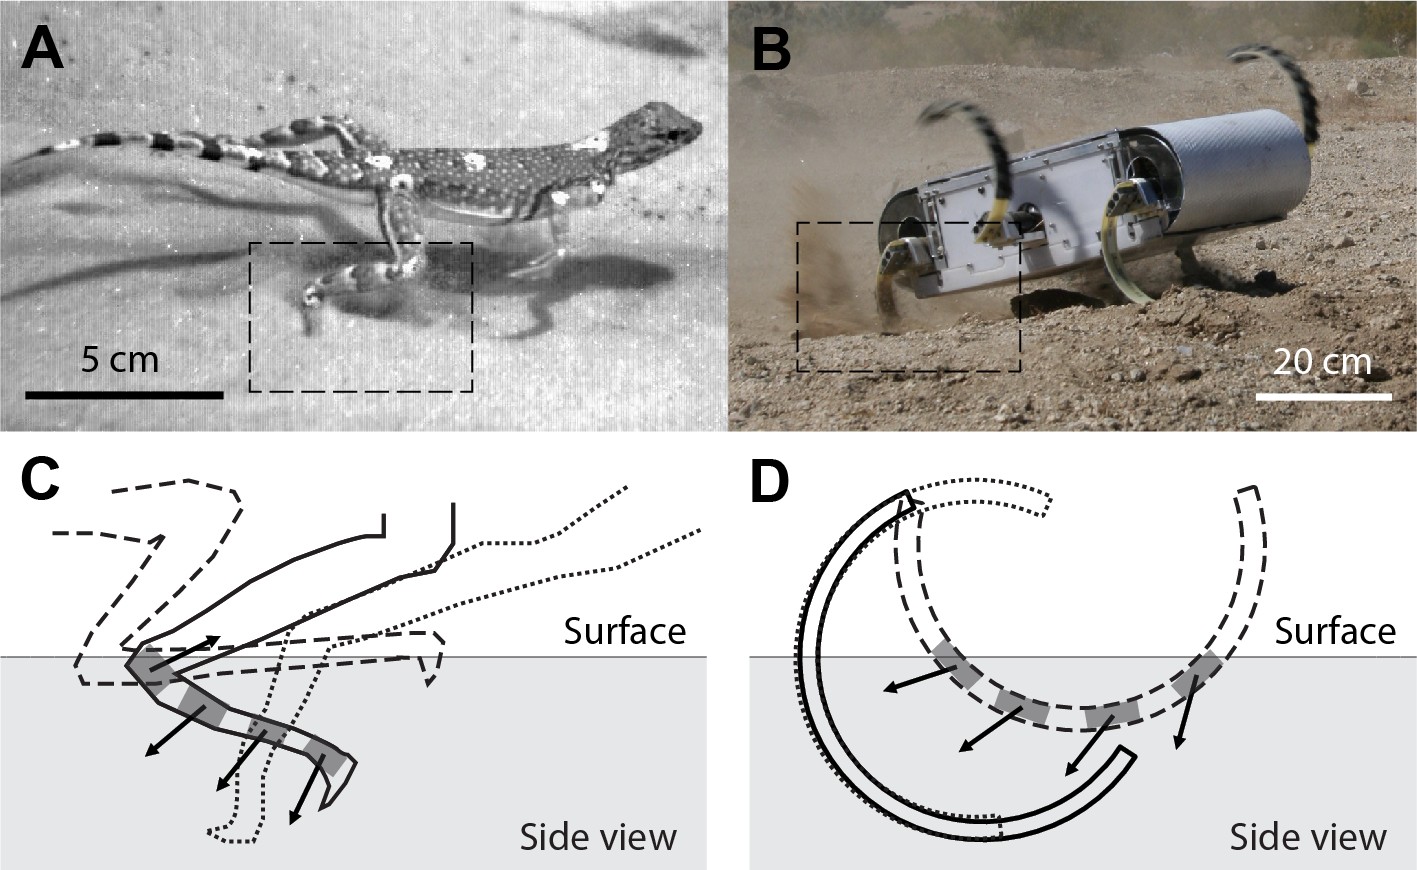
Many small legged animals (16–19) [and increasingly robots (20–23)] face the challenges of moving on natural substrates such as sand (16, 17, 21), gravel (16, 20), rubble (20), soil (20, 22),mud (17, 20), snow (18, 20), grass (20, 22), and leaf litter (19, 20, 22), which, unlike solid ground, can flow during movement when a yield stress is exceeded. The complexity of the interactions with such flowable ground may rival or even exceed that during movement in fluids. For example, recent studies of legged animals (16) and robots (21) moving on granular media [collections of particles (24)] such as sand and gravel (Fig. 1, A and B) have demonstrated that at an instant of time during a step, each element of a leg moves through the substrate at a specific depth, orientation, and movement direction, all of which can change over time (16, 21). Furthermore, the leg interacts with a material that can display both solid-like and fluid-like features (24) (Fig. 1, C and D). Compared to the theories of aero- and hydrodynamics, predictive models are less well developed for calculating forces and predicting legged locomotion on such flowable ground (16, 21). Research in the field of terramechanics (2) has advanced the mobility of off-road vehicles on flowable ground such as sand and soil. These models were developed for large wheeled and tracked vehicles, which sink only slightly into the substrate (2, 25). Thus, in terramechanical models, interaction with the ground is approximated as the indentation of a horizontal, flat, rectangular plate (2, 25). It was a breakdown of this flat-plate approximation, however, that led to overpredicted speeds for small vehicles such as the Mars rovers, whose small wheels have substantially curved ground contact interfaces (25). Because leg-ground interaction on flowable substrates is a more diverse, complex, and dynamic process (16, 21) than the flat-plate indentation, terramechanics is not expected to apply to legged locomotors on flowable ground (2).
Granular materials such as sand and gravel (24), home to a variety of small desert animals (16, 17, 26), have proved to be a promising model substrate for studying legged locomotion on flowable ground (16, 21). Despite their diversity in particle size, shape, density, friction, polydispersity, and compaction (24), dry granular media are relatively simple as compared to media such as soil and mud, because granular particles interact purely through dissipative, repulsive contact forces and have no cohesion (24). In addition, the penetration resistance of granular media can be repeatably controlled using laboratory apparatus such as an air-fluidized bed (16, 21, 26).
To begin to create a “terradynamics” that allows the prediction of legged locomotion on a flowable ground, we hypothesized that the net forces on a leg (or a body) moving in a granular medium in the vertical plane could be approximated by the linear superposition of resistive forces on infinitesimal leg (or body) elements. Our hypothesis was inspired by our recent success in applying the methods of resistive force theory (6) to predict the forces and movement during the limbless locomotion of a lizard swimming in sand (26) and in describing the drag (26, 27) and lift (27) on simple objects moving in granular media at fixed depths. In these studies, the linear superposition was valid for intruders moving in granular media in the horizontal plane at low enough speeds [for example, m/s for 0.3-mm glass particles (26)], where intrusion forces are dominated by particle friction (insensitive to speed) and non-inertial (26). However, it was unclear whether linear superposition could apply to legs (or bodies) of complex morphology and kinematics moving in the vertical plane.
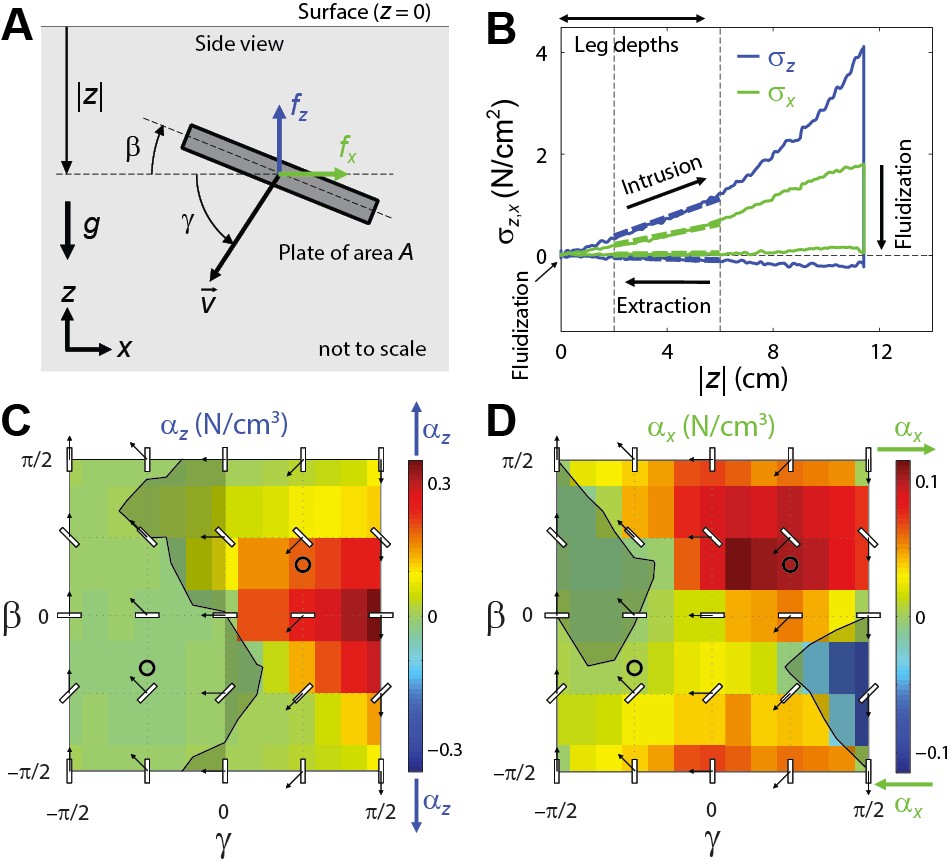
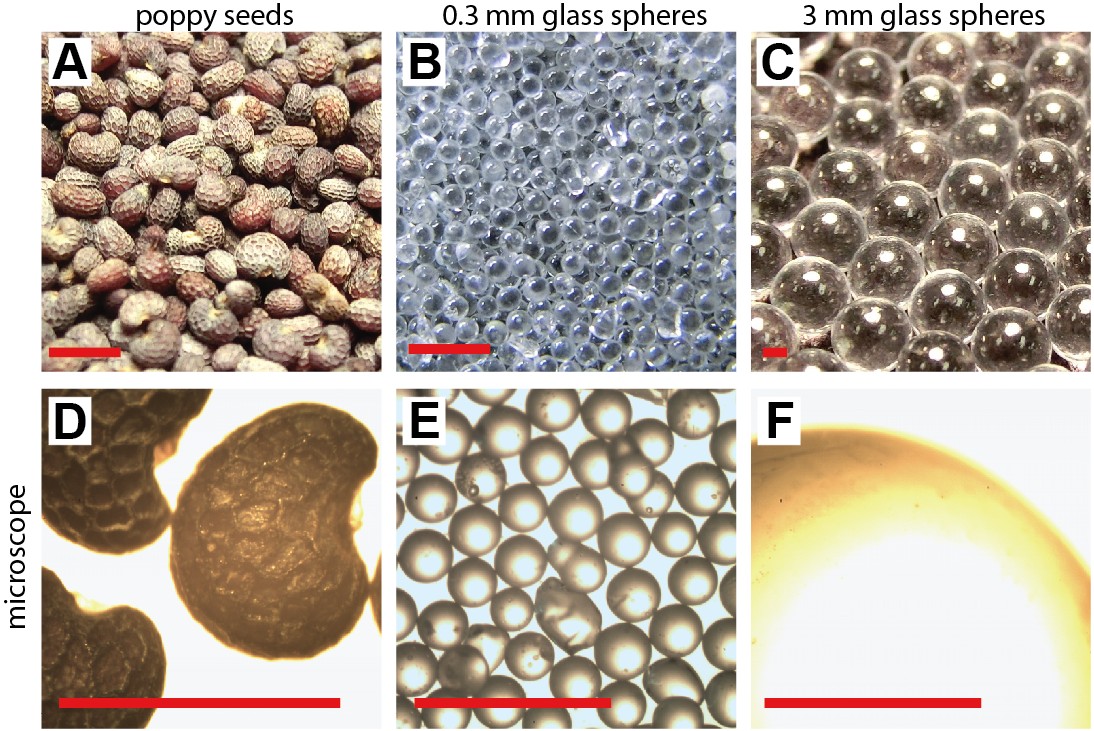
To measure resistive forces for leg elements, we moved a thin rigid plate (of area A) in granular media in the vertical plane at 1 cm/s and measured lift and drag on the plate (in the continuously yielding regime). We determined vertical and horizontal stresses as a function of the plate’s depth below the surface, angle of attack , and angle of intrusion (Fig. 2A and movie S1) (28). To test the generality of our resistive force model, we used three dry granular media of various particle size, shape, density, and friction, prepared into flat, naturally occurring, loosely and closely packed states (16, 21, 26) (supplementary text section 2, fig. S3, and table S1). Slightly polydispersed near-spherical glass particles 0.3 and 3 mm in diameter [covering the particle size range of natural dry sand (0.1 to 1 mm) (29)] and rounded, slightly kidney-shaped poppy seeds (0.7 mm in diameter) allowed us to probe general principles for naturally occurring granular media of high sphericity and roundness [such as Ottawa sand (30)]. We discuss at the end of the paper possible effects of particle nonsphericity and angularity also found in many natural sands (30).
In all media tested, we observed that for all attack angles and intrusion angles , were nearly proportional to depth when the plate was fully submerged and far from the bottom of the container (Fig. 2B and movie S1). This is because friction-dominated forces are proportional to the hydrostatic-like pressure in granular media. Therefore, we modeled the hydrostatic-like stresses as
| (1) |
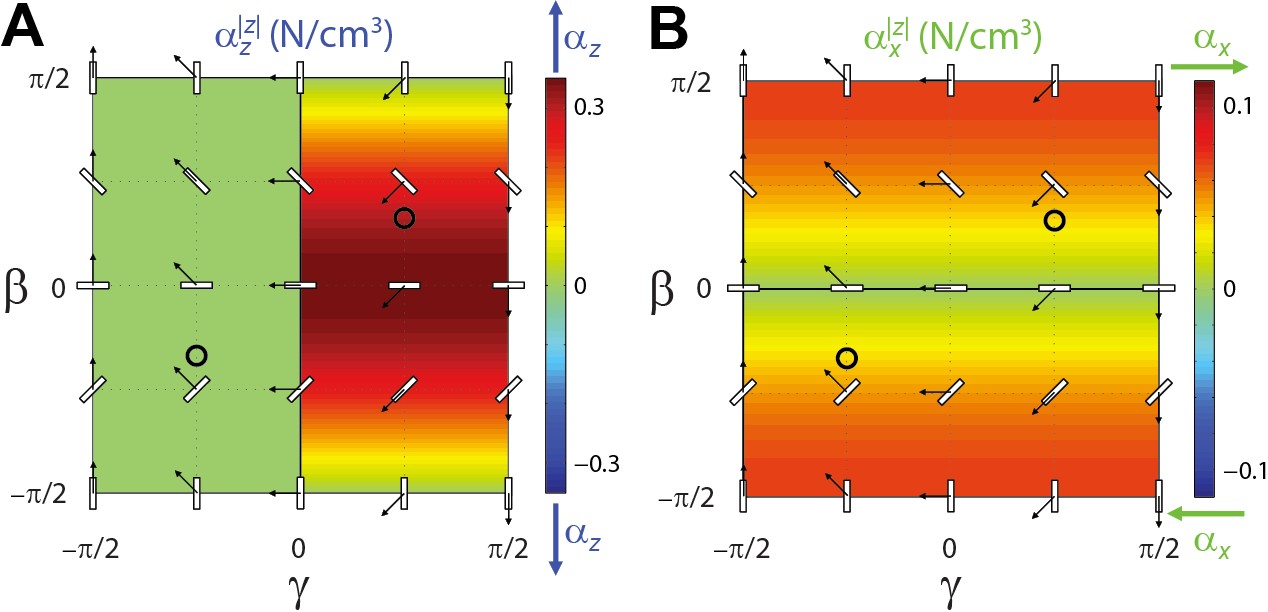
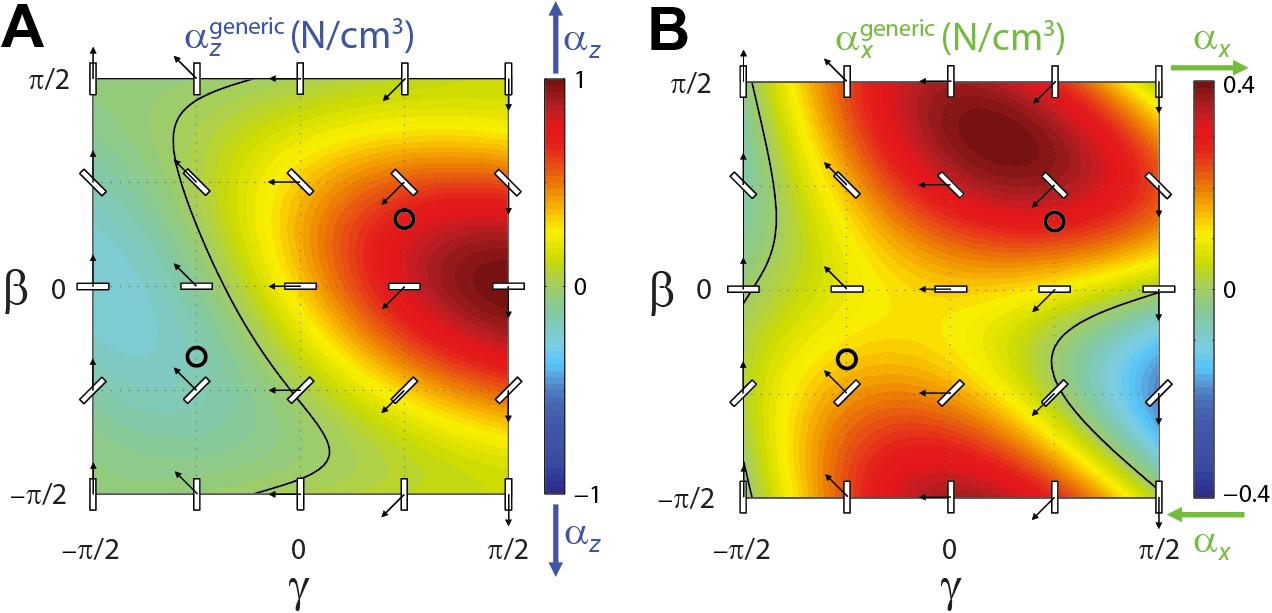
where are vertical and horizontal stresses per unit depth (slopes of dashed fit lines in Fig. 2B). We found that in all media tested, depended sensitively on both attack angle and intrusion angle (Fig. 2, C and D, fig. S4, and additional data table S5). (or ) was opposing the plate’s vertical (or horizontal) velocity for most but, counterintuitively, not all and (exceptions are indicated by the shaded regions). For almost all attack angles , had larger magnitudes () for intrusion angle than for ; i.e., it was harder to push the plate into granular media than to extract it. For all intrusion angles except , were asymmetric to attack angles and ; i.e., only when the plate moved vertically were stress magnitudes the same for vertically or horizontally mirrored orientations (e.g., ). These asymmetries are a result of gravity breaking symmetry in the vertical plane and differ from the case in the horizontal plane (26). Our resistive force measurements are an advance from previous force models based on the flat-plate approximation used in many terramechanical models (2, 25), which capture only the dependence of stresses on intruder depth, but not on its orientation or movement direction (supplementary text section 1 and fig. S1). Despite their different magnitudes and subtle differences in shape, the overall profiles of stresses (per unit depth) were similar for all media tested. Furthermore, these stress profiles could be approximated (to the first order) by a simple scaling of generic stress profiles (supplementary text section 3, figs. S6 and S7, and tables S2 and S3).
We next tested our hypothesis that forces on a complex intruder moving in granular media in the vertical plane could be approximated by the linear superposition of forces on all intruder elements. We measured the net lift and thrust on thin rigid model legs rotating about a fixed axle [simulating a tethered body (7, 11)] through granular media in the vertical plane at 1 cm/s (Fig. 3 and movie S2) (28). We then compared them to predictions from the resistive force model by the integration of stresses over the legs (movie S3)
| (2) |
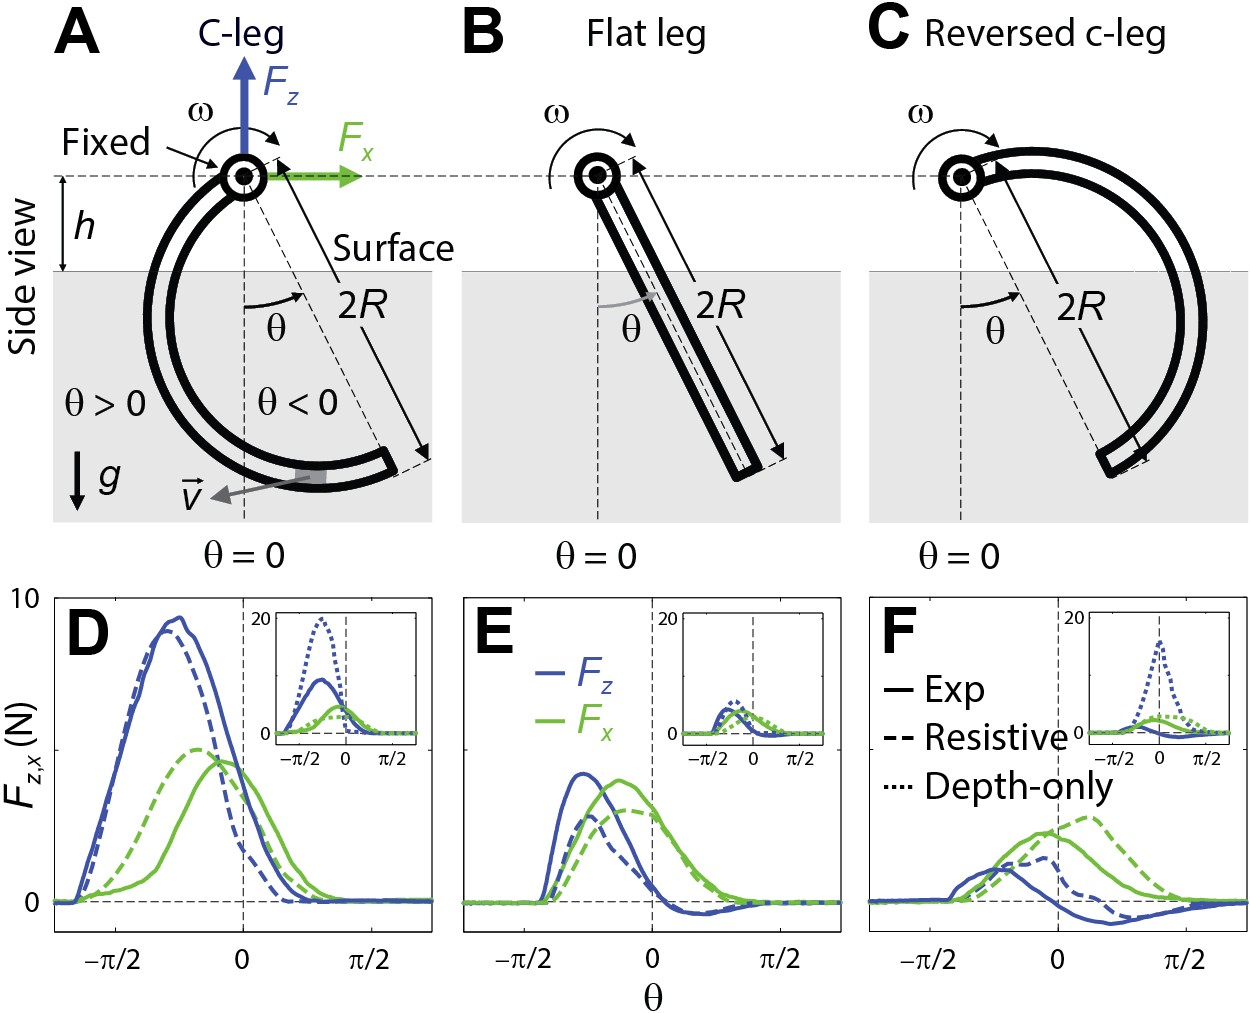
where is the leading surface of the leg; , , , and are the area, depth below the surface, angle of attack, and angle of intrusion of infinitesimal leg elements; and are element stresses per unit depth (interpolated from data in Fig. 2, C and D). To test the robustness of our force model, we used three model legs of different geometries [with the same maximal leg length (28)]: a RHex robot’s c-leg (21, 22), a flat leg, and a reversed c-leg (Fig. 3, A to C). In model calculations, each leg was divided into 30 elements.
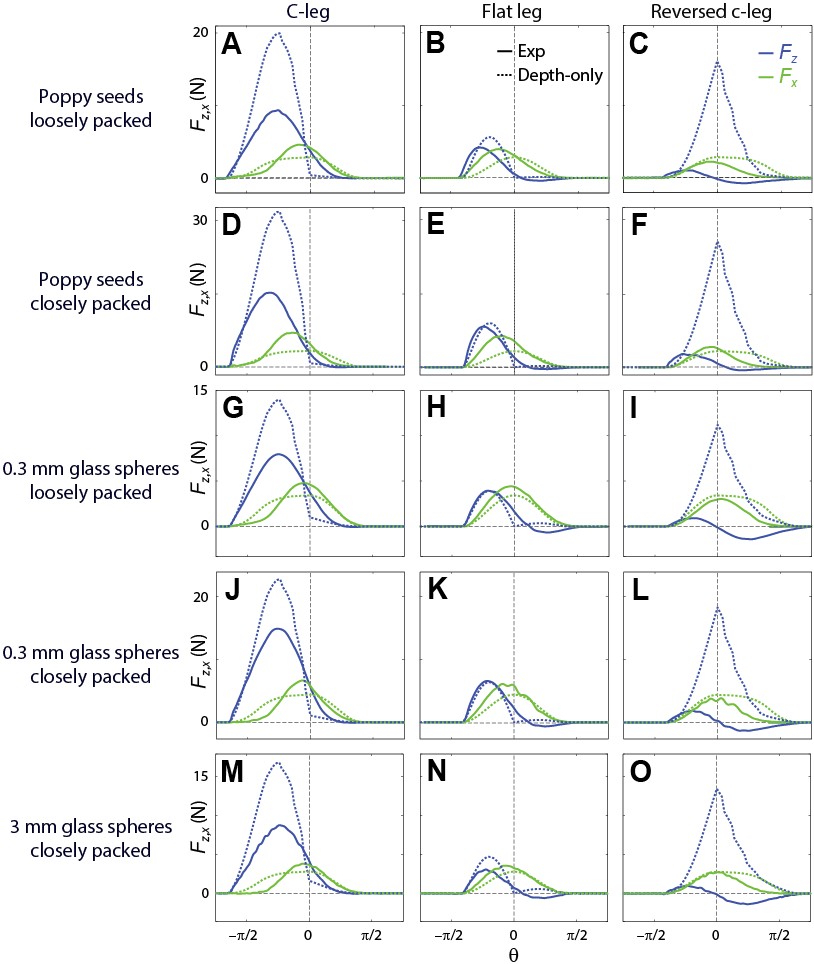
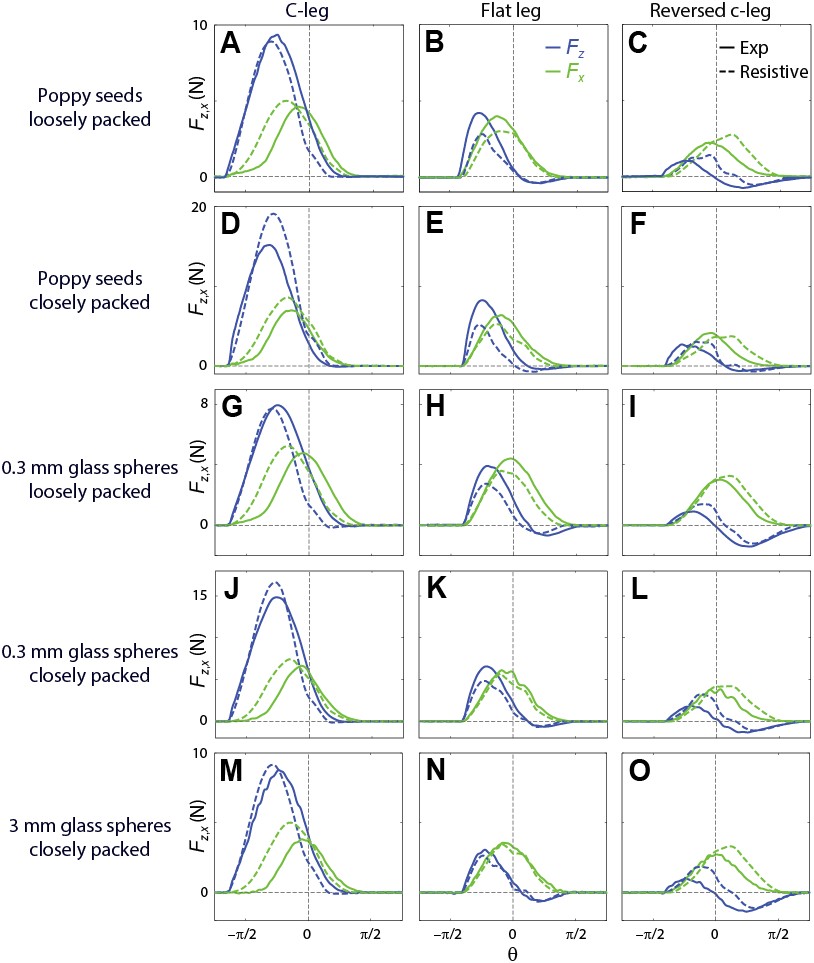
In all media tested (Fig. 3,D to F, and fig. S5), we observed that for all three legs, the measured net lift and thrust as a function of leg angle (solid curves) were asymmetric to the vertical downward direction (), and were larger during intrusion () than during extraction (). Peak were largest on the c-leg and smallest on the reversed c-leg. The reversed c-leg experienced significant negative lift (suction force, ) during extraction. For all media tested, our resistive force model predicted versus for all three legs (dashed curves), capturing both the magnitudes and asymmetric profiles. The relative errors of peak forces between data and model predictions were within 10% for the c-leg in four media tested, and within 33% for all three legs in all media tested. The accuracy of our resistive force model was significantly better than that of previous force models in which stresses depended only on depth (Fig. 3, D to F, insets; supplementary text section 1 and fig. S2). Furthermore, our resistive force model revealed that the c-leg generated the largest forces, because its morphology allowed leg elements to not only reach deeper depths but also access larger stress regions in Fig. 2, C and D (particularly for elements at large depths).
Our discovery of the insensitivity of the stress profiles to particle properties (fig. S4) has practical benefits: For granular media of near-monodispersed, near-spherical, rounded particles, as an alternative to measuring for all attack angles and intrusion angles in the laboratory, one can simply perform a single measurement [of , using a horizontal plate penetrating vertically downward] to infer all by a scaling routine (supplementary text section 3 and fig. S9) and predict forces (with a small loss in accuracy for the c-leg and the flat leg, but a larger loss in accuracy for the reversed c-leg, fig. S8).
We tested the ability of our resistive force model to predict legged locomotion. We chose to study the locomotor performance (speed) of a small RHex-like robot (22) (Fig. 4A, top, and movie S4) moving on granular media (28). The robot’s six legs rotated nearly entirely in the vertical plane during locomotion, and its small size ensured that leg intrusion speeds were low enough for particle inertia to be negligible. We chose poppy seeds as the test granular medium, because the grains were both small enough be prepared in our fluidized bed track (21) and large enough to not jam the robot’s motor and gear trains. The robot’s legs had a similar friction coefficient with poppy seeds to that of the model legs and were sufficiently rigid so that they experienced negligible bending during movement (28).
Unlike the sand-swimming lizard, which moves within granular media quasistatically (thrust and drag are always roughly balanced) (26), legged locomotion on the surface of granular media is dynamic (forces are not always instantaneously balanced). As a result, the resistive force theory (which solves for speed by balancing forces) (6, 26) cannot be directly applied. Thus, to use our resistive force model to calculate robot speed, we developed a three-dimensional multibody dynamic simulation of the robot (Fig. 4A, bottom) (28). The simulated robot had the same body and leg morphology and used the same alternating tripod gait as the actual robot and had its motion constrained in the vertical plane. We divided each body plate and leg into 30 elements. The velocity and angular velocity of the simulated robot’s body were calculated by
| (3) |
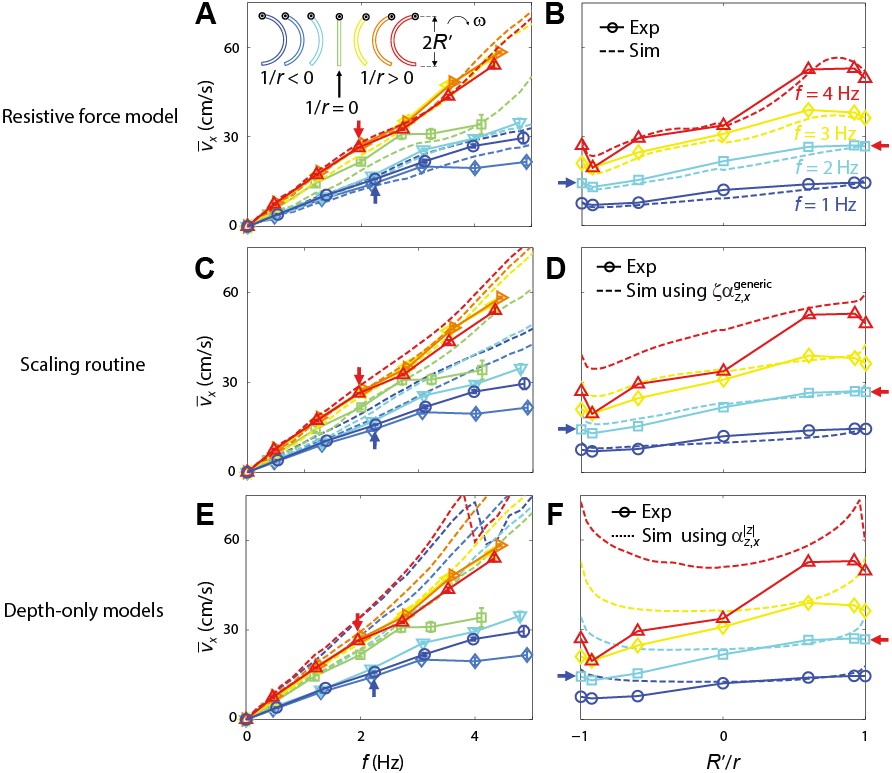
where and are the sum of net forces and torques on all the six legs and the body exerted by the granular medium, calculated from our resistive force model by the integration of stresses over each leg and the body using Eq. 2; and are the robot’s mass and moment of inertia; and and are time and time step. To test the robustness of our resistive force model and simulation, we used legs of seven geometries with different curvatures (given maximal leg length ) (Fig. 4C, inset) and varied stride frequency to up to 5 Hz (28).
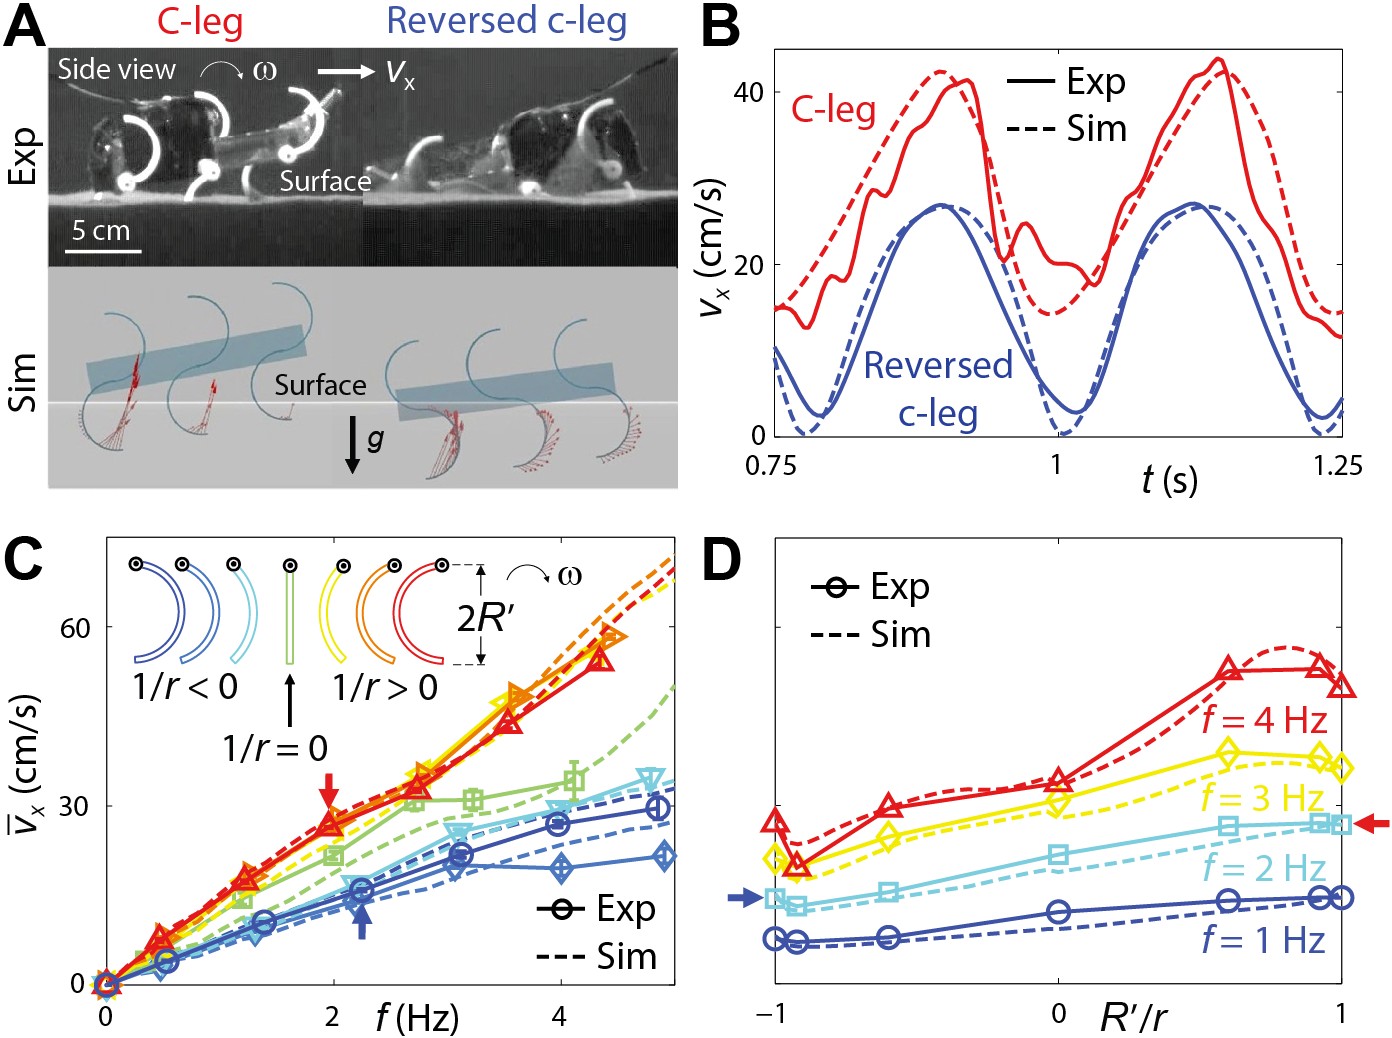
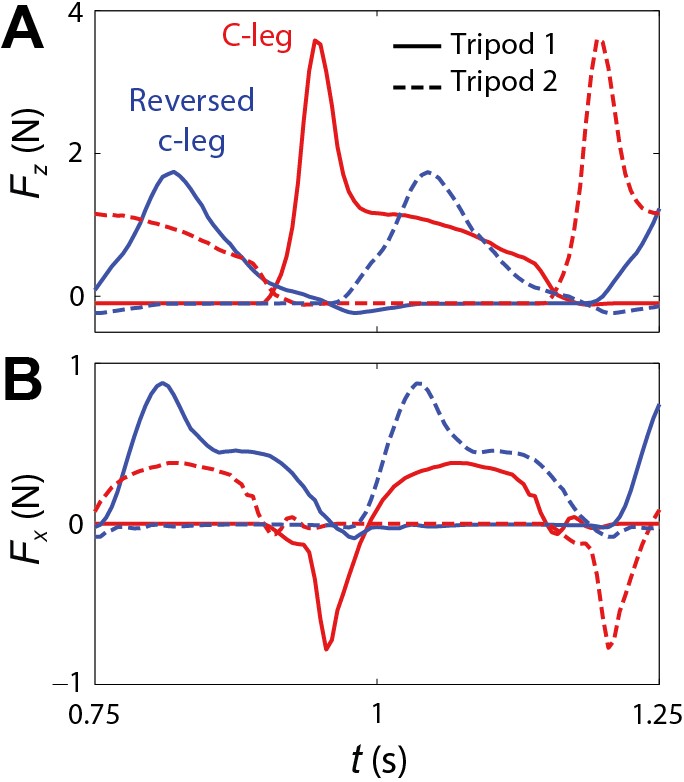
We observed similar robot kinematics (Fig. 4A) and forward speed versus time (Fig. 4B) in both the experiment (movie S5) and simulation (movie S6). The robot moved faster and penetrated its legs less deeply during stance using c-legs (Fig. 4A, left; Fig. 4B, red) than using reversed c-legs (Fig. 4A, right; Fig. 4B, blue). Average forward speed increased with stride frequency for legs of all curvatures and was lower at any using legs of negative curvatures than using legs of positive curvatures (Fig. 4, C and D). The agreement between experiment and simulation in was remarkable: Errors were within 20% for 90% of the and tested and within 35% for all the and tested. Simulation using our scaling routine also achieved reasonable accuracy (supplementary text section 5 and fig. S13). This was an improvement over simulation using previous force models in which stresses depended only on depth (fig. S13). Our resistive force model and simulation revealed that the robot moved faster using c-legs than using reversed c-legs, because whereas the c-legs penetrated less deeply, their elements accessed larger stress regions in Fig. 2, C and D, resulting in larger leg lift (fig. S14) and smaller body drag. Our model and simulation also allowed the prediction of ground reaction forces on granular media(Fig. 4A, red arrows, and fig. S13), which would be difficult to measure otherwise. Furthermore, our model and simulation predicted that using arc-like legs (given maximal leg length ) of an optimal curvature of , the robot would achieve maximal speed of cm/s ( body length/s) at Hz. Our approach affords significant reduction in the computational time needed to model movement on granular media. For example, relative to our multiparticle discrete element method (DEM) simulation of movement on granular media (23, 27), our simulation using the resistive force model can achieve a factor of in speed-up (e.g., 10 s versus 30 days using DEM to simulate 1 s of locomotion on a granular bed of poppy seeds).
We close with a brief discussion of the limitations of our model.We tested the predictive power of our scaling routine (supplementary text section 3 and fig. S9) for two highly polydispersed, nonspherical, highly angular natural sands (supplementary text section 4, figs. S10 to S12, and table S4). We found that the model accuracy for natural sands was slightly worse than found in the glass spheres and poppy seeds (for example, 35% versus 20% error in peak for a rotating c-leg). As was the case for the near-spherical granular media tested, the functional forms of forces on the c-leg and the flat leg were still well captured by our scaling routine. Furthermore, the overestimation was not affected by reducing the polydispersity of the natural sand. This suggests that the nonsphericity and angularity of natural sand particles (30) may be the cause of this overestimation, which may require additional model fitting parameters and scaling factors. Our model is intended for dry sand [0.1 to 1 mm in particle diameter (29)] and may not work for dry cohesive powder (0.01 mm) (31). We do not expect our model to work if the particle size approaches a characteristic length of the locomotor (for example, 1-cm particles for our robot of 1-cm foot size), so that the continuum assumption breaks down and particles effectively become boulders. We also do not expect our model to capture wet, cohesive flowable media such as soil and mud.
We have developed a new approach to predicting legged locomotion on granular media. This terradynamics relies on new resistive force measurements and linear superposition (6, 26, 27). The general profiles of these resistive force measurements are insensitive (other than magnitudes) to a variety of granular media composed of slightly polydispersed, approximately spherical, rounded particles. Our terradynamics may not be limited to legged locomotion, because the integration of stresses should in principle work for devices of other morphology and kinematics, such as wheels, tracks, and earth movers moving on granular media (2, 25). For the particle types tested here, an important addition to our model would be to capture three-dimensional effects (16) and spatial and temporal variation in compaction (21) and slopes (17), and test its validity in the high speed “inertial fluid” regime (when leg intrusion speed is m/s, at which particle inertia dominates forces) (23). Our resistive force model also provides opportunities to test and develop new physics theories of dense granular flow (32). Finally, we envision that, in concert with aero- and hydrodynamics (3–12), a general terradynamics of complex ground will not only advance understanding of how animals move (1) at present (5–10, 13–19, 26) and in the past (17, 33), but also facilitate the development of robots with locomotor capabilities approaching those of organisms (11, 12, 20–23).
References
- (1) M. H. Dickinson, C. T. Farley, R. J. Full, M. A. R. Koehl, R. Kram, S. Lehman, How animals move: An integrative view. Science 288, 100 (2000).
- (2) M. G. Bekker, Off-the-Road Locomotion, Research and Development in Terramechanics (Univ. of Michigan Press, Ann Arbor, MI, 1960).
- (3) B. Etkin, Dynamics of Atmospheric Flight (Wiley, New York, 1972).
- (4) J. N. Newman, Marine Hydrodynamics (MIT Press, Cambridge, MA, 1977).
- (5) S. Vogel, Life in Moving Fluids: The Physical Biology of Flow (Princeton Univ. Press, Princeton, NJ, 1996).
- (6) E. Lauga, T. R. Powers, The hydrodynamics of swimming microorganisms. Rep. Prog. Phys. 72, 096601 (2009).
- (7) Z. J. Wang, Dissecting insect flight. Annu. Rev. Fluid Mech. 37, 183 (2005).
- (8) C. J. Pennycuick, Mechanics of flight. Avian Biol. 5, 1 (1975).
- (9) G. V. Lauder, J. C. Nauen, E. G. Drucker, Experimental hydrodynamics and evolution: Function of median fins in ray-finned fishes. Integr. Comp. Biol. 42, 1009 (2002).
- (10) R. Dudley, The Biomechanics of Insect Flight: Form, Function, Evolution (Princeton Univ. Press, Princeton, NJ, 2002).
- (11) R. S. Fearing, K. H. Chiang, M. H. Dickinson, D. L. Pick, M. Sitti, J. Yan, Wing transmission for a micromechanical flying insect. IEEE Int. Conf. Rob. Auto. 2000, 1509 (2000).
- (12) G. V. Lauder, E. J. Anderson, J. Tangorra, P. G. A. Madden, Fish biorobotics: Kinematics and hydrodynamics of self-propulsion. J. Exp. Biol. 210, 2767 (2007).
- (13) R. Blickhan, The spring-mass model for running and hopping. J. Biomech. 22, 1217 (1989).
- (14) G. A. Cavagna, H. Thys, A. Zamboni, The sources of external work in level walking and running. J. Physiol. 262, 639 (1976).
- (15) P. Holmes, R. J. Full, D. E. Koditschek, J. Guckenheimer, The dynamics of legged locomotion: Models, analyses, and challenges. SIAM Rev. 48, 207 (2006).
- (16) C. Li, S. T. Hsieh, D. I. Goldman, Multi-functional foot use during running in the zebratailed lizard (Callisaurus draconoides). J. Exp. Biol. 215, 3293 (2012).
- (17) L. R. Brand, Variations in salamander trackways resulting from substrate differences. J. Paleontol. 70, 1004 (1996).
- (18) S. G. Fancy, R. G. White, Energy expenditures by caribou while cratering in snow. J. Wildl. Manage. 49, 987 (1985).
- (19) L. J. Vitt, S. S. Sartorius, T. C. S. Avila-Pires, M. C. Espósito, Life on the leaf litter: The ecology of Anolis nitens tandai in the Brazilian Amazon. Copeia 2001, 401 (2001).
- (20) M. Raibert, K. Blankespoor, G. Nelson, R. Playter, and the BigDog Team, BigDog, the rough-terrain quadruped robot. Inter. Fed. Auto. Cont. 2008, 10822 (2008).
- (21) C. Li, P. B. Umbanhowar, H. Komsuoglu, D. E. Koditschek, D. I. Goldman, Sensitive dependence of the motion of a legged robot on granular media. Proc. Natl. Acad. Sci. U.S.A. 106, 3029 (2009).
- (22) A. M. Johnson, M. T. Hale, G. C. Haynes, D. E. Koditschek, Autonomous legged hill and stairwell ascent. 2011 IEEE Saf. Sec. Res. Rob. 2011, 134 (2011).
- (23) T. Zhang, F. Qian, C. Li, P. Masarati, A. M. Hoover, P. Birkmeyer, A. Pullin, R. Fearing, D. I. Goldman, Ground fluidization promotes rapid running of a lightweight robot. Int. J. Robotics. Res. 32, 10.1177/0278364913481690 (2013).
- (24) R. M. Nedderman, Statics and Kinematics of Granular Materials (Cambridge Univ. Press, New York, 1992).
- (25) G. Meirion-Griffith, M. Spenko, An empirical study of the terramechanics of small unmanned ground vehicles. IEEE Aerospace Conf. 2010, 1 (2010).
- (26) R. D. Maladen, Y. Ding, C. Li, D. I. Goldman, Undulatory swimming in sand: Subsurface locomotion of the sandfish lizard. Science 325, 314 (2009).
- (27) Y. Ding, N. Gravish, D. I. Goldman, Drag induced lift in granular media. Phys. Rev. Lett. 106, 028001 (2011).
- (28) Materials and methods are available as supplementary materials on Science Online.
- (29) R. A. Bagnold, The Physics of Blown Sand and Desert Dunes (Dover Publications, Mineola, NY, 2005).
- (30) G. Cho, J. Dodds, J. C. Santamarina, Particle shape effects on packing density, stiffness, and strength: natural and crushed sands. J. Geotech. Geoenviron. Eng. 132, 591 (2006).
- (31) B. Chaudhuri, A. Mehrotra, F. J. Muzzio, M. S. Tomassone, Cohesive effects in powder mixing in a tumbling blender. Powder Technol. 165, 105 (2006).
- (32) K. Kamrin, G. Koval, Nonlocal constitutive relation for steady granular flow. Phys. Rev. Lett. 108, 178301 (2012).
- (33) J. A. Clack, Gaining Ground: The Origin and Evolution of Tetrapods (Indiana Univ. Press, Bloomington, IN, 2012).
- (34) G. L. Ghiringhelli, P. Masarati, P. Mantegazza, M. W. Nixon, Multi-body analysis of a tiltrotor conguration. Nonlin. Dyn. 19, 333 (1999).
- (35) G. Hill, S. Yeung, S. A. Koehler, Scaling vertical drag forces in granular media. Europhys. Lett. 72, 137 (2005).
- (36) R. Albert, M. A. Pfeifer, A.-L. Barabási, P. Schiffer, Slow drag in a granular medium. Phys. Rev. Lett. 82, 205 (1999).
- (37) N. Mazouchova, N. Gravish, A. Savu, D. I. Goldman, Utilization of granular solidification during terrestrial locomotion of hatchling sea turtles. Biol. Lett. 6, 398 (2010).
- (38) N. Gravish, P. B. Umbanhowar, D. I. Goldman, Force and flow transition in plowed granular media. Phys. Rev. Lett. 105, 208301 (2010).
Acknowledgements
We thank Y. Ding, P. Umbanhowar, N. Gravish, G. Meirion-Griffith, S. Sharpe, H. Komsuoglu, D. Koditschek, and R. Full for discussions; J. Shen for assistance with robot modification; P. Masarati for multibody dynamic simulator support; S. Sharpe for measuring the angle of repose of 3-mm glass spheres and assistance with photography; P. Umbanhowar and H. Marvi for natural sand collection; and all the members of the Complex Rheology And Biomechanics Lab at Georgia Tech for general assistance. This work was supported by the Burroughs Wellcome Fund, the Army Research Laboratory Micro Autonomous Systems and Technology Collaborative Technology Alliance, the Army Research Office, and the NSF Physics of Living Systems program. C.L. was partially supported by a Miller Research Fellowship from the Miller Institute for Basic Research in Science of the University of California, Berkeley. The authors declare that they have no competing interests. C.L. designed the study, performed resistive force measurements, and performed robot experiments; C.L. and T.Z. performed model calculations; T.Z. performed robot simulation; D.I.G. oversaw the study; and C.L. and D.I.G. wrote the paper.
Citation Information
Chen Li, Tingnan Zhang, Daniel I. Goldman, A Terradynamics of Legged Locomotion on Granular Media, Science 339, 1408–1411 (2013), DOI: 10.1126/science.1229163
Materials and Methods
Force measurements
We used aluminum to construct the plate element (area cm2, thickness cm) and model legs (maximal length cm, width cm, thickness cm). We measured the friction coefficient between aluminum and poppy seeds to be (later we constructed robot legs using plastic of a similar friction coefficient with poppy seeds, ), by placing an aluminum plate on a wooden plate bonded with a single layer of poppy seeds, increasing the slope of the wooden plate from zero, and examining the angle at which the aluminum plate began to slide. Thus tan. The length and width of both the plate element and model legs were times the particle diameter, ensuring that the granular media could be approximated as a continuum.
Before each force measurement, we used an air fluidized bed ( cm2 surface area) (26) to prepare the granular media ( cm deep) to a well-defined compaction (see table S1 for the volume fractions of closely and loosely packed states of the granular media tested). Air flow was turned off during force measurements. We used a degree-of-freedom robotic arm (CRS Robotics) to move the plate element and rotate the model legs. We used a -axis force and torque transducer (ATI Industrial Automation) mounted between the intruder and the robotic arm to measure forces to a precision of N at a sampling frequency of Hz. We performed all the force measurements at low speeds ( cm/s) to ensure that particle inertia was negligible, and in a vertical plane at the middle of the air fluidized bed and far from the sidewalls (distance cm) to minimize boundary effects.
In the plate element intrusion experiment, we attached the plate to the force and torque transducer via a supporting rod and an adjustable mount with which attack angle could be varied. We varied intrusion angle by adjusting the trajectory of the robotic arm. For each combination of and , we separately measured the forces on the supporting rod and mount moving in the granular media without the plate, and subtracted them to obtain forces exerted by the granular media on the plate alone.
During each test session, we first prepared the granular media while the plate was above the surface. We then moved the plate (oriented at attack angle ) downward to the surface (depth ), paused it for 2 seconds, and then intruded it into the granular media along intrusion angle . After intrusion was finished, we prepared the granular media again, and extracted the plate along the same path. This gave us measurements of stresses for both . For horizontal movements (), were nearly constant when the plate was far from the container sidewalls, and we obtained by fitting Eq. 1 to averages of in the steady state regions at three depths ( cm, cm, and cm). We measured for within , and determined for within and by symmetry:
| (S1) |
| (S2) |
In the model leg rotation experiment, we rotated the model legs at an angular velocity rad/s at a hip height cm within leg angle (at the beginning and end of which all three legs tested were fully above the granular surface), where leg angle was defined as the angle sweeping from the vertical downward direction to the direction along which leg length was maximal. For each model leg, we separately measured the forces due to the weight of the model legs rotating in the air, and subtracted them to obtain the forces on the model legs exerted by the granular media during rotation.
Due to the high repeatability of our fluidized bed and robotic arm, we found that for all media tested, run-to-run variation in for fixed and was always within N/cm3 at any given depth; thus we only performed one trial for each combination of and . All the stresses were calculated in the regions where the plate was far from the container boundaries (distance cm). We also confirmed that for low enough speeds, intrusion forces in granular media were insensitive to speed (for example, in loosely packed poppy seeds, at m/s, force only increased by less than from that at cm/s); thus, particle inertia was negligible.
Robot experiments
We built our robot (body length cm, body mass g) by modifying a small commercially available robot (RoboXplorer, Smart Lab). The robot had similar morphology and kinematics as a RHex robot, with a rigid body and six legs performing 1 degree-of-freedom rotation in an alternating tripod gait. We substituted the stock motor with a stronger one (RadioShack Super Speed – VDC Hobby Motor, Model # 273-256) and modified the gear trains (gear ratio: 47 revolutions in the motor transmits into 1 rotation of the legs). These changes increased maximal stride frequency to Hz. We removed the external body shell to reduce weight and the belly area (to cm2). This reduced drag on the belly during locomotion on granular media.
We used -D printing to make custom robot legs. All the legs had the same maximal length cm, width cm, and thickness cm, but different curvatures . The ABS plastic used to fabricate the legs had a similar friction coefficient with poppy seeds () to that of aluminum with poppy seeds (). The leg width and length were times the particle diameter, allowing the granular media to be approximated as a continuum. We ensured that the legs had large enough stiffness and moved like rigid bodies ( deformation) during locomotion.
We tuned the center of mass of the robot to overlap with the geometric center of the body by adding mass to the lighter end of the robot. We measured the masses, dimensions, and relative positions of all robot body and leg parts, and calculated the moment of inertia of the robot to be g cm2 about the pitch axis through the center of mass. We powered the robot by an external power supply (Power Ten Inc.) to ensure constant voltage during trials, and adjusted voltage to vary stride frequency between trials.
Before each trial, we used an air fluidized bed track ( cm2 surface area) to prepare the granular media ( cm deep) to a well-defined compaction, using methods similar to those in (21). We used two synchronized high-speed cameras (X-PRI, AOS Technologies) to capture top and side views of the robot’s locomotion at frame/s. We measured from the side view, and measured forward speed from the top view by digitizing a high contrast marker placed near the center of mass. For each and , we performed three trials and reported mean s.d. for average forward speed in experiment.
Robot simulation
We used a multibody dynamic simulator, MBDyn (34), to create a simulation of the robot locomotion on granular media. MBDyn features a full three-dimensional simulation with degrees of freedom ( translations and rotations). We constructed the robot body using rigid plates (the front, rear, and belly surfaces) and rigid legs. We constrained the robot body movement within the vertical plane, with fore-aft and dorso-ventral translations and pitch, and allowed the legs to only rotate about their axles perpendicular to the vertical plane. For each time step, we calculated the depth , attack angle , and intrusion angle for each element to determine element stresses (using Eq. 1 and interpolated from the data in Fig. 2, C and D). We then summed forces on all elements to obtain net forces using our resistive force model by Eq. 2, and calculated the body dynamics by Eq. 3. We found that dividing each body plate and leg into fewer elements could further increase simulation speed at the cost of model accuracy.
In simulation tests, we varied curvature between in increments of , and varied stride frequency between Hz in increments of Hz. For each and , we performed three trials using different initial conditions with a phase difference of for each tripod. We found that this resulted in variation in average forward speed of cm/s; thus, we reported only the means of in simulation. We confirmed that at the maximal stride frequency tested ( Hz) the leg speeds were m/s averaged over a stance, allowing particle inertia to be negligible.
Supplementary Text
This supplementary text contains 5 sections:
In section 1, we review the depth-only vertical penetration and horizontal drag force models. Based on the flat-plate approximation, we then calculate stresses per unit depth and net forces on rotating legs using these depth-only force models, and compare with our resistive force measurements and model predictions.
In section 2, we present our resistive force measurements and model calculations for a variety of granular media tested, which have different particle size, density, friction, and compaction; from these results we discover that the stress profiles are generic.
In section 3, we develop a scaling routine to capture the similar stress profiles observed for the variety of granular media, by scaling generic stress profiles determined from averages of fits to the measured stress profiles. This provides a practical means to easily apply our resistive force model.
In section 4, we test the ability of our scaling routine to predict forces on intruders moving in natural sands, and discuss limitations of our model for natural sands.
In section 5, we compare the predictive accuracy for locomotor performance (speed) of the robot using our resistive force model to that using our scaling routine and that using the depth-only force models.
1. Depth-only force models and their limitations
Previous studies of intrusion forces in granular media focused on simple intruders (e.g. plates, rods, and spheres) moving with simple kinematics (e.g. vertical penetration and horizontal drag). For example, the vertical force on a horizontal plate element () moving vertically () in granular media was observed to be proportional to the plate’s depth and area (21, 35):
| (S3) |
Similarly, the horizontal force on a vertical plate element () moving horizontally () in granular media was proportional to plate depth and plate area (36–38):
| (S4) |
where is the velocity of the plate in the vertical direction, and and are vertical and horizontal stresses per unit depth for and (determined from measurements in Fig. 2, C and D).
Both the vertical penetration and horizontal drag force models only account for the dependence of stresses on the intruder’s depth (), but not the dependence on its orientation (attack angle ) or movement direction (intrusion angle ). Hereafter we refer to these force models as the “depth-only force models”.
In previous studies of legged locomotion on granular media (16, 21, 37), due to the lack of the resistive force model, the forces on a complex intruder were estimated from the depth-only force models, using the flat-plate approximation: The vertical force on a leg element of area and arbitrary and was approximated by that on a horizontal leg element whose area was the element area projected into the horizontal plane (16, 21):
| (S5) |
Similarly, the horizontal force on the leg element was approximated by that on a vertical leg element whose area was the element area projected into the vertical plane (37):
| (S6) |
The effective stresses per unit depth calculated from these depth-only force models using flat plate approximation were then:
| (S7) |
Comparing the calculated using eq. S7 (fig. S1) to our resistive force measurements (Fig. 2, C and D) for loosely packed poppy seeds, we found that these depth-only force models did not capture most of the measured stress profiles. In particular, the depth-only vertical penetration force model overpredicted for all and except when the plate was horizontal () and moving vertically (). Contrary to experimental measurements, the calculated from the depth-only models were symmetric to (horizontal orientation), and (or ) was always opposing the plate’s vertical (or horizontal) velocity (the shaded regions shrank to a line).
We used these depth-only force models to calculate the net lift and thrust versus leg angle for the three model legs rotated through all media tested, by the integration of stresses over the legs (Eq. 3) using . We found that they not only significantly overpredicted peak (by up to ) but also erroneously predicted similar peak for the c-leg and reversed c-leg (fig. S2).
2. Generality of resistive force model for a variety of granular media
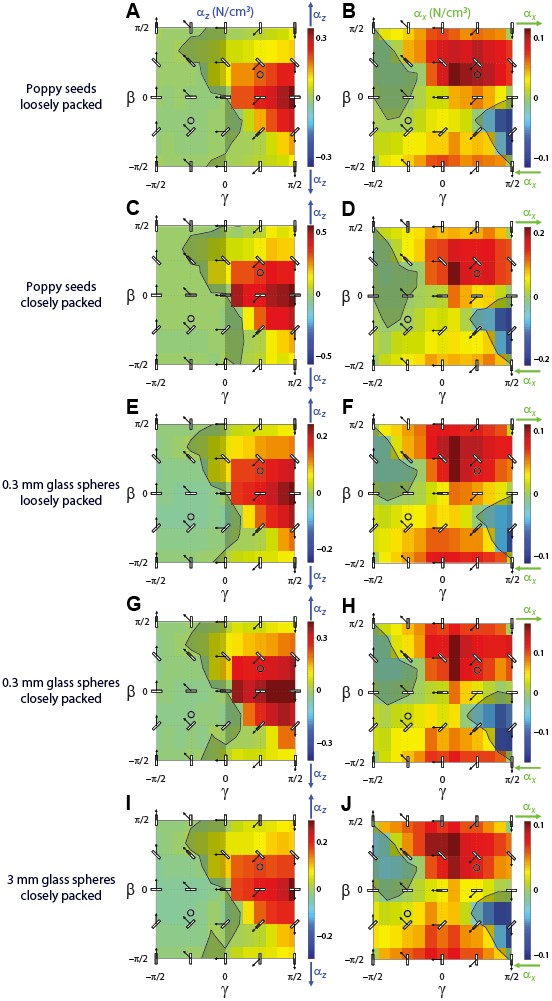
To test the generality of our resistive force model and provide a database for future studies (we provide the force measurements in this section in Additional Data Table S5), we performed resistive force measurements for three granular media—poppy seeds, mm glass spheres, and m glass spheres (fig. S3), which have different particle size, shape, density, and friction (measured by angle of repose) (table S1). We prepared these granular media into well-defined compactions which affected stresses (21, 38). We prepared poppy seeds and mm glass spheres into both a loosely packed (LP) and a closely packed (CP) states, and prepared m glass spheres into a closely packed (CP) state (table S1).
| granular medium | particle diameter (mm) | particle material density (g/cm3) | compaction | volume fraction | angle of repose (∘) |
| poppy seeds | 1.1 | loosely packed (LP) | 0.58 | 36 | |
| closely packed (CP) | 0.62 | 47 | |||
| mm glass spheres | 2.5 | loosely packed (LP) | 0.58 | 25 | |
| closely packed (CP) | 0.62 | 35 | |||
| mm glass spheres | 2.6 | closely packed (CP) | 0.63 | 21* |
Despite differences in magnitudes and fine features, we observed similar profiles of the vertical and horizontal stresses per unit depth for all media tested (fig. S4). We provide the data for all media in Additional Data Table S5 (separate file in Microsoft Excel format).
For all media tested, our resistive force model predicted the net lift and thrust versus leg angle on the three model legs rotated through granular media (fig. S5). Compared with predictions from the depth-only force models (fig. S1), our resistive force model had a significant improvement in accuracy.
3. Scaling routine for easy use of the resistive force model
To provide a means for practical use of our resistive force model and comparison with new theories of dense granular flow (32), we performed a fitting approximation to the stress per unit depth data for all media tested, and developed a scaling routine based on the data fits.
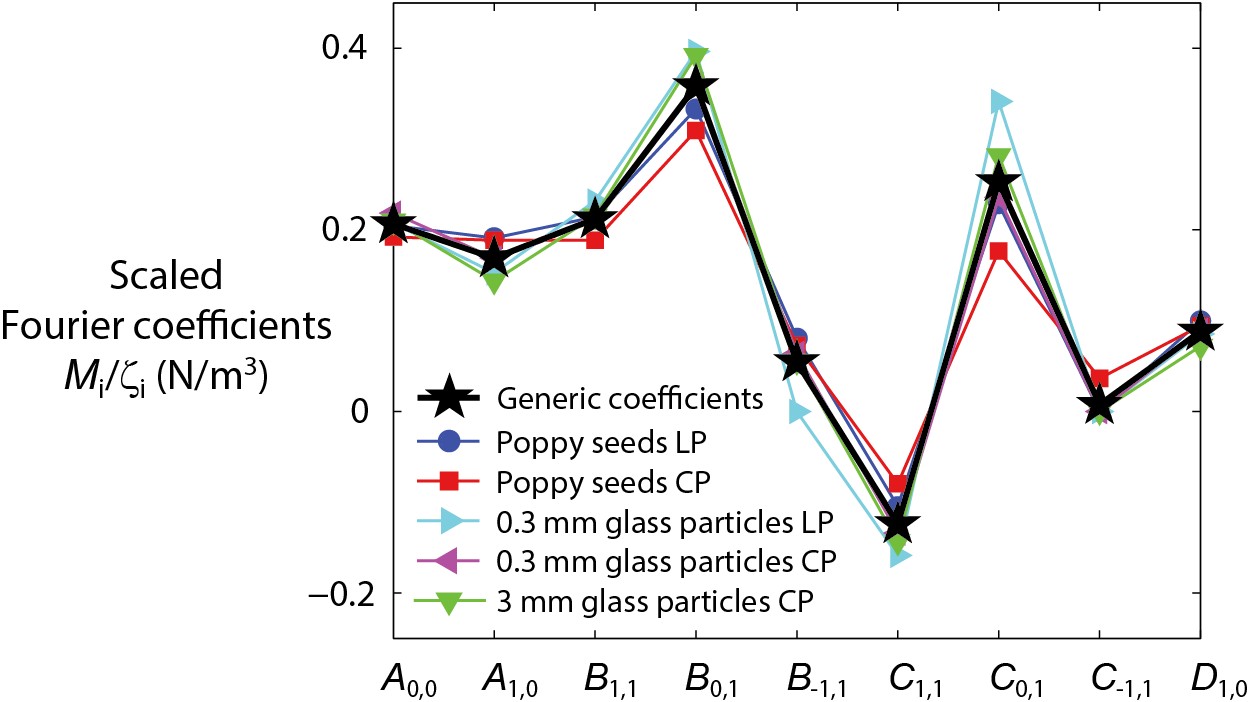
We first performed a discrete Fourier transform of the data (fig. S4) over and to obtain a fitting function. We examined the Fourier coefficients and found that the data of all media tested could be well approximated by the following fits:
| (S8) |
using nine zeroth- and first-order terms (whose magnitudes are larger than ) (table S2):
| (S9) |
| granular medium | poppy seeds | mm glass spheres | mm glass spheres | generic coefficients | ||
| compaction | LP | CP | LP | CP | CP | n/a |
| matrix notation | ||||||
| 0.051 | 0.094 | 0.040 | 0.081 | 0.045 | 0.206 | |
| 0.047 | 0.092 | 0.030 | 0.063 | 0.031 | 0.169 | |
| 0.053 | 0.092 | 0.045 | 0.078 | 0.046 | 0.212 | |
| 0.083 | 0.151 | 0.077 | 0.133 | 0.084 | 0.358 | |
| 0.020 | 0.035 | 0 | 0.024 | 0.012 | 0.055 | |
| 0.026 | 0.039 | 0.031 | 0.050 | 0.031 | 0.124 | |
| 0.057 | 0.086 | 0.066 | 0.087 | 0.060 | 0.253 | |
| 0 | 0.018 | 0 | 0 | 0 | 0.007 | |
| 0.025 | 0.046 | 0.017 | 0.033 | 0.015 | 0.088 | |
| scaling factor | 0.248 | 0.488 | 0.194 | 0.371 | 0.214 | 1 |
By symmetry, , and . However, the data slightly deviated from this equality because the initial positions of the plate were close to one of the boundaries of the container. Therefore, before the Fourier transform, we averaged the raw data for to restore symmetry by . The raw data were also not uniformly sampled in the direction; we found that this only resulted in small errors in data fitting.
We found that for all media tested (denoted by poppyLP, poppyCP, mmLP, mmCP, and mmCP), the Fourier coefficients could be collapsed onto a generic coefficient curve, , by dividing by a scaling factor (table S2, fig. S10):
| (S10) |
This enabled us to scale stresses per unit depth () and thus forces ( and ) for all media tested. By eq. S8, using the generic coefficient curve () from table S2, we calculated generic stress (per unit depth) profiles (fig. S7). We found that, by multiplication by the scaling factor , these generic stress profiles well approximated the measured (fig. S4) for all media tested:
| (S11) |
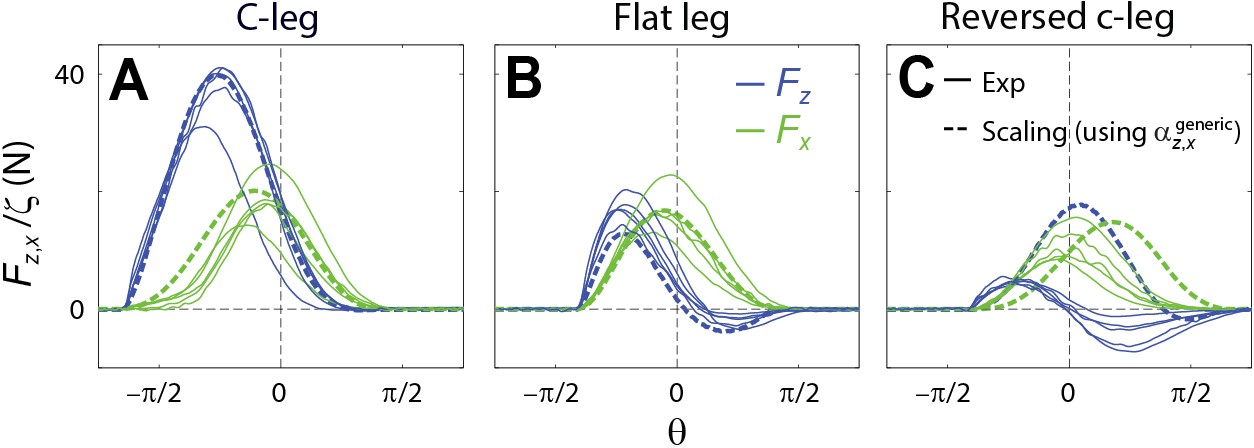
Using Eq. 2 and , we calculated the generic force profiles on the three model legs rotated through granular media (fig. S8). We found that in all media tested and for both the c-leg and the flat leg, these generic force profiles captured the measured scaled by the scaling factors :
| (S12) |
However, the agreement was worse for the reversed c-leg. Our resistive force model revealed that this was because by using , stresses were significantly overestimated for the reversed c-leg’s elements that reached large depths.
We further observed that the ratio of the maximal vertical stress (which occurred on a horizontal plate moving downward) between the measurements () and fits () was similar for all media tested (table S3):
| (S13) |
where is in mean s.d.
| granular medium | poppy seeds | mm glass spheres | mm glass spheres | ||
|---|---|---|---|---|---|
| compaction | LP | CP | LP | CP | CP |
| 0.35 | 0.56 | 0.24 | 0.40 | 0.29 | |
| 0.26 | 0.47 | 0.19 | 0.38 | 0.22 | |
| 1.37 | 1.19 | 1.27 | 1.05 | 1.33 | |
Therefore, we propose that for a sufficiently level and uniform dry granular medium composed of near-monodispersed, near-spherical, rounded particles of to mm in diameter, one can simply measure its maximal vertical stress by pushing a horizontal plate downward to infer the maximal value of the fit vertical stress :
| (S14) |
The value of in N/m3 then gives the scaling factor for this granular medium, because we choose the magnitudes of the generic curve so that the values of and are nearly the same for all media tested:
| (S15) |
Note that this equation only equates the numeric values on both sides, because is dimensionless.
Then, from eq. S11, by scaling the generic stress profiles (fig. S7) by the determined scaling factor , we can obtain an approximation of stress profiles for this granular medium:
| (S16) |
This scaling routine provides an alternative to measuring for all and (at the cost of model accuracy). As demonstrated by the model leg rotation experiments (fig. S8) and robot locomotion experiments (see fig. S13 in the next section), our scaling routine only suffers a small loss in accuracy for much of the leg morphology and stride frequencies tested. This technique can be particulary useful in a field setting, because only a single force measurement is needed.
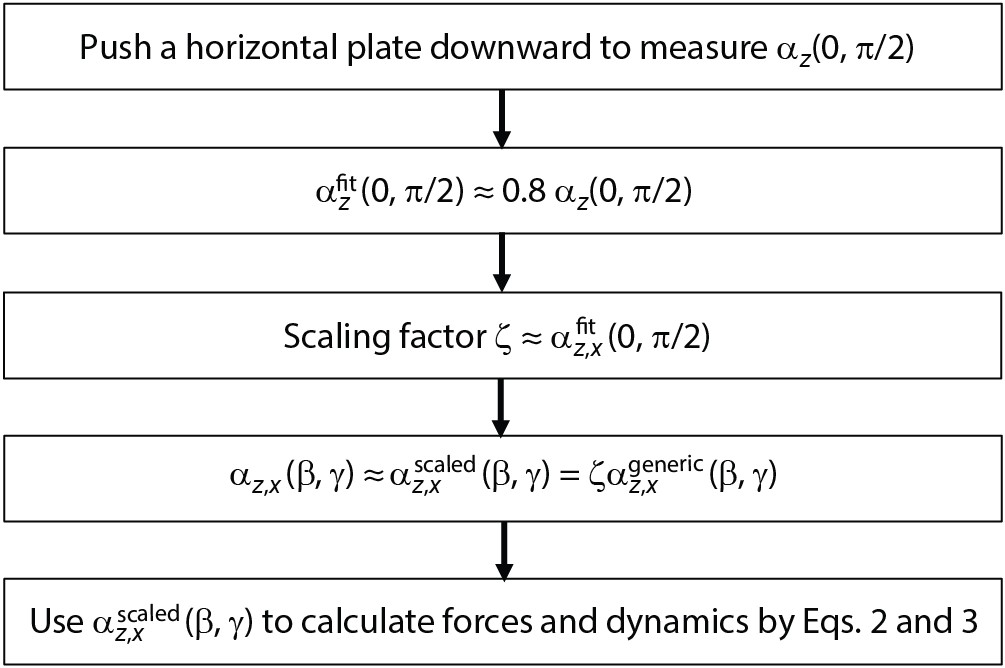
We summarize these practical steps to use our resistive force model in fig. S9.
4. Applicability of resistive force model to natural sands
To test the predictive power of our resistive force model for natural sands, we chose two natural sands of higher polidispersity and angularity than those of the granular media tested, and examined whether the scaling routine (fig. S9) could predict the net forces on the three model legs during rotation through the natural sands.
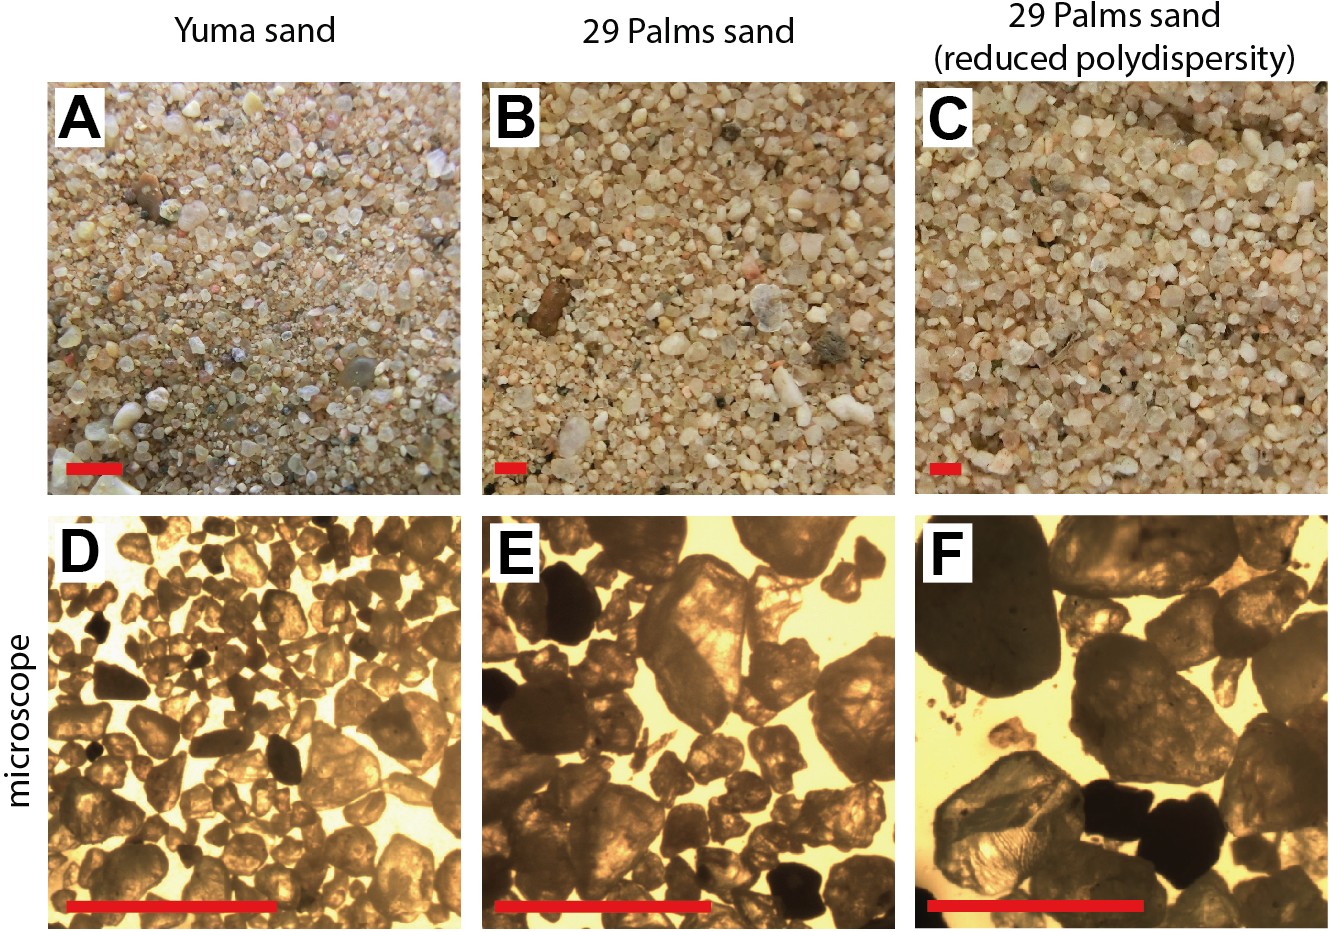
The two natural sands, referred to as “Yuma sand” and “29 Palms sand” (table S4, fig. S10), were collected from the Mojave Desert in the southwest United States, one from Yuma, Arizona and the other from 29 Palms, California. The Yuma sand had most particles (70% by mass) in the 0.06–0.3 mm particle size range, and the 29 Palms sand had most particles (91% by mass) in the 0.3–3 mm particle size range. Both naturals sands were fluidized by the fluidized bed before each force measurement was performed. We further tested modified 29 Palms sand with reduced polydispersity to examine the effect of polydispersity on model accuracy.
| natural sand | particle diameter (mm) | mass percentage (%) |
|---|---|---|
| Yuma sand | 0.06 | 2 |
| 0.06–0.3 | 68 | |
| 0.3–3.0 | 17 | |
| 3.0 | 13 | |
| 29 Palms sand | 0.3 | 5 |
| 0.3–0.6 | 36 | |
| 0.6–0.7 | 55 | |
| 0.7–3.0 | 3 | |
| 3.0 | 1 | |
| 29 Palms sand (reduced polydispercity) | 0.6–0.7 | 100 |
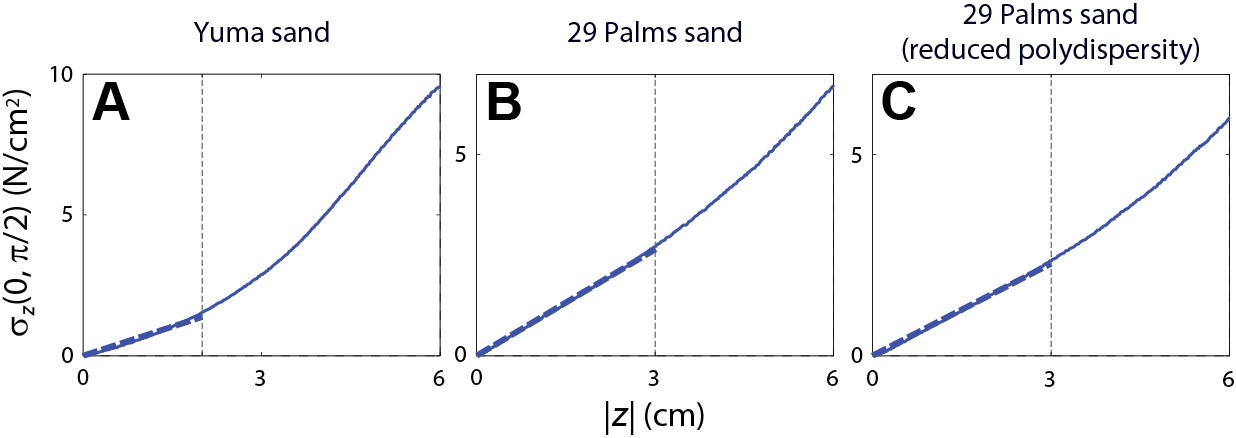
During downward penetration () into both the Yuma and 29 Palms sands, the vertical stress on a horizontal plate () increased nearly proportionally to depth at low enough depths (fig. S11, solid curves), similar to observations in the granular media tested. However, for both the natural sands, vesus displayed nonlinearity as depth further increased sooner than observed for the granular media tested. This was because both natural sands had larger internal stresses (larger magnitudes) and likely suffered boundary effects at much shallower depths as compared to the granular media tested. In addition, for the Yuma sand which had more particles in the 0.06–0.3 mm particle size range, this nonlinearity due to boundary effects was more pronounced. Therefore, to minimize possible errors from boundary effects, we perform linear fits with zero intercept to the versus data (fig. S11, dashed curves) over the linear regime (0–2 cm for the Yuma sand; 0–3 cm for the 29 Palms sand) to obtain (slopes of dashed lines) for both the natural sands. This gave us their scaling factors and estimates of their stress profiles from (eq. S16).
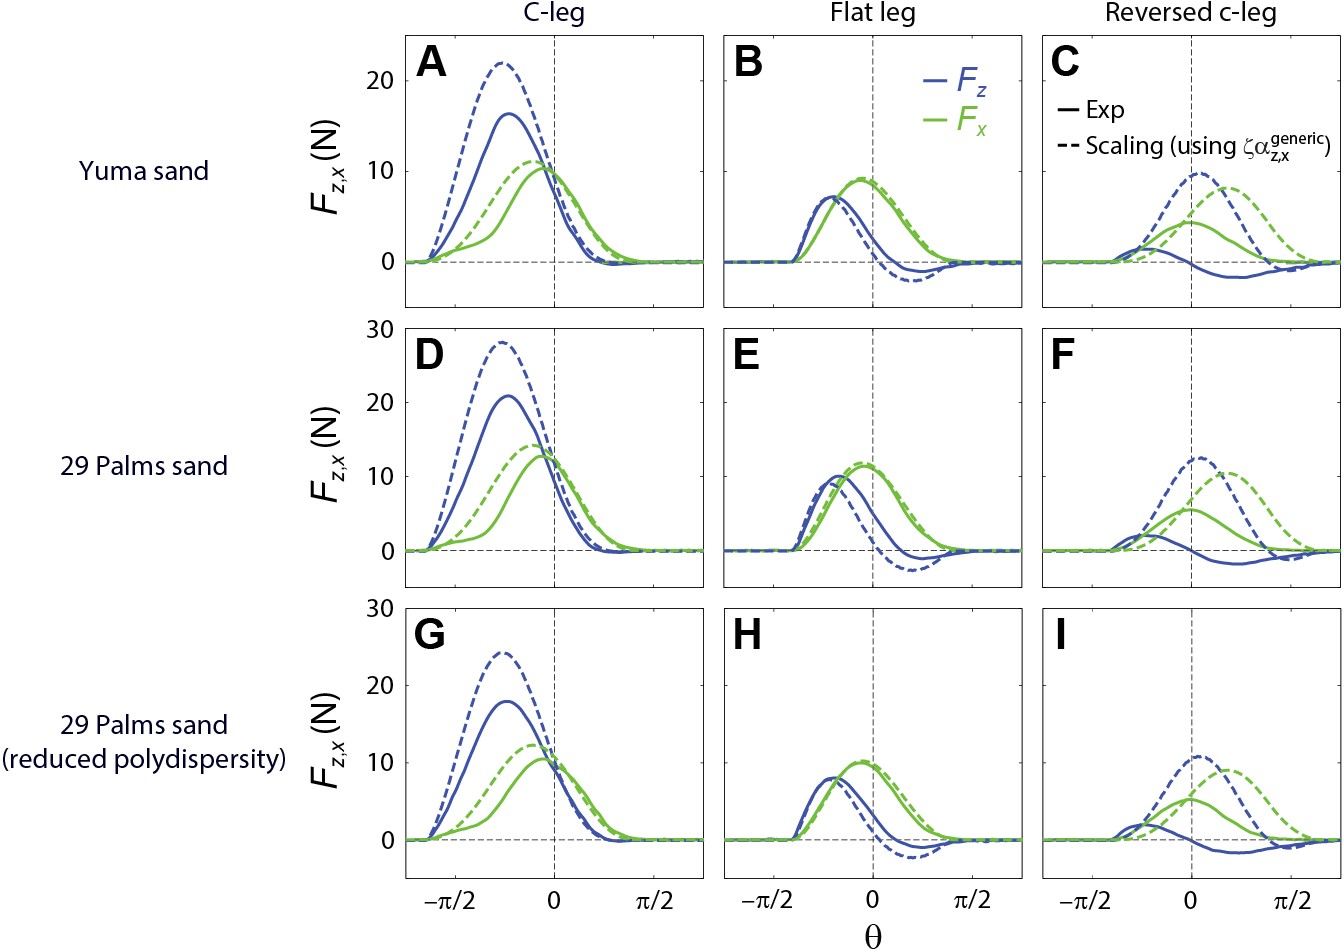
For the three model legs rotated through both the Yuma and 29 Palms sands, both the net lift and thrust versus leg angle displayed asymmetric profiles similar to those observed for the granular media tested (fig. S12, solid curves). Using the obtained from the vertical penetration experiment (fig. S11), our scaling routine significantly overpredicted on the c-leg for both the Yuma and 29 Palms sands (both by 35%). Nevertheless, the shape of model predictions were similar to experimental observations (fig. S12, dashed curves). The model accuracy was best for the flat leg, and worst for the reversed c-leg.
There are two major differences between the natural sands and the granular media tested: The natural sands have higher polydispersity, and are also less spherical and more angular. To probe where the overprediction (of forces on the c-leg) stemmed from, we further tested the 29 Palms sand with reduced polydispersity (obtained by sieving the sand to obtain only the 0.6–0.7 mm particles). We found that while both and dropped by 14% (figs. S11 and S12), the model overprediction of forces on the c-leg remained the same (35%). This suggested that the non-spherical and angular shape of the natural sand particles, rather than their higher polydispersity, was likely the cause of the model overprediction.
5. Comparison of model accuracy in predicting legged locomotion
To evaluate the accuracy of our scaling routine in predicting legged locomotion, we used our multibody dynamic simulation to simulate the robot’s movement on loosely packed poppy seeds using the scaled generic stress profiles (). We calculated the robot’s average forward speed versus stride frequency and leg curvature (fig. S13), and compare it with experimental measurements and resistive force model predictions (without using the scaling routine). As a comparison, we also calculated using obtained from the depth-only force models (fig. S1).
We found that the simulation using scaled generic stress profiles () only suffered a small loss in accuracy as compared to that using the measured . By contrast, the simulation using stresses from the depth-only force models suffered a larger loss in accuracy (by up to error), and in particular, erroneously predicted that the robot moved at similar speeds using both c-legs and reversed c-legs.
In addition to the predictions locomotor kinematics, our resistive force model and multibody dynamic simulation also allowed us to calculate ground reaction forces (fig. S14) during locomotion on granular media (which would be otherwise difficult to measure), in a similar fashion as calculations of lift, drag, thrust, traction, and resistance in studies of vehicle mobility in fluids and terramechanics studies. Notice the larger vertical ground reaction forces produced by the C-legs relative to those by the reversed c-legs. This allowed the robot to maintain higher lift above the granular medium, reducing drag on the belly.
Plate element intrusion experiments. Left: Intrusion for representative attack angle and intrusion angle . Right: Extraction for representative . Top: Videos of the plate moving in a granular medium (loosely packed poppy seeds). Bottom: Vertical (, blue curve) and horizontal (, green curve) stresses versus depth . Videos were taken with the plate at the container boundary for illustration purpose only. Forces were measured with the plate in the middle of the container, far away from the boundary. The red lines originating from the center of the top panels indicate granular forces on the plate element. The plate was moved at cm/s. See Fig. 2, A and B for schematic of the experiment and definition of variables.
Leg rotation experiments. Left: C-leg. Right: Reversed c-leg. Top: Videos of the leg rotating through a granular medium (loosely packed poppy seeds). Bottom: Net lift (, blue curve) and thrust (, green curve) versus leg angle . Videos were taken with the plate at the container boundary for illustration purpose only. Forces were measured with the plate in the middle of the container, far away from the boundary. The red lines originating from the center of the top panels indicate granular forces on the model legs. The model legs were rotated at rad/s (leg tip speed cm/s). Note that in the c-leg video the axle deflected slightly during rotation—this was an artifact due to the extra-long supporting rod in order for the plate to reach the boundary for illustration purpose only. For force measurements performed in the middle of the container, the supporting rod was shorter and the axle did not deflect. See Fig. 3 A to C for schematic of the experiment and definition of variables.
Leg rotation model calculations. Left: C-leg. Right: Reversed c-leg. Top: Videos of the leg rotating through a granular medium (loosely packed poppy seeds). Bottom: Net lift (, blue curve) and thrust (, green curve) versus leg angle . The thick red lines originating from the center of the top panels indicate net forces on the model legs. The thin red lines on the model legs indicate element forces (on a larger scale). See Fig. 3 A to C for schematic of the experiment and definition of variables.
Robot (body length cm, body mass g) running on a granular medium (loosely packed poppy seeds) using c-legs and stride frequency Hz. Video is played in real time.
Robot experiments. Top: Using c-legs ( Hz). Middle: Using reversed c-legs ( Hz). Bottom: Forward speed versus time . Videos are played 5 times slower than real time. Note that in the trial using reversed c-legs, the robot body orientation was reversed; we verified that this did not affect robot kinematics and speed (because the center of mass of the robot was tuned to overlap with the geometric center of the body). See Fig. 4 A for definition of variables.
Robot simulation. Top: Using c-legs ( Hz). Middle: Using reversed c-legs ( Hz). Bottom: Forward speed versus time . Videos are played 5 times slower than real time. The red and green arrows on the two tripod of legs indicate the ground reaction forces on the leg elements calculated from simulation. Note that the forces on the body are not shown. See Fig. 4 A for definition of variables.
Additional Data Table S5 (separate file in Microsoft Excel format)
http://crablab.gatech.edu/pages/movies/files/Terradyn_table_s5.xls
Original data of vertical () and horizontal () stresses per unit depth versus attack angle and intrusion angle , for all media tested. These data were used to produce Fig. 2, C and D and fig. S4.