119–126
Impact of accretion on the statistics of neutron star masses
Abstract
We have collected the parameter of 38 neutron stars (NSs) in binary systems with spin periods and measured masses. By adopting the Boot-strap method, we reproduced the procedure of mass calculated for each system separately, to determine the truly mass distribution of the NS that obtained from observation. We also applied the Monte-Carlo simulation and introduce the characteristic spin period 20 ms, in order to distinguish between millisecond pulsars (MSPs) and less recycled pulsars. The mass distributions of MSPs and the less recycled pulsars could be fitted by a Gaussian function as and respectively. As such, the MSP masses are heavier than those in less recycled systems by factor of , since the accretion effect during the recycling process.
keywords:
Neutron star, pulsar, mass, Monte-carlo simulation1 Content
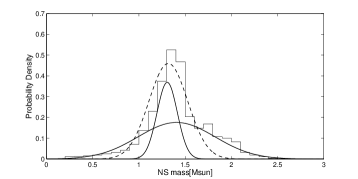
The measured mass distribution of NSs in pulsar binary systems is more diverse than previously thought. We have applied the Boot-strap method together with the Monte-Carlo simulation to the eclipse X-ray binaries, low mass X-ray binaries, double neutron stars (DNS) and white dwarf (WD)-NS systems, respectively. The result of this simulation is shown in Fig. 1. Fitting a Gaussian function gives us the mass distribution is with 1 confidence level (dash line). While the bimodal distributions can be fitted the simulated result perfectly. This result agrees with some theoretical predictions such as those by Kiziltan et al. (2010) and Valentim et al. (2011). The solid line shows the double Gaussian fitting curves ( and with 1 confidence level, respectively). It should be noticed that the bimodal distribution is coincidence with the result of Bayesian statistical method based on the data of DNS and NS-WD systems as showed by Kiziltan et al. (2010). This has strongly supported the idea that the recycled MSP become more massive () than those in less recycled pulsar via the accretion phase in recycling process.
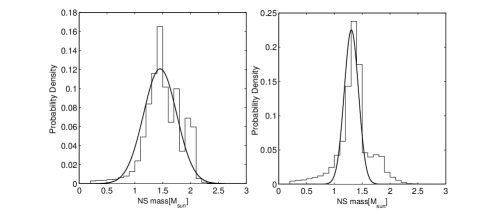
To discriminate clearly whether this result is due to the selection effect or different evolution scenario, we set a characteristic spin period ( = 20 ms) which helps us to divide all the sources into two groups: MSPs with and less recycled pulsars with (zhang et al. 2011). We find that the average distribution of MSPs is while in less recycled pulsar is . The results are shown in Fig. 2 which indicate that the mass of rapidly rotating MSPs is systematic higher than those in the less recycled ones by factor of during the accretion phase. Furthermore, the large deviation of the MSP distribution could be reduced if we invoke the accretion-induced collapse (AIC) in WDs, since the AIC is expected to produce normal NSs, which in binaries can evolve into MSPs through the usual recycling scenario.
2 Conclusion
The simulation results of the average masses show that the MSPs are heavier than those in less recycled pulsars. This result strongly support the idea that the MSPs accreted during the accretion phase in the recycling process. Furthermore, the AIC scenario must be invoked in order to reduce the large deviations of the MSP distribution. This work is supported by NBRPC(2009CB824800, 2012CB821800) and the NSFC(10773017, 11173034).
References
- (1) Bhattacharya, D., & van den Heuvel, E.P.J. 1991, Phys. Rep, 203,1
- (2) Haensel, P., Potekhin, A. Y., & Yakovlev, D. G. 2007, Neutron Stars 1. Equation of State and Structure (New York: Springer)
- Kiziltan (2010) Kiziltan, A. K., & Thorsett, S. E. 2010, arXiv:1011.4291
- Miller (2002) Miller, C. 2002, Nature, 420, 31
- (5) Ozel, F., Psaltis, D., & Narayan, R., et al. 2012, ApJ, 757,55
- (6) Thorsett, S.E., & Chakrabarty, D. 1999, ApJ, 512,288
- (7) Valentim, R., Rangel, E., & Horvath, J.E. 2011, MNRAS, 414, 1427
- (8) Zhang, C.M., Yin, H.X., & Kojima, Y., et al. 2007, MNRAS, 374,232
- (9) Zhang, C.M., Wang, J., & Zhao, Y.H., et al. 2011, A&A, 527,83