Low lying spectroscopy of odd-odd 146Eu
Abstract
Electron Capture (EC) decay of 146Gd( = 48d) to the low lying states of 146Eu has been studied using high-resolution ray spectroscopy. The 146Gd activity was produced by (, 2n) reaction at Eα = 32 MeV using 93.8 enriched 144Sm target. The level structure has been considerably modified from the measurement of ray singles, coincidences and decay half lives. Lifetime measurement has been performed for the 3- (114.06 keV) and 2- (229.4 keV) levels of 146Eu using Mirror Symmetric Centroid Difference (MSCD) method with LaBr3 (Ce) detectors. The lifetimes for these two states have been found to be 5.38 2.36 ps and 8.38 2.19 ps respectively. Shell model calculation has been performed using OXBASH code in order to interpret the results.
pacs:
21.10.-k; 21.10.Tg; 21.60.Cs; 23.20.Lv; 29.30.Kv; 29.40.Wk; 29.40.Mc;I Introduction
The low lying spectroscopy of nuclei, from both decay as well as in beam measurements anagha ; liddick ; garret , has drawn considerable attention in recent years. Such measurements for the odd-odd transitional nuclei in A 140 region are crucial in understanding the role of neutron proton interaction in the N, Z = 50 - 82 subshell space. The nuclei in the vicinity of the magic N = 82 and semi-magic Z = 64 exhibit excitations due to multiparticle-hole as well as quasi-vibrational
structures. The coupling of valence particles to the core phonon gives rise to complex (multi-)particle
phonon level families in these nuclei kleinheinz . The particle
(hole) interactions and the resulting competition of the single particle with the underlying collective excitations
have been rigorously explored through a number of experimental and theoretical investigations kader ; podolyak ; pm-sarmi ; la136 .
Although the low lying levels in this mass region have been studied from decay and in-beam experiments with light ion beams, the information on level lifetimes and transition moments has been very rare in most of the cases. Moreover, these studies have been performed mostly with either NaI(Tl) or BaF2 scintillators and intrinsic Ge(Li) detectors with limited time resolution.
Thus, it is important to undertake systematic measurements on lifetime and transition moments for many of these nuclei.
The measurement of lifetimes of the order of several ones or tens of picoseconds requires a detection system having a very good time resolution as well as a modest energy resolution. The precise technique for the measurements of level lifetimes of the order of few picoseconds has been a topic of research for many years mach1 ; mach2 . With the availability of efficient inorganic scintillators, such as, LaBr3(Ce), such measurements have taken a new direction regis ; ce138-new .
The odd-odd 146Eu, with one extra neutron outside N = 82 shell closure is a topic of interest in order to test the persistence of subshell closure at Z = 64 gd146 . The structure of 146Eu has been studied both from decay as well as in-beam reaction experiments nndc ; holmberg ; kantus ; ercan1 ; ercan2 ; b10 ; trans1 . The decay measurements have been carried out by different groups nndc in order to develop the excited levels as well as to obtain their lifetimes. Of these, R. Kantus et al. kantus have performed coincidence measurements with a Ge(Li) and a Gam-X detector and developed a decay scheme up to 690.7 keV excitation. However, according to the latest compilation in Nuclear Data Sheets nndc , the different measurements on 146Gd EC decay exhibit a lot of discrepancy in the observed levels, the energy and the intensity of the decay rays.
The suggested sequence of the low lying states has been accounted for by combining a d5/2 proton hole and a f7/2 neutron particle following the jj coupling scheme of odd-odd nuclei.
The prompt decay of 9+, 235 s isomeric state of 146Eu has been rigorously studied by Ercan et al. ercan1 .
The lifetime of the first 3- and 2- states has been measured by L. Holmberg et al. holmberg by using electron-electron coincidence measurement with a magnetic spectrometer where they could only provide the limits of the lifetime values as 0.16ns and 0.2ns for the two states respectively. However, the sequence of 114 and 115 keV transitions has been modified afterwards by Kantus et al. kantus . Also, there exists a large variance (0.16 ns to 0.8 ns) in the measured lifetime of the 3- state nndc . Besides, the lifetime of the above two excited states seems to be quite large considering the suggested configuration of these states.
In the present work, we have reported the low lying level scheme of odd-odd 146Eu nucleus from the EC decay of 48d 146Gd. The decay scheme of 146Gd has been modified considerably following the measurements of ray singles, coincidences and the decay half lives using high resolution Ge detectors. The lifetime of the first 3- and 2- states have been measured with LaBr3 (Ce) detectors by employing the Mirror Symmetric Centroid Difference (MSCD) method regis . A shell model calculation has also been performed using OXBASH code BAB94 in order to interpret the experimental results.
II Experimental Details
The excited states of 146Eu have been populated from the EC decay of 146Gd (t1/2 = 48 days), produced via 144Sm (, 2n) reaction with 32 MeV alpha beam from K=130 AVF Cyclotron at Variable Energy Cyclotron Centre, Kolkata. The 144Sm targets with a thickness of 300 g/cm2 were prepared on 6.84 mg/cm2 Al foils by electro-deposition method using 93.8 enriched Sm2O3. The enriched sample contained 147Sm (2.06), 148Sm (1.00), 149Sm (0.95), 150Sm (0.41), 152Sm (1.05) and 154Sm (0.73) isotopes as impurity. The theoretical cross sections for different nuclei produced in the reaction were estimated by using the code PACEIV gavron . The 146Gd nuclei produced from the above reaction were recoil-implanted on Al catcher foils (6.84 mg/cm2) for the subsequent measurements. The Al catcher foils containing 146Gd activity were dissolved in acid solution which was subsequently used for coincidence and lifetime measurements. The irradiated target was counted on a 50 HPGe detector for the measurements of singles and decay half lives. In this measurement, the target was kept at a distance of 15 cm from the detector to ensure a dead time less than 10 and hence to minimise the summing effect. A Canberra Digital System was used for biasing, pulse processing and data collection of the 50 HPGe detector. The coincidence data were acquired with a setup (called as ‘Ge-setup’ later on in this paper) consisting of one 10 single HPGe detector and a segmented Low Energy Photon Spectrometer (LEPS), kept at an angle of 180∘ with respect to each other. Another setup (called as ‘LaBr3-setup’ later on in this paper) consisting of two 30 mm x 30 mm LaBr3 (Ce) detectors was used for the measurement of lifetimes. In this setup, one detector was used as ‘START’ detector and the other detector, kept at 180o with respect to the ‘START’ detector, was used as the ‘STOP’ detector. Time to Amplitude (TAC) signal was generated from these two detectors for the subsequent measurements. In both the coincidence setups, used for coincidence (Ge-setup) and lifetime measurements (LaBr3-setup), 8K ADC and CAMAC based data acquisition system were used for collecting the zero suppressed list mode data with LAMPS lamps software. The absolute efficiency of all the HPGe and LEPS detectors were determined by using calibrated 152Eu and 133Ba sources.
III Data Analysis and Results
The data analysis has been performed for the measurements of (i) decay half lives with the 50 HPGe detector, (ii) coincidence using Ge-setup and (iii) lifetime using LaBr3-setup. The detailed procedures have been discussed in the following subsections along with the obtained results.
III.1 Decay measurements and coincidence measurements
The singles spectra acquired with the 50 HPGe detector, for a duration of 48h in each run and at definite time intervals, have been studied for the assignment of rays in the level scheme of 146Eu. The counting was performed after allowing a significant cooling time in order to exclude the contribution from the short-lived activities in the decay spectrum. All the rays observed in the total spectrum are shown in FIG. 1 and the rays, relevant to the level scheme of 146Eu, were studied for the decay half lives. These data were also used for the measurement of energy and intensity of the transitions. The rays observed in the total spectrum can be classified in four categories, viz., (i) the rays from the decay of 146Gd (48d), (ii) rays produced from the decay of 146Eu (5d), (iii) rays from the decay of 147Eu(24d) and 149Gd (9.4d) produced in the reaction and (iv) the background and few unidentified rays. The rays of latter three categories were not considered in the present work. The decay plots for the relevant rays are shown in FIG. 2.


The coincidence information has been derived from the data taken with the Ge-setup using 146Gd activity in acid solution as discussed in section II. The gates were placed on 114.06, 114.88, 153.86, 267.02 and 268.96 keV transitions in the spectrum of LEPS detector (shown in FIG. 3) and the projected spectra obtained in the 10 HPGe detector are shown for different combinations in FIG. 4 and 5.


In the present work, only 114.06, 114.88, 153.86, 267.02 and 268.96 keV transitions were observed both in the coincidence as well as singles data. It is observed that 114.06 keV and 114.88 keV transitions are in coincidence with one another and also in coincidence with the 153.86 keV transition. The 229.4 keV transition is observed only in the gate of 153.86 keV but not in the gates of 114.06 and 114.88 keV transitions. The 268.96-keV transition has been observed only in the gate of 114.06 keV but not in 114.88 and 153.86 keV gates. The overlapped spectra of 267.06 and 268.96 keV transitions show that only 114.06 keV is present in the 268.96 keV gate whereas both the 114.06 and 114.88 keV transitions are present in the 267.06 keV gate. The aforesaid observation is also supported with the fact that the FWHM value for the peak obtained in the 267.06 keV gate is higher than that obtained in 268.96 keV gate. From these observations, the placements of the 114.06, 114.88, 153.86 and 267.06 keV gamma rays were confirmed. The measured half lives of 229.4 and 268.86 keV transitions in the present work rule out the possibility of these two transitions to be originated from the summing effect. Hence, the 229.4 keV and 268.86 keV transitions were included parallel to the 114.06-114.88 keV and 114.88-153.86 keV cascades respectively, as evident from their coincidence data and decay half lives explained above. The 420.88 and 575.24 keV rays were observed in the singles data and their half lives confirm their placement in the level scheme. There was no indication of the 76 keV and 383 keV rays, either in the coincidence data or in the singles data, and hence these two transitions were not placed in the present level scheme. The 84.01, 276.57 and 627.35 keV gamma rays have been observed in the singles data of the present work and show the half lives of 48d. The first two transitions, viz. 84.01 and 276.57 keV, are reported to be produced from the decay of the 235 s isomer as well as from the heavy ion fusion evaporation work b10 . Again these two rays are reported to be present in the 14-276-84-276 keV cascade according to the adopted level scheme of the nucleus. Between the two placements of the 276 keV transition, as decided by the above cascade, the one feeding the 84 keV ray is reported to be decaying from the 647.5 keV level. However, the strongest transition decaying from this 647.5 keV level is 358 keV which was not found to exist in our data. Hence, the second 276 keV transition is not originated from the EC decay of 146Gd and is not considered in the present decay scheme. Again, the calculated intensity of the 627.35 keV transition comes out to be equal to that of 276.57 keV transition. This observation suggests that the 627.35 keV transition is the one which is reported as 624.5 keV nndc decaying from the 914 keV level (modified as 918.5 keV level in the present work). Hence, it is concluded that the 918.5 keV level is produced from the EC decay of 146Gd and then feeds the 14.57-276.57-627.35 keV cascade. A very high value of intensity ( 12) for the 84.01 keV transition does not support it to be feeding the 276 keV ray which subsequently feeds the 14 keV level. This observation, along with the similar intensity of 627.35 and 276.57 keV transitions as explained above, does not incorporate the 84.01 keV transition in the decay scheme. Based on all these information, the decay scheme of 146Gd has been modified considerably and shown in Fig. 6.

The energy and absolute intensity of the rays belonging to 146Eu have been calculated from the singles measurement with 50 HPGe detector and indicated in TABLE 1. While calculating the intensities, it has been considered that the intensities of the 14.57, 114.06, 229.4 and 420.88 keV transitions, feeding the ground state of 146Eu, add up to 100. Due to the fact that the 114.06 and 114.88 keV peaks could not be separated, the combined intensity of these two transitions was calculated from the total area obtained in the singles data. This total intensity has been distributed among these two energies according to the following equations by considering that no direct EC decay is feeding the 114.06 keV level.
and
The ratio of intensity for 114.06 keV to that for 114.88 keV transition has also been verified from the total spectrum obtained in one segment of the LEPS detector as the two peaks could be separated with this detector. The intensity of the 14.57 keV transition has been considered to be equal to that of 627.35 keV as discussed above. However, the intensity of this transition is much smaller than that of 114.06 keV and lies within the error limit. The normalised intensities have been used in order to develop the decay scheme of 146Gd ground state to different levels of 146Eu as shown in Fig. 6. The logft values have been calculated from the LogFT calculator of NNDC nndc-1 for different EC decays and are shown in TABLE 1. These values are in accordance with the existing assignment of Jπ values for the states populated in 146Gd decay. The spin parity of all the states was thus kept unchanged with respect to the adopted decay scheme nndc except the 918.5 keV level which has been assigned to a Jπ value of 2-. The obtained half lives, relevant to identify the rays involved in the decay of 146Gd, are also shown in the same TABLE 1.
| 111Only statistical errors in energies are considered. | %222The errors in the efficiencies and area under the photopeaks were considered for calculating the error in the intensities. For low energy transitions conversions coefficients were considered. The values of the coefficients were obtained for the Bricc calculator of NNDC. | half life(d) | Ec feeding () | Logft333The Logft values were calculated from the LogFT calculator of NNDC. | ||||
|---|---|---|---|---|---|---|---|---|
| 14.6 | 14.6 | 0.075(11) | - | - | - | |||
| 114.1 | 114.060.05 | 99.64 3.21 | 48.300.31444As the 114 and 115 keV peaks could not be separated in the spectrum obtained with the 50 HPGe detector, both the peaks were considered while calculating the half life. | - | ||||
| 229.4 | 114.880.05 | 98.74 3.18 | 48.300.31 | 32.63 | 7.8 | |||
| 383.3 | 153.860.01 | 66.16 1.02 | 48.940.64 | 66.52 | 7.3 | |||
| 229.4 | 229.400.03 | 0.188 0.009 | 45.835.60 | 32.63 | 7.8 | |||
| 496.4 | 267.020.08 | 0.151 0.029 | 45.119.16 | 0.151 | 9.7 | |||
| 383.3 | 268.960.06 | 0.335 0.027 | 53.475.15 | 66.52 | 7.3 | |||
| 291.1 | 276.570.08 | 0.067 0.007 | 42.469.99 | - | - | |||
| 420.9 | 420.880.09 | 0.099 0.011 | 40.636.30 | 0.099 | 10 | |||
| 689.3 | 575.240.05 | 0.090 0.008 | 45.129.16 | 0.090 | 9.5 | |||
| 918.5 | 627.350.07 | 0.0750.011 | 64.162.99 | 0.075 | 8.4 |
III.2 Lifetime Measurement
The lifetime of the excited levels of 146Eu was measured following the mirror symmetric centroid difference (MSCD) method proposed by Regis et al regis . The conventional centroid shift method mach1 ; mach2 is limited by the fact that the prompt reference curve depends on the gamma ray energy. In case, the prompt references are not known or can not be extended for the gamma rays of interest with the standard sources, the Compton-Compton events are used for generating the prompt curves. Because of the inherent delay between a Compton-Compton and a photopeak-photopeak coincidence event, added up with other spurious events, such prompt curves are shifted significantly from the true prompt line and affect the measurements of lifetimes few ps mach2 . Whereas, in MSCD method, the lifetime can be derived as a function of the energy difference between the two gamma rays which are feeding to and decaying from the level of interest. Due to this fact, the MSCD technique allows the use of both the photopeak-photopeak and Compton-Compton events for the generation of prompt curves. Following the conventional centroid shift method the lifetime of a specific branch is given by,
| (1) |
where C(D)start and C(D)stop are the TAC centroids of the delayed coincidence when references are taken from start detector and stop detector respectively. C(P)start and C(P)stop are similar TAC centroids for the prompt coincidences obtained from a prompt reference source. The C(P)start (or C(P)stop), obtained by varying the energy gates in the stop(or start)detector, generates the prompt reference curve when plotted as a function of those energy values. The corresponding centroid of the level of interest ( C(D)start or C(D)stop ) is shifted from the prompt reference curve by the level lifetime (). Whereas, the MSCD technique modifies this centroid shift method in the following way:
| (2) | |||||
In this technique, the Prompt Reference Distribution (PRD) is generated from the plot of C(P) against the (difference in the energies between one feeding to and that decaying from a prompt level) using a prompt source, as explained in ref. regis . For a particular value of , the C(D), obtained from a delayed source, is shifted by twice the lifetime of the level of interest (2) from the PRD curve as explained in the equation 2.
In this work the LaBr3-setup was used for the measurement of lifetimes of first 3- and 2- levels of 146Eu. Temperature stability was maintained in the experimental area to ensure a steady timing electronics. The 60Co prompt source was used to generate the PRD curve and the accuracy of our experimental setup was established with the measurement of 32.4 ps lifetime for the 344.2 keV level of 152Gd produced from the decay of 152Eu source. The 344.2 keV level decays by a 344.2 keV ray to the ground state of 152Gd and is fed by several rays as known from its adopted level scheme nndc-gd152 . The PRD curve was generated by using the Compton profile of the 60Co source with the reference energy gate at 344 keV in the ‘START’ (‘STOP’) detector. In the ‘STOP’ (‘START’) detector, a 10 keV wide energy gate was selected in the Compton profile of 60Co source at 10 keV intervals. The different coincident photopeaks of 152Gd have been projected (shown in FIG. 7) in the spectrum of ‘START’ detector by putting gate at 344 keV in the 180∘ ‘STOP’ detector. Due to the desired energy resolution of the LaBr3(Ce) detector, all the peaks could be clearly identified. The TAC spectra were obtained with the gate at 344 keV photopeak in the 180∘ ‘STOP’ detector and the gates at the other photopeaks, in coincidence with 344 keV, given in the ‘START’ detector. Some of these TAC spectra are shown in FIG. 8 in order to envisage the dependence of the TAC centroid on the energy. Similar TAC spectra were obtained with the 344 keV gate at the ‘START’ detector and other photopeaks at the ‘STOP’ detector. The difference in the TAC centroids obtained by interchanging the ‘START’ and ‘STOP’ energy gates is shown in FIG. 9 with a special reference to the 411-344 and 778-344 keV cascades. The similar differences in the TAC centroid were also obtained for the other cascades of 152Gd and have been utilized for the measurements of the lifetime of 344.2 keV level.


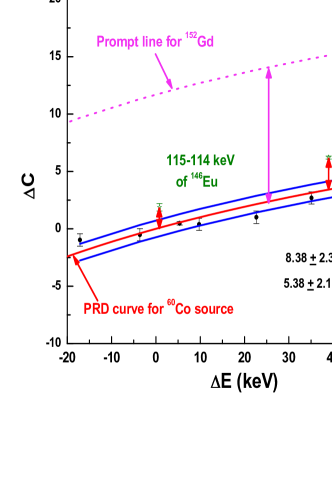
The PRD curve, generated with the 60Co source, is shown in FIG. 10 and fitted with a function , where a and b comes out to be 18.960.145 and 177.3 2.39 respectively.

The fitted curve is shown with red solid line. The two blue lines above and below the red PRD line represent the positive and negative error limits of the PRD curve respectively. The limits have been considered to be the standard deviation of the experimental data points from the fitted PRD line. It is observed that the prompt curve can be determined within a limit of 4.35 ps on an average for the positive E values. The C values obtained for 411-344 and 586-344 cascades of 152Gd are also shown in the same figure. The shift of these data points from the PRD curve gives = 35.26 2.75 ps, which is in well agreement with the literature value ( 32.4 1.7 ps ) nndc-gd152 for the lifetime of 344 keV level of 152Gd. After the lifetime for the 344 keV level of 152Gd was reproduced satisfactorily, the similar centroid differences were also obtained for the level of 146Eu and shown in Fig. 10. The 114.06-114.88 and 114.88-153.86 keV cascades were used for deducing the lifetimes of first 3- and 2- states of 146Eu respectively. In FIG. 11, the values obtained for the 146Eu are shown with respect to the PRD curve of FIG. 10, in an expanded scale. The centroid differences and the corresponding lifetimes for the relevant cascades of 152Gd and 146Eu are furnished in TABLE 2. The lifetime for 344 keV level of 152Gd measured in the present work matches satisfactorily with the value obtained from the latest compilation in Nuclear Data Sheets nndc-gd152 . In case of first 3- and 2- states of 146Eu, the present study removes the limits nndc by assigning lifetime values within an acceptable error.
| Nucleus | Cascade | C | PRD | (ps) | Lit. value |
|---|---|---|---|---|---|
| (present work) | |||||
| 152Gd | (411-344) | 17.11 | 5.21 | 35.712.29 | 32.41.7 nndc-gd152 |
| (586-344) | 22.54 | 10.94 | 34.782.40 | ||
| 146Eu | (115-114) | 1.88 | 0.087 | 5.382.36 | 0.16ns nndc |
| (154-115) | 6.21 | 3.42 | 8.382.19 | 0.2ns nndc |
IV Shell Model Calculation
A large basis shell model calculation was performed using the code OXBASH BAB94 in order to characterize the low-lying states of 146Eu. The calculation considered 132Sn as core and thirteen protons distributed over the model space comprising of (1, 2, 2, 3) single particle orbitals along with one neutron over the 1 single particle orbital. The calculations were carried out using proton-neutron formalism in full particle space. The two-body matrix elements were obtained from the well-known interaction supplied with the source code of OXBASH. This interaction is basically a combination of , and interaction files which are also supplied with the code. The TBMEs were obtained by Brown et al. brown88 by a 5-parameter fit to interaction hosaka potential for N=82 core and the corresponding NN TBMEs were obtained in the same way but by excluding the Coulomb interaction. The bare matrix from the was used for the PN TBMEs. In our calculations, we have truncated the neutron space to contain only orbital as well as the proton space by excluding the . In the interaction, the neutron single particle energies (SPEs) were chosen to give the -7.48 MeV energy difference betwen 147Gd and 146Gd as well as to best reproduce the excitation energies of , and states in 149Dy spectrum. The proton SPEs were obtained from the potential fit as mentioned above.
TABLE 3 shows calculated excitation energies of the negative parity states
up to the level at 383.3 keV along with the theoretical
and experimental lifetimes and the major configuration of the states.
The lifetime values have been determined from the reduced transition probabilities obtained from the calculation for different excited states of 146Eu. A remarkable agreement for the energies and lifetimes is noticeable.
It is also noticeable that the major contribution to the structure of the
states comes from the and orbitals which constitute
the 146Gd core ground state.
| Jπ | Elevel | Lifetime | Configuration | ||
|---|---|---|---|---|---|
| (keV) | (ps) | ||||
| (expt) | (th.) | (expt) | (th.) | ||
| 0.0 | 0.0 | - | - | [] | |
| (82) | |||||
| + [] | |||||
| (12.3) | |||||
| + [] | |||||
| (4.1) | |||||
| 14.57 | 16.0 | - | - | [] | |
| (77.3) | |||||
| + [] | |||||
| (15.2) | |||||
| 114.06 | 115 | 5.382.36 | 5.4 | [] | |
| (62.7) | |||||
| + [] | |||||
| (20) | |||||
| + [] | |||||
| (11.5) | |||||
| 229.4 | 232 | 8.382.19 | 3.04 | [] | |
| (63.8) | |||||
| + [] | |||||
| (34.3) | |||||
| 290.6 | 276 | - | - | [] | |
| (98.4) | |||||
| 383.3 | 385 | - | - | [] | |
| (82) | |||||
| + [] | |||||
| (13.3) | |||||
| + [] | |||||
| (10.7) | |||||
V Discussion
The decay spectroscopy of 146Gd nucleus has been performed using the light ion beams from Variable Energy Cyclotron Centre to study the low lying structure of the odd odd 146Eu nucleus. The low lying excited levels of this nucleus have been considerably modified from the singles decay and coincidence measurements. The present study assigns new levels in the decay of 146Gd and confirms two crossover transitions of 229.4 and 268.96 keV in the level scheme of 146Eu.
The lifetimes of the first 3- and 2- levels of 146Eu have been measured to be 5.38 2.36 and 8.38 2.19 ps respectively following the Mirror Symmetric Centroid Difference technique using LaBr3(Ce) detectors. Till date the literature values for the lifetimes of these two states provide only the limits while the present study assigns definite lifetime values with an acceptable error. A Shell model calculation has been performed using OXBASH code considering 132Sn as a core nucleus. The theoretical calculation agrees remarkably well with the experimental data. The level spectra and the lifetime values of the first two excited states along with the shell mode calculation establish the near spherical structure of 146Eu vis a vis the validity of Z = 64 subshell closure for N = 82 closed shell nuclei.
VI Acknowledgement
The authors acknowledge the efforts of the operators of K=130 Cyclotron of Variable Energy Cyclotron Centre for providing a good quality beam. The valuable suggestions from Dr. S. K. Basu is gratefully acknowledged. One of the authors (Mr. T. Malik) is thankful to Head, Physics Group, VECC and Head of the Department, Department of Applied Physics, Indian School of Mines, for allowing him to carry his winter project in VECC during the period Decemeber 2012 to January 2013. The authors acknowledge the sincere efforts of Mr. R. K. Chatterjee who have assisted meaningfully in target preparation. The authors have been highly benefitted by the presence of Dr. H. Pai, Mr. P. Mukhopadhyay and Mr. A. Ganguly in maintaining Ge detectors during the experiment.
References
- (1) A. Chakraborty et al., Phys. Rev. Lett. 110, 022504 (2013).
- (2) S. N. Liddick et al., Phys. Rev. Lett. 92, 072502 (2004).
- (3) P. E. Garrett et al., Phys. Rev. Lett. 103, 062501 (2009).
- (4) P. Kleinheinz, Prog. Part. Nucl. Phys. 28, 369 (1992).
- (5) H. Kader et al.,, Phys. Lett. B227, 325 (1989).
- (6) Zs. Podolyk et al.,, Phys. Rev. C64, 034302(2001).
- (7) S. Bhattacharyya, et al., Phys. Rev. C65, 027301 (2002).
- (8) Tumpa Bhattacharjee et al., Nucl. Phys A750, 199 (2005).
- (9) H. Mach, R.L. Gill and M. Moszynski, Nucl. Instr. & Meth. in Phys Res A280, 49 (1989).
- (10) H. Mach et al., Nucl. Phys. A523, 197 (1991).
- (11) J.-M. Re´gis et al., Nuclear Instr. & Meth. Phys. Res., A622 83 (2010).
- (12) T. Alharbi, et al., Phys. Rev. C87, 014323 (2013).
- (13) P. Kleinheinz et al., Z. Phys. A290, 279 (1979).
- (14) L. K. Peker and J. K. Tuli, Nucl. Data Sheets 82, 187 (1997).
- (15) L. Holmberg et al., Z. Physik 257, 101 (1972).
- (16) R. Kantus, U. J. Schrewe, and W. -D. Schmidt-Ott Phys. Rev. C23, 1274 (1981).
- (17) A. Ercan et al., Z. Physik A295, 197 (1980).
- (18) A. Ercan et al., Z. Phys. A329, 63 (1988).
- (19) E. Ideguchi et al., Eur. Phys. J. A6, 387 (1999).
- (20) H. Langevin-Joliot et al., Phys. Rev. C38, 1168 (1988).
- (21) A. Gavron, Phys. Rev. C21, 230 (1980).
- (22) http://www.nndc.bnl.gov/logft/
- (23) B. A. Brown et al., the computer code OXBASH, MSU-NSCL Report No. 524 (1994).
- (24) www.tifr.res.in/lamps.
- (25) Agda Artna-Cohen, Nucl. Data Sheets 79, 1 (1996).
- (26) B. A. Brown and B. H. Wildenthal, Ann. Rev. Nucl. Part. Sci. 38 29 (1988).
- (27) A. Hosaka, K.-I. Kubo, H. Toki, Nucl Phys. A444, 76 (1985).