Cold gas in the inner regions of intermediate redshift clusters ††thanks: Based on observations carried out with the IRAM Plateau de Bure Interferometer. IRAM is supported by INSU/CNRS (France), MPG (Germany) and IGN (Spain).
Determining the nature and modes of star formation at galactic scales requires an understanding of the relationship between the gas content of a galaxy and its star formation rate. Remarkable progress has been made in understanding the conversion mechanisms in field galaxies, but the cold and dense gas fueling the star formation has been much less investigated in galaxies inside clusters. We present the first CO observations of luminous infrared galaxies (LIRGs) inside the virial radii of two intermediate redshift clusters, CL1416+4446 (z=0.397) and CL0926+1242 (z=0.489). We detect three galaxies at high significance (5 to 10 ), and provide robust estimates of their CO luminosities, L′CO. In order to put our results into a general context, we revisit the relation between cold and hot gas and stellar mass in nearby field and cluster galaxies. We find evidence that at fixed LIR (or fixed stellar mass), the frequency of high L′CO galaxies is lower in clusters than in the field, suggesting environmental depletion of the reservoir of cold gas. The level of star formation activity in a galaxy is primarily linked to the amount of cold gas, rather than to the galaxy mass or the lookback time. In clusters, just as in the field, the conversion between gas and stars seems universal. The relation between LIR and L′CO for distant cluster galaxies extends the relation of nearby galaxies to higher IR luminosities. Nevertheless, the intermediate redshift galaxies fall well within the dispersion of the trend defined by local systems. Considering that L′CO is generally derived from the CO(1-0) line and sensitive to the vast majority of the molecular gas in the cold interstellar medium of galaxies, but less to the part which will actually be used to form stars, we suggest that molecular gas can be stripped before the star formation rate is affected. Combining the sample of Geach et al. (2009, 2011) and ours, we find evidence for a decrease in CO towards the cluster centers. This is the first hint of an environmental impact on cold gas at intermediate redshift.
Key Words.:
galaxies: clusters: general – galaxies: evolution – galaxies: formation – galaxies: interactions – galaxies: starburst1 Introduction
It has long been known from optical observations that galaxy properties change with time, and that they also change systematically with the galaxy environment. Observed trends include morphological transformations (e.g., Dressler, 1980; Desai et al., 2007) and signatures of star formation such as broadband colors (e.g., Butcher & Oemler, 1984). Dusty star forming galaxies, best investigated in the infrared, contribute significantly more to the integrated cluster star formation rate (SFR) than do the optically selected blue galaxies. For example, the SFRs derived from [OII] are 10 to 100 times lower than the rates estimated from IR luminosities (e.g., Duc et al., 2002; Geach et al., 2009b). Because clusters hardly contain any ULIRGs, galaxy evolution must be traced with LIRGs (Log(LIR/L⊙) 11; Finn et al., 2010; Wardlow et al., 2010). From Spitzer MIPS 24 m data, Saintonge et al. (2008) and Finn et al. (2010) could establish that the fraction of LIRGs declines exponentially with time both in the field and in clusters, however the LIRG fraction in clusters lies significantly below the fraction in the field at all epochs. Haines et al. (2009) found that intermediate redshift LIRGs are preferentially located at large cluster-centric radii; they interpret their observations as a combination of both the global decline in star formation in the universe since z1 and enhanced star formation in the infall regions of clusters.
The relationship between gas content and star formation rate is necessary to understand the nature and modes of star formation at the galactic scale. Remarkable progress has been made toward understanding the conversion mechanisms in field galaxies (Wong & Blitz, 2002; Bigiel et al., 2008; Daddi et al., 2010; Genzel et al., 2010; Tacconi et al., 2010; Combes et al., 2011).
Conversely, the cold and dense gas fueling the star formation has hardly been investigated in clusters, despite their exceptional opportunities for cosmological studies. The Coma supercluster and Virgo Cluster are the only sites of investigation (e.g., Kenney & Young, 1989; Rengarajan & Iyengar, 1992; Boselli et al., 1997; Casoli et al., 1998; Lavezzi & Dickey, 1998; Scott et al., 2013). For the largest sample of more distant cluster galaxies, Geach et al. (2009a, 2011) measured CO in the outskirts (1.53 R200 where encloses an average density of 200 times the critical density and roughly corresponds to the virial radius) of CL0024+16 (=911km/s, z=0.395). Notably, no CO measurements existed inside the virial radius of distant clusters before now. Observations of galaxies covering a wide radial range can help distinguish the various physical processes expected to play a role, e.g. ram-pressure stripping (interaction with the intergalactic medium), strangulation (removal of any envelope of gas), tidal interactions, and mergers, because these processes peak in effectiveness at different clustercentric radii (De Lucia, 2010; Moran et al., 2007). How, when, and where they affect the evolution of galaxies has still to be explored.
This paper reports on the first CO observations of galaxies located within R200 of two intermediate redshift clusters. Section 2 starts by synthesizing the comparison between local field and cluster galaxies. Section 3 presents our observations obtained with the IRAM PdBI, while Sect. 4 discusses our results. We summarize our work in Sect. 5.
2 Where do we stand ? The case of the local samples
Historically, the question of the effect of the environment onto star forming galaxies has been framed in terms of a possible correlation between an observed depletion in HI and the corresponding lower CO content in cluster galaxies. Haynes & Giovanelli (1984) showed a strong correlation between the HI mass of spiral galaxies and their optical size, independent of their exact Hubble type. This correlation is interpreted as providing the normal neutral gas content of a galaxy in the absence of environmental effects. Any difference between the above fit and the observed mass of HI in a galaxy is called deficiency (although note that the dispersion around the mean trend is not negligible).
In the challenging route to understanding whether molecular gas can be stripped in a similar way HI is, there are con- and pro-, all based on studies in the local Universe. The persistence of publications on this topic suggests that one has not yet convincingly solved and/or quantified the question either way.
Kenney & Young (1989) and later Rengarajan & Iyengar (1992) analyzed the molecular and atomic gas properties of galaxies in Virgo and found evidence for stripping in CO, although at lower rate than in HI (2 versus 10 in deficiency). The Coma supercluster has given rise to a long series of studies, several of which report no difference in CO content between field and supercluster galaxies nor any variation linked to HI (Casoli et al., 1991, 1996, 1998; Boselli et al., 1997). However, recent evidence for ram-pressure stripping of CO was found in Virgo and in Abell 1367, one cluster of the Coma supercluster (Vollmer et al., 2008; Scott et al., 2013), although the frequency of this phenomenon seems low (Vollmer et al., 2012). Lavezzi & Dickey (1998) investigated 11 nearby clusters and found no variation of the ratio M(H2)/M(HI) with clustercentric distance, whereas the LFIR/ M(H2) decreases towards the cluster center, suggesting higher star formation efficiency at the cluster periphery. However their distances were not scaled to the cluster structural parameters (e.g., the virial radius) that could play a significant role given the large dispersion in cluster properties (e.g., velocity dispersions ranging from 1200km/s to 300km/s). It is difficult to reconcile the above discrepant conclusions. Possible explanations include small sample sizes, different levels of star formation activity, differing statistical methods, and questionable normalization of the gas masses (e.g., D25 works well for HI but is less secure for H2).
In the following, we attempt to determine environmental effects by focusing on the link between the intensity of star formation (as traced by the galaxy total far infrared luminosity, LIR) and the galaxy reservoir of molecular gas (as indicated by the luminosity in CO, L′CO).
We compiled datasets from the literature with IR and CO observations. We restricted our analysis to rather massive galaxies (L L⊙ ) in which the metallicity is sufficiently high to ensure that CO reliably traces H2. Our field sample comprises the FCRAO Extragalactic CO Survey, log(LIR/L⊙) [8.9,11.6], zmedian=0.0046 (Young et al., 1995), the Galex Arecibo SDSS Survey (GASS), log(LIR/L⊙) [9.7,11.2], zmedian=0.03, (Saintonge et al., 2011), the Nobeyama CO Atlas of Nearby Spiral Galaxies, log(LIR/L⊙) [9.2,11.2], zmedian=0.002, (Kuno et al., 2007), the BIMA survey, log(LIR/L⊙) [8., 11.2], zmedian=0.002, (Helfer et al., 2003), and the observations of Gao & Solomon (2004), log(LIR/L⊙) [9.9,12.5], zmedian=0.007, and García-Burillo et al. (2012), log(LIR/L⊙) [11.,11.9], zmedian=0.015, whereas for our cluster galaxies, we gathered the galaxy samples of Kenney & Young (1989) in Virgo, log(LIR/L⊙) [9.,10.3], Lavezzi et al. (1999), log(LIR/L⊙) [10.,11.3], and Casoli et al. (1991), log(LIR/L⊙) [9.9,11.1],in Coma, the collection of clusters and groups of the Pisce-Perseus and the Coma/A1367 super clusters from Lavezzi & Dickey (1998); Boselli et al. (1997); Scott et al. (2013), log(LIR/L⊙) [9.,11.]. From the GASS sample, we distinguished galaxies in groups (defined as 10 members at the same spectroscopic redshift) from galaxies in isolation using the work of Tempel et al. (2012). Similarly the Nobeyama survey encompasses galaxies located in Virgo, and the BIMA survey have some in the Ursa Major cluster, which were added to the cluster sample, and finally the isolated galaxies of Boselli et al. (1997) were attached to our field sample. In total, we gathered 275 field and 170 cluster galaxies for which we could collect both reliable far infrared fluxes and CO luminosities.
For the sake of homogeneity, we revised the distances of all galaxies: we use the redshift-independent indicators provided in NED for the most nearby galaxies and we calculate the luminosity distance from the redshifts of the remaining galaxies (assuming =0.3, = 0.7, h =0.70). For all samples except GASS, the far infrared fluxes have been derived from the IRAS bands as follows:
FIR=1.81014(13.48f12 + 5.16f25 + 2.58f60 + f100) [W.m-2], (Sanders & Mirabel, 1996). L′CO is defined as in (Solomon & Vanden Bout, 2005).
For the GASS sample, we restrict our analysis to the 164 galaxies with measured CO fluxes (discarding those with only upper limits). Out of this sample, 26 galaxies have measured IRAS IR fluxes, while 102 galaxies have WISE 22m observations. We derive the total IR luminosity of the WISE-detected galaxies using their mid-IR fluxes, as measured in apertures corresponding to their 2MASS major axes. Jarrett et al. (2013) showed that fluxes measured in the WISE 22m and in the Spitzer 24m bands are equivalent. Therefore, we used the relation of Rieke et al. (2009) between L(24) and L(TIR). We note that for all galaxies with both WISE and IRAS IR luminosities (both the GASS sample and the other studies described above), there is a one to one correspondence (with small dispersion) between the IR luminosity estimates.
When necessary (e.g., when the antenna beam sizes were smaller than the galaxies and no mapping is available), the CO fluxes were aperture-corrected following Young et al. (1995), i.e., assuming an exponential spatial distribution of CO, with a scalelength of a tenth of D25, the galaxy diameter. The mean of the corrective factors is 1.17, with a median at 1.08 and a maximum at 1.8.
We intentionally report our results in terms of luminosity rather than masses and star formation rates, in order to free ourselves from the uncertainties in conversion factors.
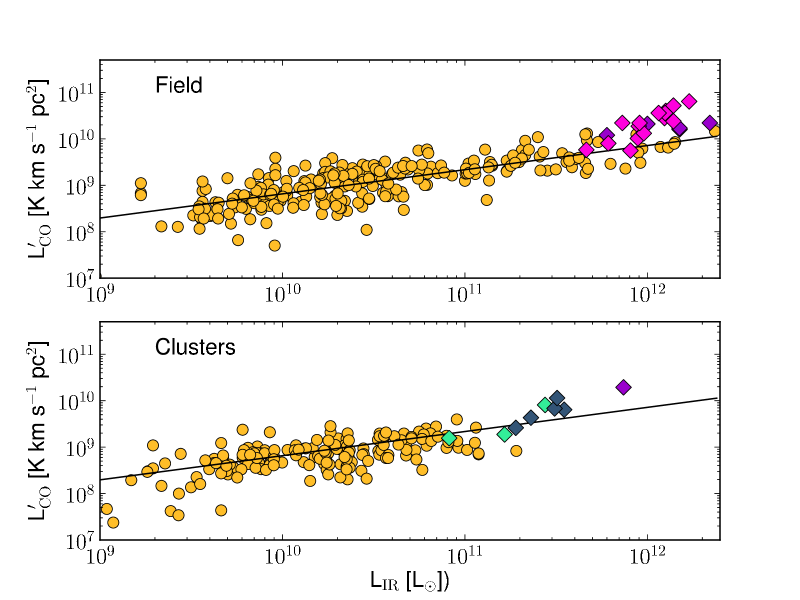
Before describing our new observations of galaxies in moderate-redshift clusters, we first compare field and cluster galaxies at low redshift. Figure 1 displays the relation between LIR, and L′CO for our compilation of field and cluster galaxies. We fit the relation between LIR and L′CO over the full range 109-1012: L⊙. log10(L′CO) = 0.52log10(LIR) + 3.61, very close to the relation of (Solomon & Vanden Bout, 2005).
At fixed LIR, the cluster galaxies are down-shifted compared to the system in the field, suggesting that for a given star formation rate, the reservoir of cold gas is smaller in cluster galaxies.
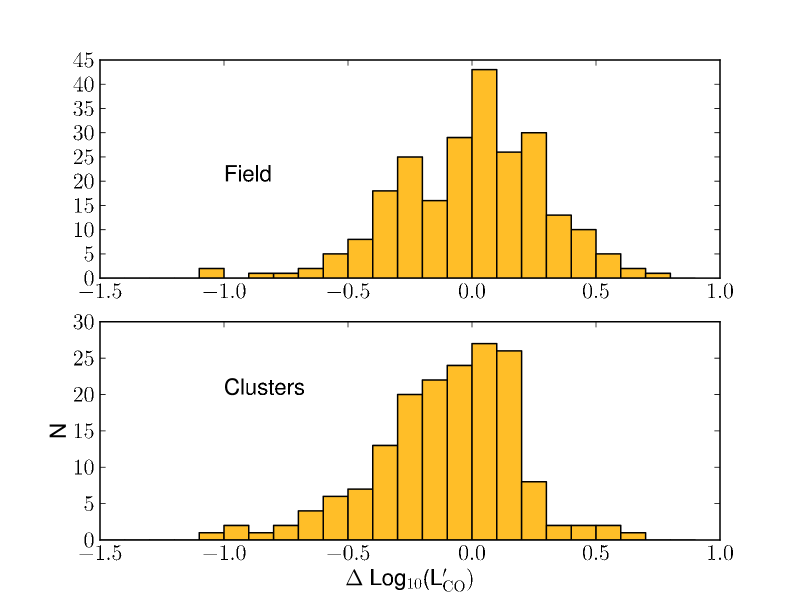
Figure 2 shows the residuals of the observed CO luminosities from the best-fit LIR-L′CO relation of field galaxies (restricted to the 237 galaxies in with infrared luminosities between 109 and 1012 L⊙). Figure 2 illustrates the difference between the cluster and field samples: while field galaxies can have CO luminosities as small as cluster galaxies, the latter are essentially never as luminous in CO as field galaxies with similar infrared luminosity. A Kolmogorov-Smirnov test rejects the null hypothesis (samples are drawn from the same distribution) with a probability (p-value) of much less than 1% that the null hypothesis is valid.
We estimate the stellar masses (M⋆) of 231 field and 137 cluster nearby galaxies with available SDSS colors and/or 2MASS J, H and K-bands data using the code Fitting and Assessment of Synthetic Templates (FAST, Kriek et al., 2009). We assumed a Chabrier IMF, a solar metallicity, an exponentially decaying star formation rate and the Bruzual & Charlot (2003) synthesis models.
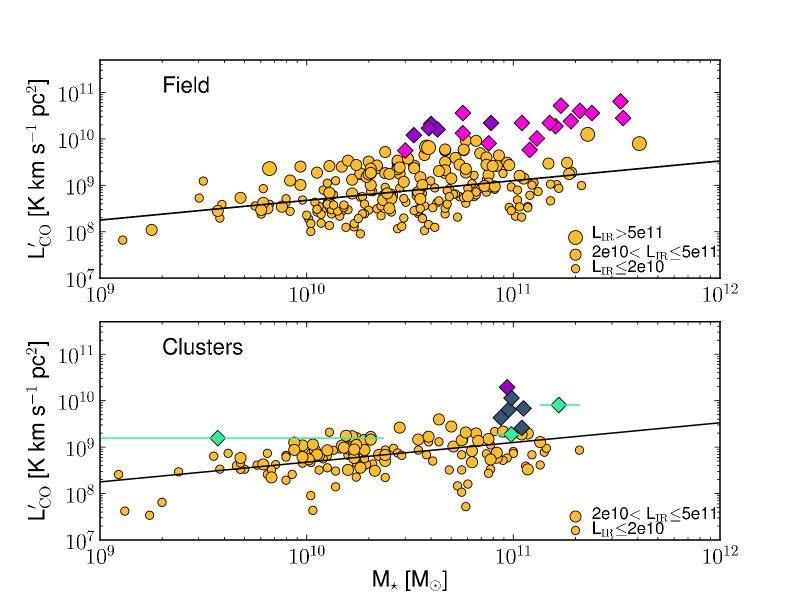
Fig. 3 shows the relation between stellar mass and CO luminosity. The fit of the relation between L′CO and M⋆ for the nearby field galaxies is shown in both panels. It is performed on galaxies with LIR 21011L⊙ to allow comparison between the clusters and the field. log10(L′CO) = 0.37log10(M⋆) + 5.04.
There is more scatter in the relation between mass and CO luminosity than between LIR and L′CO. We divide galaxies in three LIR ranges. The first threshold, 21010L⊙, closely corresponds to the median LIR of the nearby field galaxies, while the second threshold, 51011L⊙, correspond to the lowest LIR of the distant field galaxies. In an independent way, Fig. 3 confirms that CO luminous galaxies are more common in the field than in clusters. Only 7% of the cluster galaxies versus 20% of the field galaxies are found 0.3dex above the fit line. Moreover, as indicated by the clear segregation of galaxies as a function of LIR, one sees that the level of star formation activity is primarily linked to the amount of cold gas, rather than to the galaxy mass or redshift. Genzel et al. (2010) reached similar conclusions when they discussed a universal gas/star formation relation.
There are a few caveats to this result. First, although we attempted to homogenize all quantities (distances, aperture correction, luminosities, masses), our compilation is drawn from datasets acquired on from different telescopes and techniques across several years. Only two studies (Young et al., 1995; Gao & Solomon, 2004) span nearly the full range of infrared luminosities, and only the study of Kuno et al. (2007) contains enough galaxies in clusters and in the field allowing a direct comparison from identical observational conditions. Second, some galaxies do not have complete spatial CO coverage. Although in principle the aperture corrections are small, the exact form and the magnitude of this correction can significantly vary from one galaxy to another (Saintonge et al., 2011). Finally, optical parameters such as diameters may depend on what wavelength they are measured at and the details of the observations (e.g., CCD photometry versus photographic plates). Nevertheless, while systematics could affect the comparison between the samples, there is no evidence that these would affect the clusters more than the field.
Unfortunately, most of the nearby galaxies are at the latest stage of their evolution and the lowest point of their star forming activity: Finn et al. (2010) and Saintonge et al. (2008) have shown that the fraction of LIRGs declines exponentially with time both in the field and in clusters, hence hindering our ability to identify where and when the environment affects the evolution of the galaxies. This motivated our observing programme of intermediate redshift LIRGs.
3 Intermediate redshift clusters
3.1 The sample
One obstacle to determining the impact of environment on star formation at moderate redshift is that few cluster galaxies are classified as LIRGs or ULIRGs (e.g., Finn et al., 2010). We identified new cluster LIRGs among Spitzer and MMT/Hectospec observations of X-ray-selected clusters from the 400 square degree serendipitous survey (Burenin et al., 2007) that are included in the Chandra Cluster Cosmology Project sample (Vikhlinin et al., 2009). We analyzed Spitzer IRAC and MIPS observations of several clusters at to identify candidate LIRGs. We then use MMT/Hectospec optical spectroscopy (Rines et al. in preparation) to classify the LIRGs as cluster members or background galaxies.
For the pilot program described here, we selected two LIRGs LIRGs that lie inside the radius R200 of their clusters.
One target, GAL1416+4446, lies in CL1416+4446 (=0.397, projected velocity dispersion 750 km/s, M500= M⊙), at 0.82R200, with z. The second target, GAL0926+1242, was found in CL0926+1242 (=0.489, 810 km/s, M500=M⊙), at 0.38R200, with z. We estimate R200 by scaling R500 from the em Chandra mass estimate assuming an NFW profile (Navarro et al., 1997) with =5.
The projected radii of the galaxies may not fully reflect the genuine 3D positions of the galaxies. Though, GAL1416+4446 and GAL0926+1242-A/B have a fair to very high probability to be indeed located inside the virial radius of their parent clusters. Mahajan et al. (2011) break down the 3D locations of galaxies in and around a simulated cluster by both projected radius and projected velocity offset (their Table 2). GAL1416+4446 (0.5R200 r R200, vLOS/ ) fall in the bins for which 49% of galaxies have 3D radii within the cluster virial radius, while an additional 18% are part of the so-called “backsplash” population, i.e., galaxies that have passed inside R200 but are now further away. GAL0926+1242-A and -B (0 r 0.5R200, vLOS/ ) fall in the bins for which 89% of galaxies have 3D radii within the cluster virial radius. Thus, it is most likely that GAL0926+1242-A and -B and GAL1416+4446 have been subject to environmental effects.
Both CL1416+4446 and CL0926+1242 were observed with Spitzer/IRAC and MIPS at 3.6, 4.5, 5.8, 8 and 24 m. We used the 24 m fluxes of our two targets to estimate total infrared luminosities following the method of Finn et al. (2010). We find L⊙ (GAL1416+4446) and L⊙ (GAL0926+1242), equivalent to star formation rates of 45 and 38 M⊙/yr, respectively. These galaxies are the brightest confirmed cluster members in the far infrared among twelve CCCP clusters with =0.35-0.50. These galaxies were the brightest cluster members in the far infrared and the only ones at these flux levels.
We use two methods to exclude AGN activity as the source of the infrared emission in these galaxies. First, we determined that the IRAC colors of the galaxies are consistent with dust heated by star formation rather than AGN activity (Stern et al., 2005; Sajina et al., 2005; Pope et al., 2008). Second, none of our sources are detected by Chandra (luminosity limits, LX erg/s; Alexey Vikhlinin, private communication). Thus, the infrared luminosities of these spectroscopically confirmed members are dominated by star formation; they are neither X-ray sources nor mid-infrared AGN.
A close inspection of the CO map around GAL0926+1242 later revealed two actual emission peaks (Fig. 4). The Spitzer Source List includes a companion to our primary galaxy target, which was detected at shorter infrared wavelengths with IRAC. In the following text and in Tables 1, 2, and 3, we shall refer to GAL0926+1242-A as our primary target and to GAL0926+1242-B as the secondary serendipitous CO detection. Table 1 provides the coordinates, redshifts and clustercentric distances of the three galaxies. Table 2 summarizes the far infrared properties of our sample. In order to derive the total infrared luminosities of the two systems in CL 0926+124, we assumed the same flux ratios at 24 m as seen at 8 m (the two sources are blended at 24 m).
| Spitzer | HST | ||||||
| ID | Spitzer ID | RA | DEC | RA | DEC | z | dcenter |
| J(2000) | J(2000) | (R | |||||
| GAL1416+4446 | SSTSLP J141619.52+444357.1 | 214.081350 | 44.732533 | 0.3964 | 0.82 | ||
| GAL0926+1242-A | SSTSLP J092632.23+124213.0 | 141.634318 | 12.703622 | 09:26:32.26 | 12:42:11.72 | 0.4886 | 0.38 |
| GAL0926+1242-B | SSTSLP J092631.98+124212.5 | 141.633271 | 12.703498 | 09:26:32.05 | 12:42:12.36 | 0.4886 | 0.39 |
| ID | LIR | F24 | F3.6 | F4.5 | F5.8 | F8.0 |
|---|---|---|---|---|---|---|
| (1011L⊙) | (Jy) | |||||
| GAL1416+4446 | 2.75 | |||||
| GAL0926+1242-A | 1.65 | |||||
| GAL0926+1242-B | 0.82 | |||||
3.2 CO observations
We observed the cluster LIRGs with the IRAM PdBI on 2011 July (18, 23, 24) (CL 0926+1242) and 2011 November 8-9 (CL 1416+4446). The exposure times were 8h on both sources, using five antennae. The observing conditions were excellent in terms of atmospheric phase stability; however, any anomalous and high phase-noise visibilities were flagged. We benefited from 6 additional hours (March 28 & 29, April 6 & 9) in the form of director discretionary time for CL 0926+1242.
We calibrated, mapped and analysed the data using the IRAM GILDAS software (Guilloteau & Lucas, 2000). For CL 1416+4446, we targeted the CO(1-0) 115.27GHz rotational transition, which at z = 0.396 is redshifted into the 3-mm band, with = 82.546 GHz. The half power primary beam (field of view) is 61.4 arcsec. The observed configuration D provided a 7.5 x 6.5 arcsec2 beam with PA= 175 deg. The GILDAS reduction was made into a cube of 128 128 180 pixels, of 1.5 1.5 arcsec 20 MHz, or 8 8kpc 72.6 km/s. The rms noise level was 0.7 mJy /beam. The spatial resolution does not allow to resolve the galaxy CO emission. No continuum was detected, with an rms noise level of 0.05 mJy/beam in a 3.6 GHz bandwidth.
For CL 0926+1242, we targeted the CO(2-1) line at 230.538001 GHz, redshifted at = 154.866GHz. The half power primary beam (field of view) is 32.5 arcsec. The observed configuration C provided a beam of 2.0 1.7 arcsec2 with PA= 21 deg. The GILDAS reduction was made into a cube of 256 256 90 pixels, of 0.45 0.45 arcsec 40 MHz, or 2.7 2.7kpc 77.5 km/s. The rms noise level was 0.7 mJy /beam. The spatial resolution allows to separate two interacting galaxies, but not to resolve the galaxy CO emission. No continuum was detected, with an rms noise level of 0.07 mJy/beam in 3.6 GHz bandwidth.
Our resolution in frequency was smoothed to 20MHz for CO(1-0) in CL 1416+4446 (72.615 km/s per channel) and 40MHz for CO(2-1) in CL 0926+1242 (77.432 km/s per channel).
4 Results
Figure 4 shows the CO detection map and spectra of the two sources (designated A and B) in the field of CL0926+1242. Fig. 5 shows the HST ACS/WFC F814W image of the targeted field (Hoekstra et al., 2011), marking the positions of what turns out to be two interacting spiral galaxies, on which we superimposed the contours of their CO fluxes. Figure 6 shows the detection map and spectrum of GAL1416+4446. GAL0926+1242-A and B are detected at 5, while GAL 1416+4446 is detected at 10.
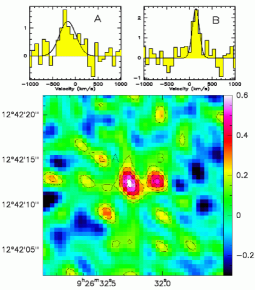
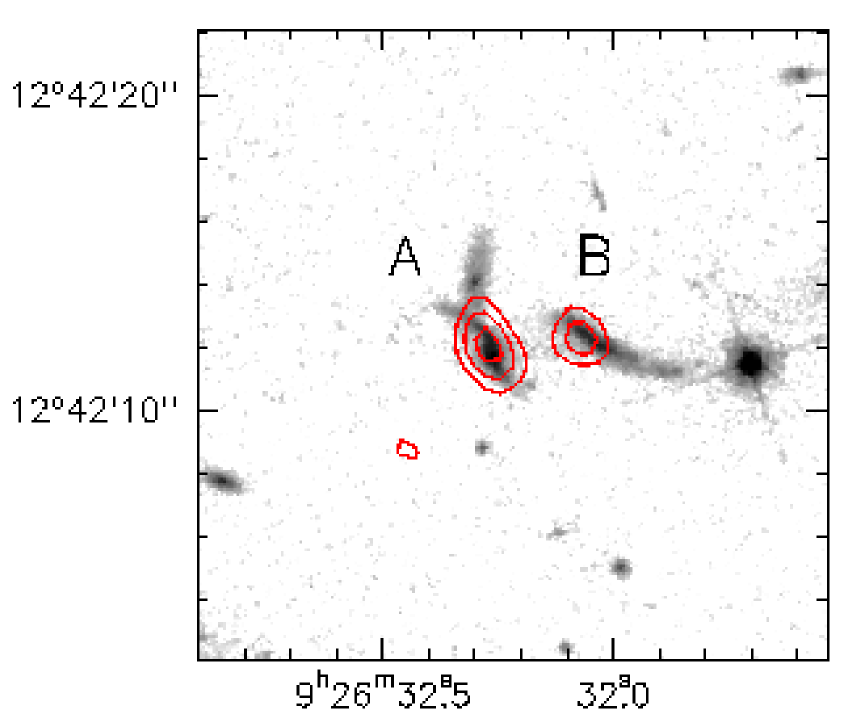
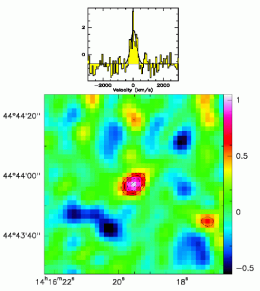
Table 3 lists the CO fluxes of our three detected galaxies. We assumed a ratio of 1 between the CO(2-1) and CO(1-0) luminosities as expected for a thermalized optically thick CO emission and therefore the line luminosities were calculated as L′CO = 3.25 107 S (1+z)-3 D in K km s-1 pc2, where CO is CO(1-0) for CL 1416+4446 and CO(2-1) for CL 0926+1242, DL the luminosity distance in Mpc, z the redshift of the source, SCO the total velocity integrated line flux in Jy km/s, and the observed frequency (Solomon & Vanden Bout, 2005) .
Figure 1 shows L′CO and LIR for our target galaxies compared to local cluster galaxies. Figure 1 also shows five galaxies of (Geach et al., 2011) in the outskirts of the rich cluster Cl 0024+16 ( = 0.395), normal BzK 1 field galaxies (Daddi et al., 2010), the serendipitous detection of a =1.114 galaxy in the cluster ISCS J1432.4+3332 (Wagg et al., 2012), and the eight 1.2 and eight 2.3 galaxies with CO detections from Tacconi et al. (2010). We derived the IR luminosity of the sample of Tacconi et al. (2010) by assuming a Kennicutt relation between LIR and star formation rate, rescaled for a Chabrier IMF, as in Nordon et al. (2010), SFRIR(M⊙/yr) = LIR/9.85 × 109 L⊙. We restrict our discussion to samples of LIRGs, i.e., do not consider ULIRGs.
| ID | CO | V | SCO | L |
|---|---|---|---|---|
| km s-1 | Jy km/s | 109K km/s pc2 | ||
| GAL1416+4446 | (1-0) | 42040 | 1.00.1 | 8.10.8 |
| GAL0926+1242-A | (2-1) | 42040 | 0.60.1 | 1.90.3 |
| GAL0926+1242-B | (2-1) | 20020 | 0.50.1 | 1.6 0.3 |
One immediate result from Figure 1 is that the relation between LIR and L′CO for distant cluster galaxies extends the relation of nearby systems to larger . The evolution of the bright end of the IR cluster luminosity function was also noticed by Bai et al. (2009) and Finn et al. (2010) and is not a consequence of our selection of cluster galaxies with both CO and IR measurements. Nevertheless, there is no hint for any deviation from the local trend such as seen for comparable redshift range by Combes et al. (2011, 2013) when they include field ULIRGs; all points fall within the 0.28dex dispersion of the local relation. Another interesting feature is that the smallest CO luminosities among the distant galaxies are measured in cluster galaxies.
The masses of our sample galaxies are shown in Figure 3. The mass of GAL0926+1242 B is very uncertain due to its faintness and correlated large photometric errors. Still it is likely the least massive LIRGs observed so far in CO, all the other distant galaxies being on the massive tail of the galaxy mass distribution. In Section 2 we showed that stellar masses play a secondary role in determining star formation activity; comparing the nearby and distant samples shows the lack of evolution with time of the conversion between gas and stars. Nevertheless, we also saw that at fixed LIR, the field galaxies could possess more cold gas than the cluster ones. This suggests that L′CO mostly derived from the CO(10) line is sensitive to the vast majority of the molecular gas in the cold interstellar medium of galaxies, but less to the part which will actually be used to form stars. Higher order transitions, from CO(43) to CO(76), or the HCN and CS molecules, have been shown to trace gas that is denser and more directly connected to star formation (Gao & Solomon, 2004; Bayet et al., 2009b, a). This suggests that some molecular gas can be stripped for example by ram-pressure or strangulation before the star formation rate is affected. After a while, though, the fueling of the cluster galaxy activity will be low and this might explain the systematic lower fraction of IR emitters in the clusters as compared to the field.
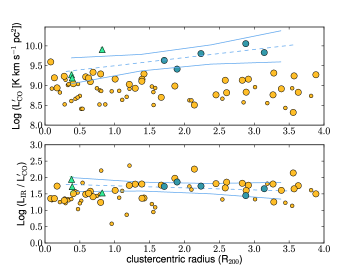
Figure 7 compares the clustercentric distances and L′CO for our galaxies and those of Geach et al. (2011). We used the location of the BCG (J2000, 00:26:35.7, +17:09:43) as the center of CL0024+16 (Treu et al., 2003) and X-ray centers for CL0926+1242 and CL1416+4446 (Burenin et al., 2007). Figure 7 shows a decline of L′CO towards the center of the clusters, suggesting that H2 is depleted in the inner regions. The slope of the relation is 0.20 0.09 with a correlation coefficient of 0.70 and a p- value of 0.05, rejecting the null hypothesis. The lower panel of Fig. 7 shows how the ratio between the IR flux (proxy for the star formation) is linked to the CO luminosity, representative of the amount of cold gas. We find no correlation (slope =). These galaxies have similar IR luminosities ( a factor 4 excursion, in principle leading to doubling L′CO, from Fig.1) and star formation efficiencies, therefore, they give evidence of a genuine enhancement in CO content towards the cluster outskirts.
For comparison, we show the same relations for the local sample. Because both our observations and those of Geach et al. targeted relatively massive clusters, we restrict this comparison to nearby galaxy structures with 300km/s. Furthermore, in order to minimize the aperture corrections and to allow for a large radial coverage, we consider z 0.01. Following Finn et al. (2010), R200 were calculated from the cluster velocity dispersions taken from Struble & Rood (1999); Koranyi & Geller (2002) and Bothun et al. (1983). The 0.30 dex dispersion in L′CO reflects the large range of IR luminosity covered, a standard variation of 1.7dex for a median value LIR=3.31010L⊙. Therefore, in order to allow for a fair comparison with the z0.4 sample, we highlight the local galaxies with LIR from 2.51010L⊙ to 1011L⊙, i.e., with the closest possible star formation rates to the Geach’s and our PdBI galaxies, and spanning a similar factor 4 in IR luminosity. Contrary to the case of the z0.4 clusters, we find no variation of the galaxy CO luminosity with the position of the galaxy. This absence of trend remains if one chooses a lower central LIR. The interpretation of the different behavior between the mid-z and nearby cluster galaxies is not straightforward, particularly because they belong to different star formation rate (LIR) regimes. The fact that most of the local sample are built from structures located in massive superclusters (Perseus-Pisces, Coma) could be one, added to the longer time evolution. In any case, it emphasizes the significance of the radial trend detected in the mid-z clusters.
We could question our choice of not using any conversion factor from L′CO to a proper H2 mass and suspect that we are only witnessing different factors rather than a genuine change in cold gas reservoir. The conversion ratio is known to vary significantly from galaxy to galaxy, and is the lowest in active starburst galaxies, the ULIRGs, where a factor of = 0.8 (K km s-1 pc2)-1 has been advocated by Solomon et al. (1997). The conversion factor is depending on the excitation temperature of the CO lines, Tex, the density of the molecular gas, nH2, the gas metallicity Z, and the ambient UV radiation field, among others. It is expected to vary as nH21/2/Tex, from the Virial hypothesis for molecular clouds (e.g., Dickman et al., 1986). When the gas is more excited and hotter, due to an intense and concentrated starburst as in ULIRGs, the conversion ratio decreases. The dependence in metallicity is complex and non-linear: at low metallicity, C and O being less abundant, yields a lower CO/H2 abundance, but also, there is then less dust, and less self-shielding from the UV photodissociating radiation, so that CO is preferentially destroyed, before H2 itself (Maloney & Black, 1988). Given the high mass of our galaxies, the metallicity should be at least solar or above, and this parameter should not be determinant on the CO-to-H2 conversion ratio. Our galaxies are only LIRGs and at their intermediate redshifts, they correspond to main sequence galaxies, instead of the starburst extreme of the star formation activity (Finn et al., 2010; Wuyts et al., 2011). Therefore a standard and constant conversion ratio most likely applies to our galaxies. This should of course be confirmed through more observations, for instance of the dust mass, and dust-to-gas mass ratio (Sandstrom et al., 2012).
5 Conclusions
We used IRAM PdBI to obtain the first CO detections of galaxies located at projected distances within the virial radii of two intermediate redshift clusters, CL1416+4446 (z=0.397) and CL0926+1242 (z=0.489). We detected three galaxies at high significance (5-10) enabling robust estimates of their CO luminosities. All three galaxies are LIRGs, and they are normal star forming galaxies. The two galaxies in CL0926+1242 are interacting spirals. In order to put our results into a general context, we revisited the case of the nearby galaxies (0.05). We assembled a sample of 275 field and 170 cluster galaxies for which we could collect both reliable far infrared luminosities and CO luminosities from the literature. We revised the distances of all galaxies, derived the far infrared luminosities and aperture-corrected the CO luminosities in a homogeneous way. Our main conclusions are the following:
At fixed LIR, or fixed stellar mass, the frequency of a high L′CO is lower in clusters than in the field, suggesting environmental depletion of the reservoir of cold gas.
The level of star formation activity in a galaxy is primarily linked to the amount of cold gas, rather than to the galaxy mass or redshift. In clusters, just as in the field, the conversion between gas and star looks universal. The relation between LIR and L′CO for distant cluster galaxies extends the relation of nearby systems to higher IR luminosities; the distant galaxies fall well within the dispersion of the trend defined by local systems.
Given that L′CO is mostly derived from the CO(10) line and sensitive to the vast majority of the molecular gas in the cold interstellar medium of galaxies, but less to the part which will actually be used to form stars, we suggest that molecular gas can be stripped before the star formation rate is affected. After a while, though, the fueling of the cluster galaxy activity will be low and this might explain the systematic lower fraction of IR emitters in the clusters as compared to the field. If this is true, for a given star formation rate, field and cluster galaxies should have comparable mass of dense gas as traced by the high order transitions of CO, or the HCN and CS molecules.
Combining the sample of Geach et al. (2009a, 2011) and ours, we find evidence for a decrease in CO towards the cluster centers. This is the first hint of an environmental impact on cold gas at intermediate redshift.
Our present work is by no means a definitive answer to the questions raised in the introduction. Instead it stresses the imperative need for large samples of LIRGs both in the field and in clusters, to put studies such as this one on firm statistical ground. Compared to local surveys, surveys at intermediate redshift do not suffer large luminosity uncertainties due to partial spatial coverage. Nevertheless, distant surveys must account for: i) chance alignment: galaxies in the outskirts of the clusters have a higher probability to be genuinely located in the infall regions than have galaxies projected on the cluster core to be indeed in the inner regions. ii) diversity in cluster properties: the mass of the clusters largely determines both the proportion of galaxies with ongoing star formation, and the strength of their activity, as infered from the [OII] emission line (e.g., Poggianti et al., 2006)
References
- Bai et al. (2009) Bai, L., Rieke, G. H., Rieke, M. J., Christlein, D., & Zabludoff, A. I. 2009, ApJ, 693, 1840
- Bayet et al. (2009a) Bayet, E., Aladro, R., Martín, S., Viti, S., & Martín-Pintado, J. 2009a, ApJ, 707, 126
- Bayet et al. (2009b) Bayet, E., Gerin, M., Phillips, T. G., & Contursi, A. 2009b, MNRAS, 399, 264
- Bigiel et al. (2008) Bigiel, F., Leroy, A., Walter, F., et al. 2008, AJ, 136, 2846
- Boselli et al. (1997) Boselli, A., Gavazzi, G., Lequeux, J., et al. 1997, A&A, 327, 522
- Bothun et al. (1983) Bothun, G. D., Geller, M. J., Beers, T. C., & Huchra, J. P. 1983, ApJ, 268, 47
- Bruzual & Charlot (2003) Bruzual, G. & Charlot, S. 2003, MNRAS, 344, 1000
- Burenin et al. (2007) Burenin, R. A., Vikhlinin, A., Hornstrup, A., et al. 2007, ApJS, 172, 561
- Butcher & Oemler (1984) Butcher, H. & Oemler, Jr., A. 1984, ApJ, 285, 426
- Casoli et al. (1991) Casoli, F., Boisse, P., Combes, F., & Dupraz, C. 1991, A&A, 249, 359
- Casoli et al. (1996) Casoli, F., Dickey, J., Kazes, I., et al. 1996, A&A, 309, 43
- Casoli et al. (1998) Casoli, F., Sauty, S., Gerin, M., et al. 1998, A&A, 331, 451
- Combes et al. (2011) Combes, F., García-Burillo, S., Braine, J., et al. 2011, A&A, 528, A124
- Combes et al. (2013) Combes, F., Garcia-Burillo, S., Braine, J., et al. 2013, A&A, 550, A41
- Daddi et al. (2010) Daddi, E., Elbaz, D., Walter, F., et al. 2010, ApJ, 714, L118
- De Lucia (2010) De Lucia, G. 2010, in JENAM 2010, Joint European and National Astronomy Meeting
- Desai et al. (2007) Desai, V., Dalcanton, J. J., Aragón-Salamanca, A., et al. 2007, ApJ, 660, 1151
- Dickman et al. (1986) Dickman, R. L., Snell, R. L., & Schloerb, F. P. 1986, ApJ, 309, 326
- Dressler (1980) Dressler, A. 1980, ApJ, 236, 351
- Duc et al. (2002) Duc, P.-A., Poggianti, B. M., Fadda, D., et al. 2002, A&A, 382, 60
- Finn et al. (2010) Finn, R. A., Desai, V., Rudnick, G., et al. 2010, ApJ, 720, 87
- Gao & Solomon (2004) Gao, Y. & Solomon, P. M. 2004, ApJS, 152, 63
- García-Burillo et al. (2012) García-Burillo, S., Usero, A., Alonso-Herrero, A., et al. 2012, A&A, 539, A8
- Geach et al. (2009a) Geach, J. E., Smail, I., Coppin, K., et al. 2009a, MNRAS, 395, L62
- Geach et al. (2011) Geach, J. E., Smail, I., Moran, S. M., et al. 2011, ApJ, 730, L19
- Geach et al. (2009b) Geach, J. E., Smail, I., Moran, S. M., Treu, T., & Ellis, R. S. 2009b, ApJ, 691, 783
- Genzel et al. (2010) Genzel, R., Tacconi, L. J., Gracia-Carpio, J., et al. 2010, MNRAS, 407, 2091
- Guilloteau & Lucas (2000) Guilloteau, S. & Lucas, R. 2000, in Astronomical Society of the Pacific Conference Series, Vol. 217, Imaging at Radio through Submillimeter Wavelengths, ed. J. G. Mangum & S. J. E. Radford, 299
- Haines et al. (2009) Haines, C. P., Smith, G. P., Egami, E., et al. 2009, ApJ, 704, 126
- Haynes & Giovanelli (1984) Haynes, M. P. & Giovanelli, R. 1984, AJ, 89, 758
- Helfer et al. (2003) Helfer, T. T., Thornley, M. D., Regan, M. W., et al. 2003, ApJS, 145, 259
- Hoekstra et al. (2011) Hoekstra, H., Donahue, M., Conselice, C. J., McNamara, B. R., & Voit, G. M. 2011, ApJ, 726, 48
- Jarrett et al. (2013) Jarrett, T. H., Masci, F., Tsai, C. W., et al. 2013, AJ, 145, 6
- Kenney & Young (1989) Kenney, J. D. P. & Young, J. S. 1989, ApJ, 344, 171
- Koranyi & Geller (2002) Koranyi, D. M. & Geller, M. J. 2002, AJ, 123, 100
- Kriek et al. (2009) Kriek, M., van Dokkum, P. G., Labbé, I., et al. 2009, ApJ, 700, 221
- Kuno et al. (2007) Kuno, N., Sato, N., Nakanishi, H., et al. 2007, PASJ, 59, 117
- Lavezzi & Dickey (1998) Lavezzi, T. E. & Dickey, J. M. 1998, AJ, 115, 405
- Lavezzi et al. (1999) Lavezzi, T. E., Dickey, J. M., Casoli, F., & Kazès, I. 1999, AJ, 117, 1995
- Mahajan et al. (2011) Mahajan, S., Mamon, G. A., & Raychaudhury, S. 2011, MNRAS, 416, 2882
- Maloney & Black (1988) Maloney, P. & Black, J. H. 1988, ApJ, 325, 389
- Moran et al. (2007) Moran, S. M., Ellis, R. S., Treu, T., et al. 2007, ApJ, 671, 1503
- Navarro et al. (1997) Navarro, J. F., Frenk, C. S., & White, S. D. M. 1997, ApJ, 490, 493
- Nordon et al. (2010) Nordon, R., Lutz, D., Shao, L., et al. 2010, A&A, 518, L24
- Poggianti et al. (2006) Poggianti, B. M., von der Linden, A., De Lucia, G., et al. 2006, ApJ, 642, 188
- Pope et al. (2008) Pope, A., Bussmann, R. S., Dey, A., et al. 2008, ApJ, 689, 127
- Rengarajan & Iyengar (1992) Rengarajan, T. N. & Iyengar, K. V. K. 1992, MNRAS, 259, 559
- Rieke et al. (2009) Rieke, G. H., Alonso-Herrero, A., Weiner, B. J., et al. 2009, ApJ, 692, 556
- Saintonge et al. (2011) Saintonge, A., Kauffmann, G., Kramer, C., et al. 2011, MNRAS, 415, 32
- Saintonge et al. (2008) Saintonge, A., Tran, K.-V. H., & Holden, B. P. 2008, ApJ, 685, L113
- Sajina et al. (2005) Sajina, A., Lacy, M., & Scott, D. 2005, ApJ, 621, 256
- Sanders & Mirabel (1996) Sanders, D. B. & Mirabel, I. F. 1996, ARA&A, 34, 749
- Sandstrom et al. (2012) Sandstrom, K. M., Leroy, A. K., Walter, F., et al. 2012, ArXiv e-prints
- Scott et al. (2013) Scott, T. C., Usero, A., Brinks, E., et al. 2013, MNRAS, 429, 221
- Solomon et al. (1997) Solomon, P. M., Downes, D., Radford, S. J. E., & Barrett, J. W. 1997, ApJ, 478, 144
- Solomon & Vanden Bout (2005) Solomon, P. M. & Vanden Bout, P. A. 2005, ARA&A, 43, 677
- Stern et al. (2005) Stern, D., Eisenhardt, P., Gorjian, V., et al. 2005, ApJ, 631, 163
- Struble & Rood (1999) Struble, M. F. & Rood, H. J. 1999, ApJS, 125, 35
- Tacconi et al. (2010) Tacconi, L. J., Genzel, R., Neri, R., et al. 2010, Nature, 463, 781
- Tempel et al. (2012) Tempel, E., Tago, E., & Liivamägi, L. J. 2012, A&A, 540, A106
- Treu et al. (2003) Treu, T., Ellis, R. S., Kneib, J.-P., et al. 2003, ApJ, 591, 53
- Vikhlinin et al. (2009) Vikhlinin, A., Burenin, R. A., Ebeling, H., et al. 2009, ApJ, 692, 1033
- Vollmer et al. (2008) Vollmer, B., Braine, J., Pappalardo, C., & Hily-Blant, P. 2008, A&A, 491, 455
- Vollmer et al. (2012) Vollmer, B., Wong, O. I., Braine, J., Chung, A., & Kenney, J. D. P. 2012, A&A, 543, A33
- Wagg et al. (2012) Wagg, J., Pope, A., Alberts, S., et al. 2012, ApJ, 752, 91
- Wardlow et al. (2010) Wardlow, J. L., Smail, I., Wilson, G. W., et al. 2010, MNRAS, 401, 2299
- Wong & Blitz (2002) Wong, T. & Blitz, L. 2002, ApJ, 569, 157
- Wuyts et al. (2011) Wuyts, S., Förster Schreiber, N. M., van der Wel, A., et al. 2011, ApJ, 742, 96
- Young et al. (1995) Young, J. S., Xie, S., Tacconi, L., et al. 1995, ApJS, 98, 219