Superconductivity induced by electron doping in the system La1-xMxOBiS2 (M = Ti, Zr, Hf, Th)
Abstract
We report a strategy to induce superconductivity in the BiS2-based compound LaOBiS2. Instead of substituting F for O, we increase the charge-carrier density (electron dope) via substitution of tetravalent Th+4, Hf+4, Zr+4, and Ti+4 for trivalent La+3. It is found that both the LaOBiS2 and ThOBiS2 parent compounds are bad metals and that superconductivity is induced by electron doping with Tc values of up to 2.85 K. The superconducting and normal states were characterized by electrical resistivity, magnetic susceptibility, and heat capacity measurements. We also demonstrate that reducing the charge-carrier density (hole doping) via substitution of divalent Sr+2 for La+3 does not induce superconductivity.
pacs:
74.70.Dd, 74.25.F-, 74.25.OpI Introduction
Superconductivity with = 8.6 K has recently been reported in the layered compound Bi4O4S3. Mizuguchi et al. (2012a) Following this report, several other BiS2-based superconductors, including O1-xFxBiS2 (Ln = La, Ce, Pr, Nd, Yb) with as high as 10 K, have been synthesized and studied. Li et al. (2012); Jha et al. (2012); Deguchi et al. (2012); Kotegawa et al. (2012); Awana et al. (2012); Demura et al. (2012); Mizuguchi et al. (2012b); Xing et al. (2012); Yazici et al. (2012) These materials have a layered crystal structure composed of superconducting BiS2 layers and blocking layers of Bi4O4(SO4)1-x for Bi4O4S3 and O for O1-xFxBiS2 (Ln = La, Ce, Pr, Nd and Yb). This structural configuration is similar to the situation encountered in the high- layered cuprate and Fe-pnictide superconductors, in which superconductivity primarily resides in CuO2 planes and Fe-pnictide layers, respectively.Zhano et al. (2008); Alff et al. (2003); Paglione and Greene (2010); Johnston (2010); Mazin (2010) Even though BiS2-based superconductors share a similar crystal structure with Fe-pnictide superconductors, they exhibit some important differences. The undoped parent compounds, LnFeAsO, display a spin density wave (SDW) or a structural instability near 150 K.Paglione and Greene (2010); Johnston (2010); Mazin (2010) Superconductivity emerges when the SDW is suppressed towards zero temperature either through charge carrier doping or application of pressure.Okada et al. (2008) is raised as high as 55 K by replacement of La by other rare-earth element, Sm.Paglione and Greene (2010); Johnston (2010) In contrast, the phosphorus-based analogues LnFePO do not show a SDW transition or structural instability but still exhibit superconductivity.Hamlin et al. (2008); Kamihara et al. (2008a) For LaFePO, values of that range from 3 K Kamihara et al. (2008a) to 7 K, Tegel et al. (2008) without charge carrier doping, have been reported. Both LnFeAsO and LnFePO remain metallic to low temperatures, while the undoped parent compounds LnOBiS2 are bad metals. It has been suggested that superconductivity emerges in close proximity to an insulating normal state for the optimal superconducting sample.Xing et al. (2012)
Several distinct examples of chemical substitution have been found to induce superconductivity in LnFeAsO compounds including substituting F for O, Kamihara et al. (2008b); Chen et al. (2008a); Ren et al. (2008a, b, c); Chen et al. (2008b); Xing et al. (2012) Co for Fe, Sefat et al. (2008) Sr for La, Wen et al. (2008) Th for Gd, Wang et al. (2008) and also the introduction of oxygen vacancies. Ren et al. (2008d); Yang et al. (2008) Substituting F for O induces superconductivity in BiS2-based superconductors.Yildirim (2012); Li et al. (2012); Deguchi et al. (2012); Jha et al. (2012); Kotegawa et al. (2012); Awana et al. (2012); Demura et al. (2012); Mizuguchi et al. (2012b); Lee et al. (2012); Shein and Ivanovskii (2012); Wan et al. (2012); Xing et al. (2012); Yazici et al. (2012) To determine whether superconductivity might emerge under other conditions, we chose to dope electrons via chemical substitution on the La site in LaOBiS2. In this study, we demonstrate that substitution of tetravalent Th+4, Hf+4, Zr+4, and Ti+4 for trivalent La+3 in LaOBiS2 induces superconductivity. We also observed that substitution of divalent Sr+2 for La+3 (hole doping) does not induce superconductivity.
II Experimental Methods
Polycrystalline samples of La1-xThxOBiS2 (), La1-xHfxOBiS2 (), La1-xZrxOBiS2 (), La1-xTixOBiS2 (), and La1-xSrxOBiS2 () were prepared by a two-step solid state reaction method using high-purity starting materials. Initially, the Bi2S3 precursor powders were prepared by reacting Bi and S grains together at 500 ℃ in an evacuated quartz tube for 10 hours. Starting materials of La, La2O3, S and Bi2S3 powders and either M = Th or Ti chunks, Hf granules, or Zr foil, were weighed in stoichiometric ratios based on nominal concentrations LaBiS2 (M = Th, Hf, Zr, Ti). Next they were thoroughly mixed, pressed into pellets, sealed in evacuated quartz tubes, and annealed at 865 ℃ for 72 hours. Additional regrinding and sintering at 700 ℃ for 3 days was performed to promote phase homogeneity. The crystal structure was verified by means of x-ray powder diffraction (XRD) using a Bruker D8 Discover x-ray diffractometer with Cu-K radiation. The resulting XRD patterns were fitted via Rietveld refinementRietveld (1969) using the GSAS+EXPGUI software package.Larson and Von Dreele (1994); Toby (2001) Electrical resistivity measurements were performed using a home-built probe in a liquid 4He Dewar for temperatures 1 K 300 K by means of a standard four-wire technique using a Linear Research LR700 AC resistance bridge. Magnetization measurements were made for 2 K 300 K and in magnetic fields = 5 Oe using a Quantum Design MPMS. AC magnetic susceptibility was measured down to 1 K in a liquid 4He Dewar. Specific heat measurements and electrical resistivity measurements under applied magnetic field for La0.85Th0.15OBiS2 and La0.8Hf0.2OBiS2 samples were performed for 0.36 K 30 K in a Quantum Design PPMS DynaCool with a 3He insert using a thermal relaxation technique.
III Results
III.1 Crystal structure and sample quality
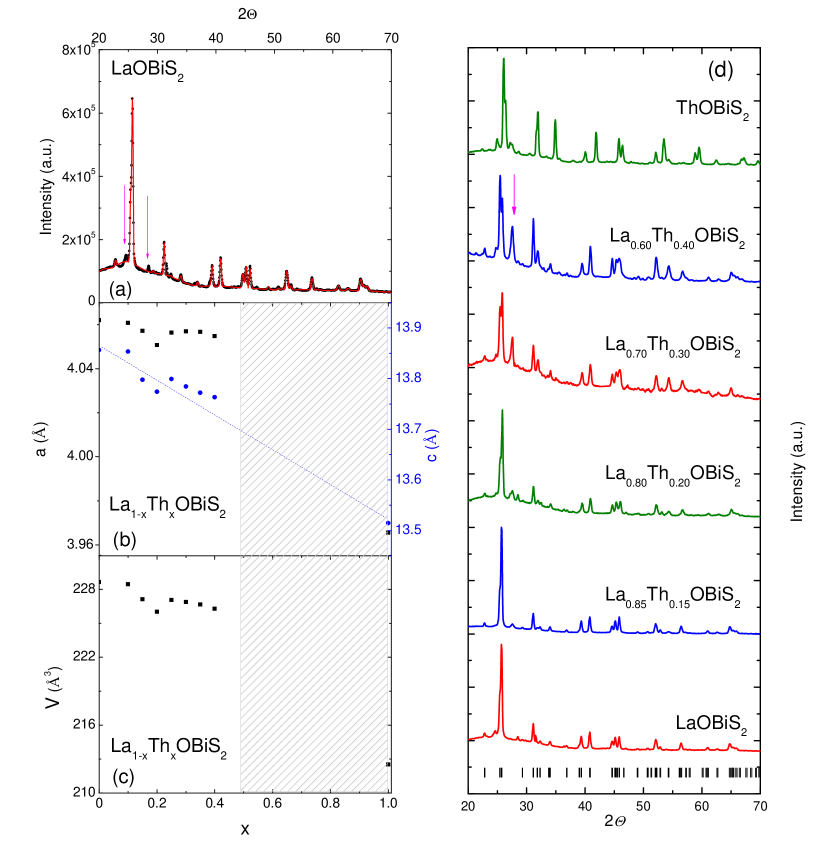
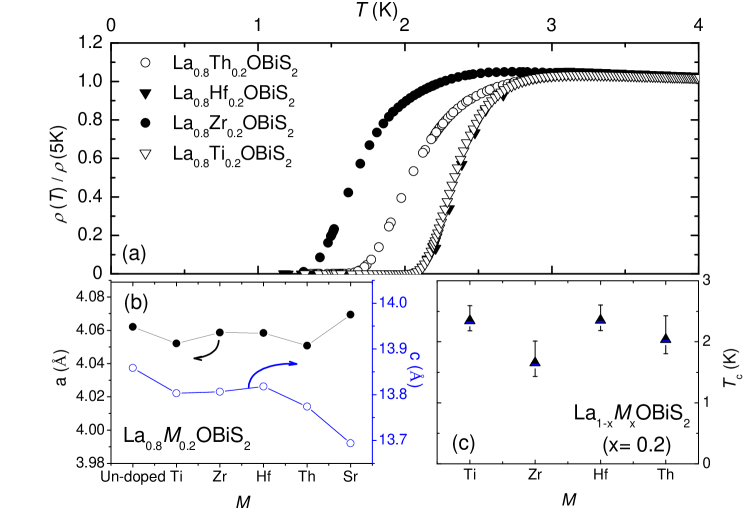
LaOBiS2 and ThOBiS2 are isostructural with the ZrCuSiAs structure type (space group ). The inset of Fig. 1(a), displays the crystal structure of LaOBiS2. The structure is composed of stacked La2O2 layers and two BiS2 layers in each unit cell. To dope electrons into the BiS2 conduction layers, we substituted tetravalent Th+4, Hf+4, Zr+4, and Ti+4 for La+3 and to dope holes into the BiS2 conduction layers, we substituted divalent Sr+2 for trivalent La+3. We find that samples for the entire range of Th substitutions below the solubility limit, Hf substitutions in the range , and Zr, Ti, and Sr substitutions in the range , can be described by the same space group. As shown in Fig. 1(b), the lattice parameters and for La1-xThxOBiS2 () decrease with increasing Th concentration, although the relative decrease of is much smaller than that of . With Th doping, the positions of Bragg reflections shift systematically. For example, the (004) reflections shift to higher angles, consistent with a decrease of . This result indicates that Th is really incorporated into the lattice; although, small amounts of elemental Bi, indicated by arrows in Fig. 1(a, d), separate from the lattice. The amount of Bi impurity increases with increasing Th concentration. For , the lattice parameters (not shown) are close to the lattice parameters of ThOBiS2 and do not change appreciably with . The Bi impurity amount increases with and other impurity peaks begin to appear in this region, indicating the probable existence of a solubility limit of La/Th near . For the Hf, Zr and Ti substitutions, the lattice parameters and exhibit behavior similar to Th substitution, wherein the lattice parameter decreases with increasing Hf, Zr, and Ti concentration and the lattice parameter does not show an appreciable concentration dependence. For Sr substitution, the lattice parameter increases slightly, while decreases with increasing Sr concentration.

III.2 Electrical resistivity
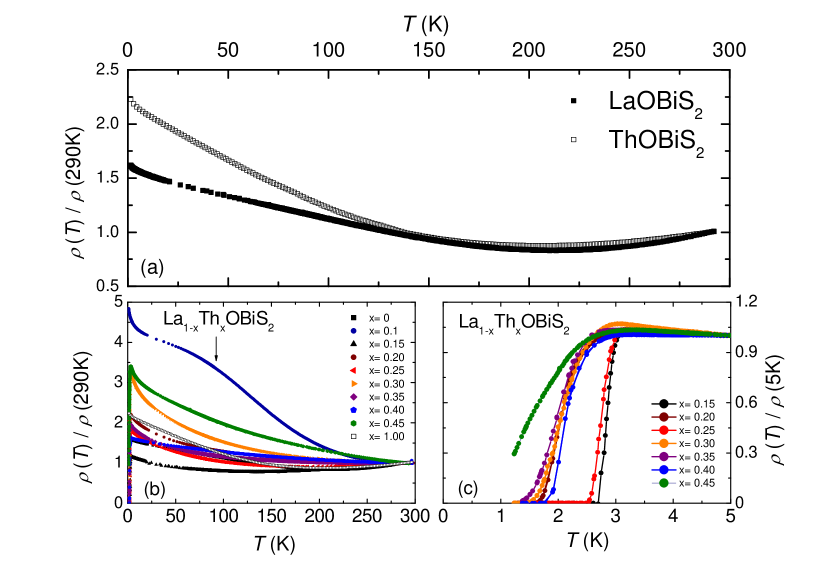
Electrical resistivity data, normalized by the value of at 290 K, are shown in Fig. 2 for the pure LaOBiS2 and ThOBiS2 samples. For both compounds, initially decreases with decreasing temperature, exhibits a minimum at = 220 K and = 206 K, respectively, and then shows semiconductor-like behavior down to the lowest temperatures measured. For the La1-xThxOBiS2 system, the minimum in is suppressed for , and exhibits relatively strong temperature-dependence and an inflection point (indicated by an arrow) as shown in Fig. 2(b). For = 0.15, this feature disappears and drops to zero below = 2.85 K. becomes less temperature-dependent for and increases with decreasing temperature until the onset of superconductivity. First principle calculations have suggested that there may be a charge density wave instability or an enhanced correlations in the LaO1-xFxBiS2 system. Yildirim (2012) We are unable to unambiguously observe such instability from the electrical resistivity measurements in this study. However, the inflection point could be related to such an effect.
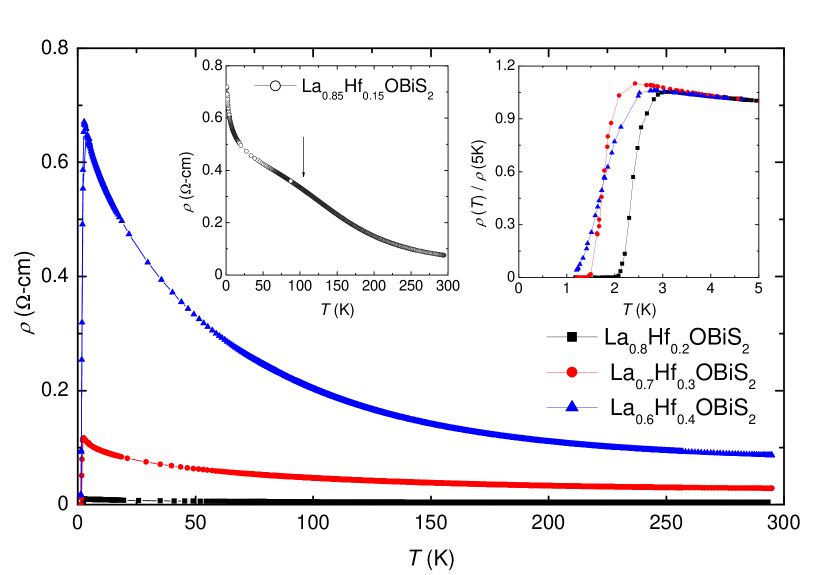
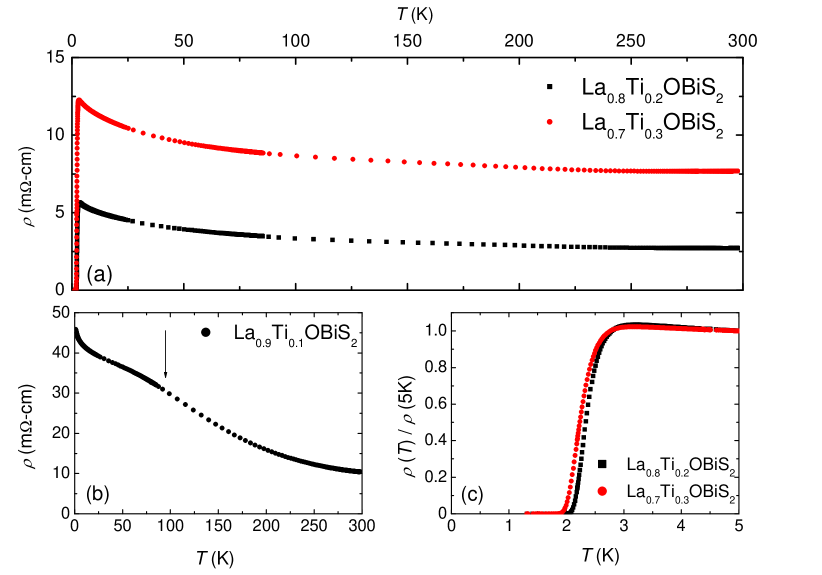
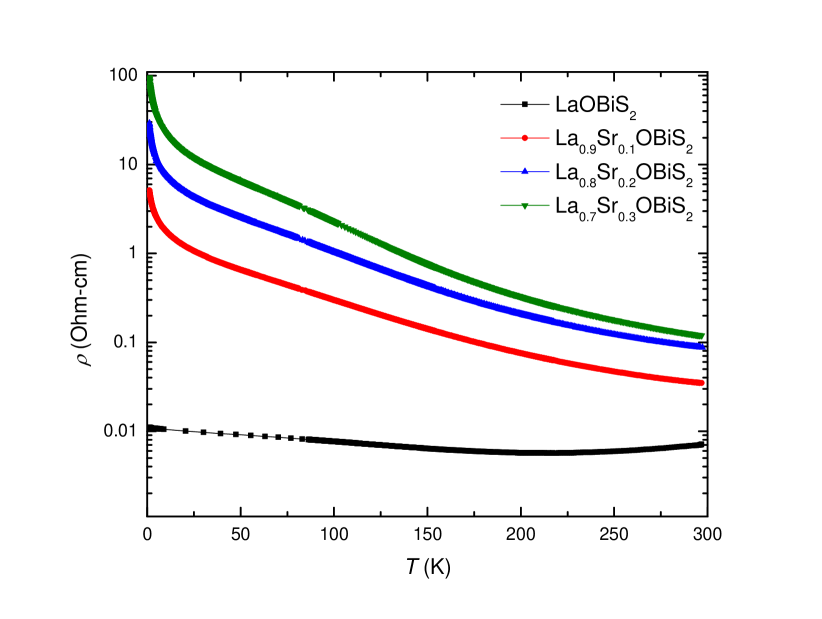
Electrical resistivity measurements for La1-xHfxOBiS2, La1-xZrxOBiS2, and La1-xTixOBiS2 samples are shown in Figs. 3, 4 and 5, respectively. Resistive superconducting transition curves for these systems are indicated in the right inset of Figs. 3, 4, and 5(c). All of these doping studies show similar characteristics such as an inflection point anomaly in the normal state with low concentration and induced superconductivity for concentrations starting with = 0.15 for La1-xThxOBiS2 and = 0.2 for La1-xHfxOBiS2, La1-xZrxOBiS2, and La1-xTixOBiS2. Furthermore, all of these systems show semiconductor-like behavior in the normal state. The inflection point in of samples with low concentration is emphasized in the left inset of Figs. 3, 4, and in Fig. 5(b) where the anomaly is indicated by an arrow. These anomalies all appear to be present at a common temperature of roughly 120 K in concentrations just below those where superconductivity is induced. To compare the superconducting transition temperatures () we consider data for substitution of La by Th, Hf, Zr, and Ti in Fig. 6(a). The superconducting transition temperatures, as shown in Fig. 6(c), are characterized by the temperatures where the electrical resistivity drops to of the normal state resistivity, and the width of the transition is determined by the temperatures where the resistivity drops to and of the normal state resistivity. Electron doping clearly induces superconductivity in LaOBiS2. The ’s are quite similar to one another, but the transition width is sharper for La0.8Hf0.2OBiS2 and La0.8Ti0.2OBiS2 than for La0.8Zr0.2OBiS2 and La0.8Th0.2OBiS2. The lowest is seen in La0.8Zr0.2OBiS2. There does not appear to be a clear correlation between and the lattice parameters, shown in Fig. 6(b). Meanwhile, Fig. 7 shows measurements for La1-xSrxOBiS2 wherein no evidence of a superconducting transition is observed down to 1 K in the range . This result suggests that hole doping is not sufficient to induce superconductivity. It is, however, interesting to note that the magnitude of at low temperatures increases with increasing Sr concentration, which is similar to the behavior observed with Th, Hf, Zr, and Ti doping.
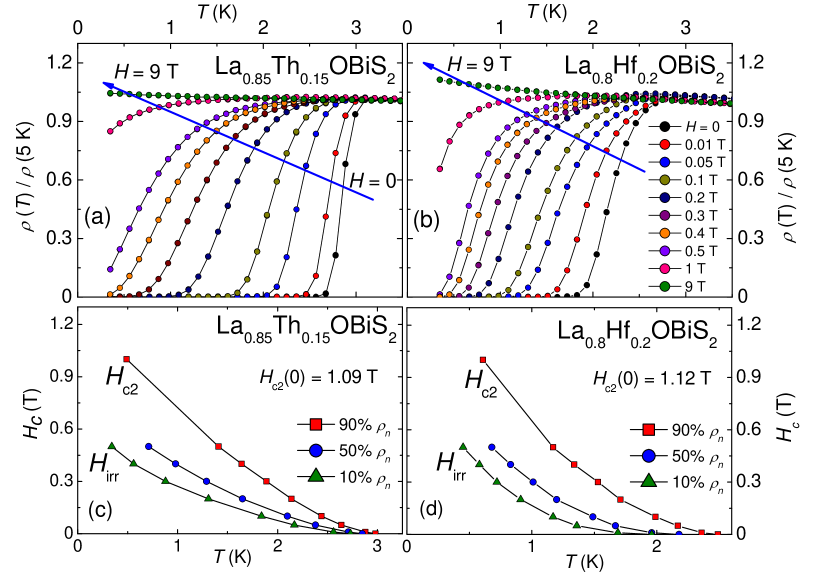
The temperature dependence of , normalized by its value at 5 K for La0.85Th0.15OBiS2 and La0.8Hf0.2OBiS2 samples, is shown in Fig. 8(a, b), respectively, under several applied magnetic fields ( 0, 0.01, 0.05, 0.1, 0.2, 0.3, 0.4, 0.5, 1, and 9 T) down to 0.36 K. Both samples undergo relatively sharp superconducting transitions at = 2.85 K and = 2.40 K for La0.8Th0.2OBiS2 and La0.8Hf0.2OBiS2, respectively. With increasing magnetic field, the transition width broadens and the onset of superconductivity gradually shifts to lower temperatures. Similar broadening of the transition was observed in the high- layered cuprate and Fe-pnictide superconductors and attributed to the vortex-liquid state.Safar et al. (1992); Lee et al. (2012) Fig. 8(c, d) shows the upper critical field vs. for La0.85Th0.15OBiS2 and La0.8Hf0.2OBiS2 samples, corresponding to the temperatures where the resistivity drops to of the normal state resistivity (), of (), and of () in applied magnetic fields. Using the conventional one-band Werthamer-Helfand-Hohenberg (WHH) theory, Werthamer et al. (1966) the orbital critical fields for La0.85Th0.15OBiS2 and La0.8Hf0.2OBiS2 compounds were inferred from their initial slopes of with respect to T, yielding values of 1.09 T and 1.12 T, respectively. These values of , are very close to the values seen in Sr1-xLaxFBiS2 (1.04 T) Lin et al. (2013) and LaO0.5F0.5BiS2 (1.9 T), Awana et al. (2012) suggesting that the superconducting state in BiS2-based superconductors probably shares a common character.
III.3 Magnetization
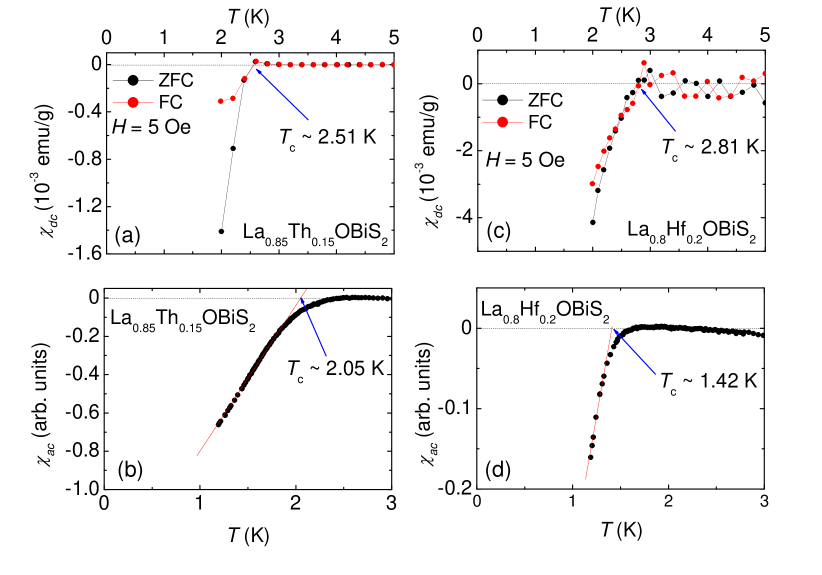
To determine whether superconductivity is a bulk phenomenon in LaOBiS2, zero field cooled (ZFC) and field cooled (FC) measurements of the magnetic susceptibility were made in a magnetic field of 5 Oe for the La0.85Th0.15OBiS2 and La0.8Hf0.2OBiS2 samples. These measurements are plotted in Fig. 9(a, c). ZFC measurements yield diamagnetic screening signals with onset values that are lower than values obtained from data, while FC measurements reveal evidence for strong vortex pinning. AC magnetic susceptibility measurements for La0.85Th0.15OBiS2 and La0.8Hf0.2OBiS2 samples are shown in Fig. 9(b, d), respectively. These data exhibit signatures of SC with slightly lower ’s than those observed in and measurements. It is clear that, even though the superconducting transition is incomplete at 1.3 K, the volume fraction at that temperature is appreciable for both samples.
III.4 Specific heat
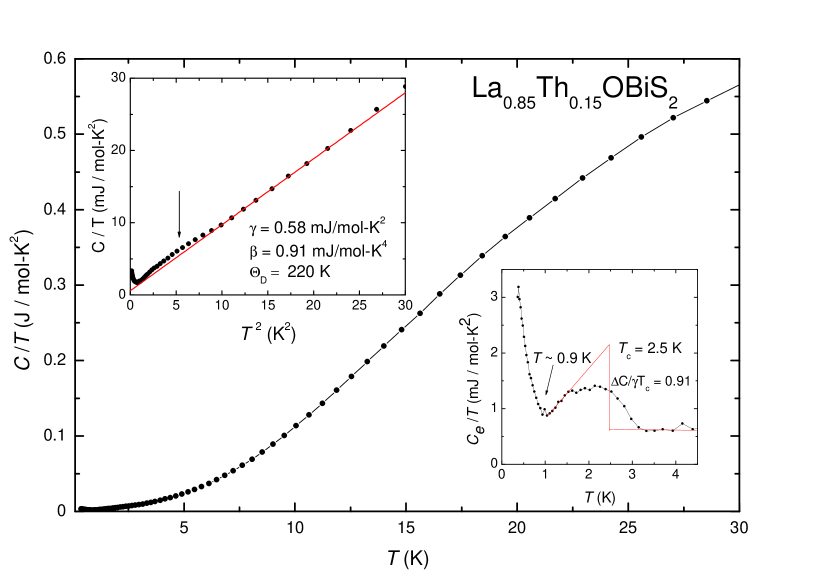
Specific heat data for La0.85Th0.15OBiS2 and La0.8Hf0.2OBiS2 samples are displayed in Fig. 10 and Fig. 11, respectively. The data for La0.85Th0.15OBiS2 cover the temperature range 0.36 K to 30 K. A fit of the expression to the data in the normal state, where is the electronic specific heat coefficient and is the coefficient of the lattice contribution, is plotted as a function of in the inset in the upper left hand side of Fig. 10. From the best fit, which is explicitly indicated by a line in the inset, we obtain values of mJ/mol-K2 and mJ/mol-K4; the value of corresponds to a Debye temperature of K. In the inset in the lower right hand side of Fig. 10, vs. is plotted. A clear feature is observed between and K. If this feature is related to the transition into the superconducting state, we can estimate = 2.5 K from an idealized entropy conserving construction. This value of is close to the temperature obtained from the electrical resistivity ( = 2.85 K). The presence of the feature may suggest that superconductivity is a bulk phenomenon in this compound. The ratio of the jump to , = 0.91, was calculated using a jump in of 0.53 mJ/mol-K2, extracted from the entropy conserving construction as seen in the inset in the lower right hand side of the figure. This value is less than the value of 1.43 predicted by the BCS theory, but is similar to that seen in LaO0.5F0.5BiS2.Yazici et al. (2012)
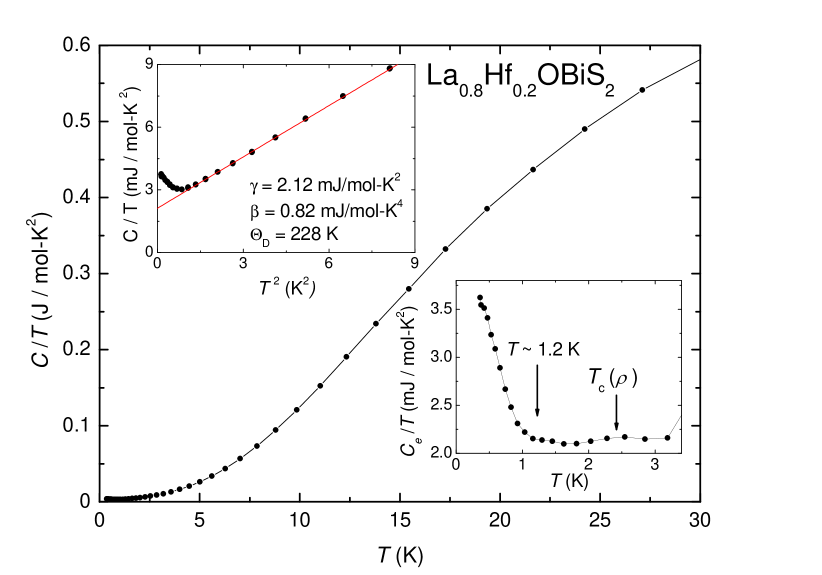
The specific heat data for La0.8Hf0.2OBiS2 are displayed between 0.36 K and 30 K in Fig. 11. The upper inset of Fig. 11 highlights the linear fit to the data plotted vs. , from which we extracted mJ/mol-K2 and mJ/mol-K4, and calculated K. In the inset in the lower right hand side of the figure, the electronic contribution to the specific heat vs. is shown, which has been obtained by subtracting the lattice contribution from . Absent from these data is any clear evidence for a jump at the obtained from either the electrical resistivity or DC and AC magnetic susceptibility ( = 2.36 K, 2.81 K and 1.42 respectively) measurements. However, there is a small feature around the obtained from the electrical resistivity ( = 2.36 K) as indicated by an arrow in the lower right hand side of the figure. The absence of a well-defined superconducting jump at is probably a consequence of the superconducting transition being spread out in temperature due to sample inhomogeneity.
There is an upturn in specific heat below roughly 1.2 K and 0.9 K for the La0.8Hf0.2OBiS2 and La0.85Th0.15OBiS2 samples, respectively. The same kind of upturn is also seen in Sr0.5La0.5FBiS2 at a similar temperature. This upturn may be a contribution to specific heat from a Schottky anomaly or may be indicative of a second superconducting phase in this compound.Lin et al. (2013) However, measurements must be made at temperatures below 0.36 K to unambiguously clarify the nature of this feature.
IV Discussion
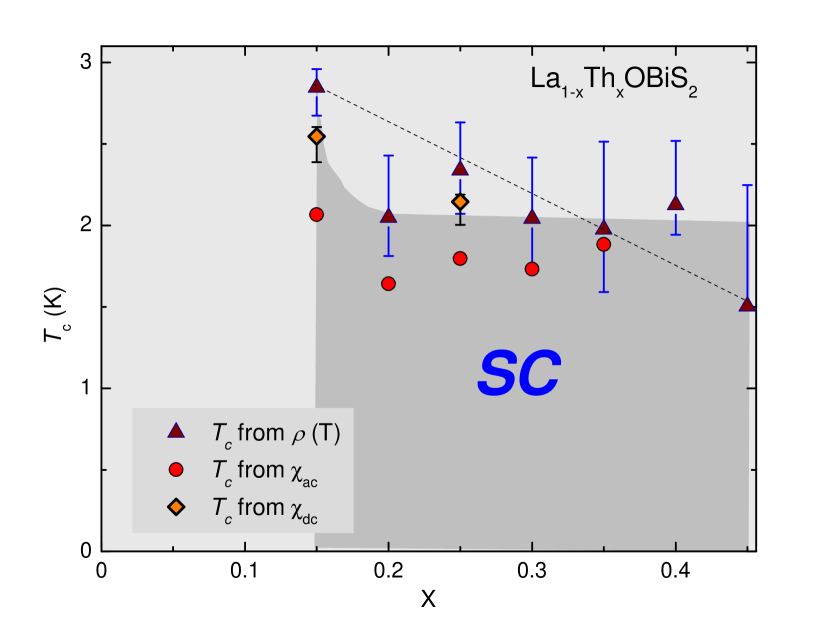
The results from , , and measurements are summarized in a phase diagram of vs. Th concentration shown in Fig. 12. decreases with from 2.85 K at = 0.15 to 2.05 K at = 0.20 and exhibits roughly concentration-independent behavior at higher concentration. The superconducting region may be defined by the dark gray region in Fig. 12, and apparently lacks a dome-like character typically seen for both the high- layered cuprate and Fe-pnictide superconductors. Dome-like superconductor regions are also seen in LaO1-xFxBiS2, and NdO1-xFxBiS2. Deguchi et al. (2012); Demura et al. (2012) At concentrations below the SC domes in these compounds, electrical resistivity measurements reveal bad metal or semiconducting-like behavior. These results are in agreement with first principle calculations Yildirim (2012) which suggest that the density of states at the Fermi level increases with increasing electron doping, such that the insulating parent compound becomes metallic. This effect is expected to be maximal at half filling ( = 0.5). The LaO1-xFxBiS2 system Deguchi et al. (2012) shows a maximum for = 0.5 while the NdO1-xFxBiS2 Demura et al. (2012) system exhibits its highest at = 0.3. Other scenarios may be possible depending on how we define the SC region because of the broadness of the superconducting transitions. For example, a dashed line is also shown in Fig. 12 which mostly resides within the ranges characterized by the transition. In order to better define the phase boundary, studies on samples with sharper transitions would be beneficial.
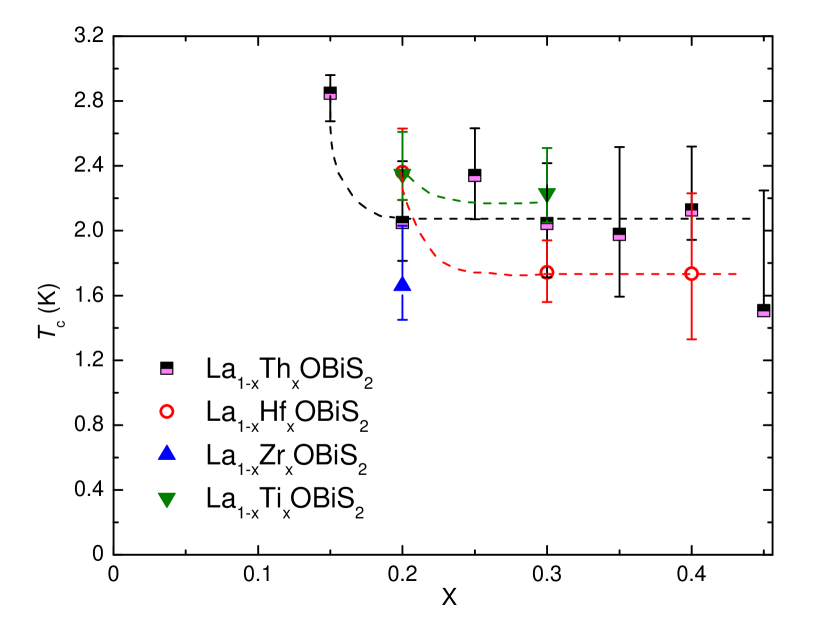
A similar result can be seen in Fig. 13 where the highest is observed at = 0.2 for Hf, Zr and Ti doping. decreases initially with increasing and then becomes concentration-independent. Since the ionic sizes of Th, Hf, Zr, and Ti are similar, the ’ s are also very close to each other. The character of observed for LaOBiS2 and displayed in the phase diagram suggests that the superconducting state is similar for these systems. Considering other examples of inducing superconductivity by electron doping such as in LaO1-xFxBiS2Yazici et al. (2012); Mizuguchi et al. (2012b); Jha et al. (2012); Deguchi et al. (2012); Awana et al. (2012); Demura et al. (2012) and Sr1-xLaxFBiS2,Lin et al. (2013) our results suggest that electron doping is a viable approach to induce superconductivity in BiS2 based compounds.
V Concluding remarks
In summary, we have synthesized polycrystalline samples of La1-xOBiS2 ( = Th, Hf, Zr, Ti, and Sr) with the ZrCuSiAs crystal structure. Electrical resistivity, DC and AC magnetic susceptibility, and specific heat measurements were performed on selected samples. Electron doping via substitution of tetravalent Th+4, Hf+4, Zr+4, Ti+4 for trivalent La+3 induces superconductivity while hole doping via substitution of divalent Sr+2 for La+3 does not. These results strongly suggest that electron doping by almost any means may be sufficient to induce superconductivity in BiS2-based compounds.
Acknowledgements.
The authors gratefully acknowledge the support of the US Air Force Office of Scientific Research - Multidisciplinary University Research Initiative under Grant No. FA9550-09-1-0603 and the US Department of Energy under Grant No. DE-FG02-04-ER46105.References
- Mizuguchi et al. (2012a) Y. Mizuguchi, H. Fujihisa, Y. Gotoh, K. Suzuki, H. Usui, K. Kuroki, S. Demura, Y. Takano, H. Izawa, and O. Miura, Phys. Rev. B 86, 220510(R) (2012a).
- Li et al. (2012) B. Li, Z. W. Xing, and G. Q. Huang, arXiv p. 1210.1743 (2012).
- Jha et al. (2012) R. Jha, A. Kumar, S. K. Singh, and V. P. S. Awana, arXiv p. 1208.5873 (2012).
- Deguchi et al. (2012) K. Deguchi, Y. Mizuguchi, S. Demura, H. Hara, T. Watanabe, S. J. Denholme, M. Fujioka, H. Okazaki, T. Ozaki, H. Takeya, et al., arXiv p. 1209.3846 (2012).
- Kotegawa et al. (2012) H. Kotegawa, Y. Tomita, H. Tou, H. Izawa, Y. Mizuguchi, O. Miura, S. Demura, K. Deguchi, and Y. Takano, J. Phys. Soc. Jpn. 81, 103702 (2012).
- Awana et al. (2012) V. P. S. Awana, A. Kumar, R. Jha, S. Kumar, A. Pal, Shruti, J. Saha, and S. Patnaik, arXiv p. 1207.6845 (2012).
- Demura et al. (2012) S. Demura, Y. Mizuguchi, K. Deguchi, H. Okazaki, H. Hara, T. Watanabe, S. J. Denholme, M. Fujioka, T. Ozaki, H. Fujihisa, et al., arXiv p. 1207.5248 (2012).
- Mizuguchi et al. (2012b) Y. Mizuguchi, S. Demura, K. Deguchi, Y. Takano, H. Fujihisa, Y. Gotoh, H. Izawa, and O. Miura, J. Phys. Soc. Jap. 81, 114725 (2012b).
- Xing et al. (2012) J. Xing, S. Li, X. Ding, H. Yang, and H.-H. Wen, arxiv p. 1208.5000 (2012).
- Yazici et al. (2012) D. Yazici, K. Huang, B. D. White, A. H. Chang, A. J. Friedman, and M. B. Maple, Philos. Mag. 93, 673 (2012).
- Zhano et al. (2008) J. Zhano, Q. Huang, C. D. L. Cruz, C. Li, J. W. Lynn, Y. Chen, M. A. Green, G. F. Chen, G. Li, Z. Li, et al., Nature Materials 7, 953 (2008).
- Alff et al. (2003) L. Alff, Y. Krockenberger, B. Welter, R. Gross, D. Manske, and M. Naito, Nature (London) 422, 698 (2003).
- Paglione and Greene (2010) J. Paglione and R. L. Greene, Nature Physics 6, 645 (2010).
- Johnston (2010) D. C. Johnston, Advances in Physics 59 (2010).
- Mazin (2010) I. I. Mazin, Nature 464 (2010).
- Okada et al. (2008) H. Okada, K. Igawa, H. Takahashi, Y. Kamihara, M. Hirano, H. Hosono, K. Matsubayashi, and Y. Uwatoko, Journal of the Physical Society of Japan 77, 113712 (2008).
- Hamlin et al. (2008) J. J. Hamlin, R. E. Baumbach, D. A. Zocco, T. A. Sayles, and M. B. Maple, Journal of Physics: Condensed Matter 20, 365220 (2008).
- Kamihara et al. (2008a) Y. Kamihara, H. Hiramatsu, M. Hirano, R. Kawamura, H. Yanagi, T. Kamiya, and H. Hosono, Journal of Physics: Condensed Matter 20, 365220 (2008a).
- Tegel et al. (2008) M. Tegel, I. Schellenberg, R. Pöttgen, and D. Johrendt, Z. Naturforsch. B - Chem. Sci. 63, 1057 (2008).
- Kamihara et al. (2008b) Y. Kamihara, T. Watanabe, M. Hirano, and H. Hosono, Journal of the American Chemical Society 130, 3296 (2008b).
- Chen et al. (2008a) G. F. Chen, Z. Li, D. Wu, G. Li, Z. Hu, J. Dong, P. Zheng, J. L. Luo, and N. L. Wang, Physical Review Letters 100, 247002 (2008a).
- Ren et al. (2008a) Z. A. Ren, W. Lu, J. Yang, W. Yi, X. L. Shen, Z. C. Li, G. C. Che, X. L. Dong, L. L. Sun, F. Zhou, et al., Chinese Physics Letters 25, 2215 (2008a).
- Ren et al. (2008b) Z. A. Ren, J. Yang, W. Lu, W. Yi, G. C. Che, X. L. Dong, L. L. Sun, and Z.-X. Zhao, Materials Research Innovations 12, 105 (2008b).
- Ren et al. (2008c) Z.-A. Ren, J. Yang, W. Lu, W. Yi, X. L. Shen, Z. C. Li, G. C. Che, X. L. Dong, L. L. Sun, F. Zhou, et al., Europhysics Letters 82, 57002 (2008c).
- Chen et al. (2008b) X. H. Chen, T. Wu, R. H. Liu, H. Chen, and D. F. Fang, Nature 453, 761 (2008b).
- Sefat et al. (2008) A. S. Sefat, A. Huq, M. A. McGuire, R. Jin, B. C. Sales, D. Mandrus, L. M. D. Cranswick, P. W. Stephens, and K. H. Stone, Physical Review B 78, 104505 (2008).
- Wen et al. (2008) H.-H. Wen, G. Mu, L. Fang, H. Yang, and Y. Zhu, Europhysics Letters 82, 17009 (2008).
- Wang et al. (2008) C. Wang, L. Li, S. Chi, Z. Zhu, Z. Ren, Y. Li, Y. Wang, X. Lin, Y. Luo, S. Jiang, et al., Europhysics Letters 83, 67006 (2008).
- Ren et al. (2008d) Z.-A. Ren, G.-C. Che, X.-L. Dong, J. Yang, W. Lu, W. Yi, X.-L. Shen, Z.-C. Li, L.-L. Sun, F. Zhou, et al., Europhysics Letters 83, 17002 (2008d).
- Yang et al. (2008) J. Yang, Z.-C. Li, W. Lu, W. Yi, X.-L. Shen, Z.-A. Ren, G.-C. Che, X.-L. Dong, L.-L. Sun, F. Zhou, et al., Superconductor Science and Technology 21, 082001 (2008).
- Yildirim (2012) T. Yildirim, arXiv p. 1210.2418 (2012).
- Lee et al. (2012) J. Lee, M. B. Stone, A. Huq, T. Yildirim, G. Ehlers, Y. Mizuguchi, O. Miura, Y. Takano, K. Deguchi, S. Demura, et al., arXiv p. 1212.4811 (2012).
- Shein and Ivanovskii (2012) I. R. Shein and A. L. Ivanovskii, arXiv p. 1211.3818 (2012).
- Wan et al. (2012) X. Wan, H.-C. Ding, S. Y. Savrasov, and C.-G. Duan, arXiv p. 1208.1807 (2012).
- Rietveld (1969) H. M. Rietveld, J. Appl. Cryst. 2, 65 (1969).
- Larson and Von Dreele (1994) A. C. Larson and R. B. Von Dreele, General Structure Analysis System (GSAS), Los Alamos National Laboratory Report (1994).
- Toby (2001) B. H. Toby, J. Appl. Cryst. 34, 210 (2001).
- Safar et al. (1992) H. Safar, P. L. Gammel, D. A. Huse, D. J. Bishop, J. P. Rice, and D. M. Ginsberg, Phys. Rev. Lett. 69, 824 (1992).
- Werthamer et al. (1966) N. R. Werthamer, E. Helfand, and P. C. Hohenberg, Physical Review 147, 1 (1966).
- Lin et al. (2013) X. Lin, X. Ni, B. Chen, X. Xu, X. Yang, J. Dai, Y. Li, X. Yang, Y. Luo, Q. Tao, et al., Phys. Rev. B 87, 020504(R) (2013).