THE EXTENDED NARROW-LINE REGION OF TWO TYPE-I QUASI-STELLAR OBJECTS
Abstract
We investigate the narrow-line region (NLR) of two radio-quiet QSOs, PG1012+008 and PG1307+085, using high signal-to-noise spatially resolved long-slit spectra obtained with FORS1 at the Very Large Telescope. Although the emission is dominated by the point-spread function of the nuclear source, we are able to detect extended NLR emission out to several kpc scales in both QSOs by subtracting the scaled central spectrum from outer spectra. In contrast to the nuclear spectrum, which shows a prominent blue wing and a broad line profile of the [O III] line, the extended emission reveals no clear signs of large scale outflows. Exploiting the wide wavelength range, we determine the radial change of the gas properties in the NLR, i.e., gas temperature, density, and ionization parameter, and compare them with those of Seyfert galaxies and type-II QSOs. The QSOs have higher nuclear temperature and lower electron density than Seyferts, but show no significant difference compared to type-II QSOs, while the ionization parameter decreases with radial distance, similar to the case of Seyfert galaxies, For PG1012+008, we determine the stellar velocity dispersion of the host galaxy. Combined with the black hole mass, we find that the luminous radio-quiet QSO follows the local relation of active galactic nuclei.
Subject headings:
galaxies: active – quasars: emission lines, , , , , ,
I. INTRODUCTION
Since the discovery of correlations between the mass of black holes (BHs) and the properties of their host-galaxy bulges (Magorrian et al., 1998; Ferrarese & Merritt, 2000; Gebhardt et al., 2000), the interplay between active galactic nuclei (AGNs) — thought to represent a stage of galaxy evolution in which BH is actively growing through accretion — and their host galaxies has received much attention. In particular, AGN feedback seems to provide a promising way to drive these relations by quenching both star-formation and accretion onto the BH, thus self-regulating BH growth (e.g., Di Matteo et al., 2005; Hopkins et al., 2006; Sironi & Socrates, 2010).
Recently, there has been growing observational support for such a scenario for various AGNs, e.g., radio-loud quasars (e.g., Nesvadba et al., 2008; Fu & Stockton, 2009), broad-absorption line quasars (e.g., Crenshaw et al., 2003; Moe et al., 2009), local ultra-luminous infrared galaxies (e.g., Fischer et al., 2010; Feruglio et al., 2010; Sturm et al., 2011; Rupke & Veilleux, 2011), and high redshift AGNs (e.g., Tremonti et al., 2007; Alexander et al., 2010; Hainline et al., 2011). These observations are, however, often restricted to a handful of sources. Moreover, it is difficult to determine the kinetic energy involved and to prove that the observed outflows are indeed galaxy-scale radiatively-driven AGN outflows (compared to outflows driven by e.g., star formation or jets).
One approach in the quest for observational signatures of AGN feedback is to focus on the emission-line regions in the vicinity of the BH: the so-called broad-line region (BLR) and narrow-line region (NLR), which are photoionized by the central engine. While BLRs are confined to sub-pc scales around an accretion disk, producing kinematically broadened emission lines with typical velocities of km s-1, NLRs, characterized by narrow-lines with typical velocities of km s-1, can span over kpc scales, which are comparable to the size of the bulge or even the entire galaxy (Boroson & Oke, 1984; Stockton & MacKenty, 1987). Thus, as a direct interface between the AGN and its host galaxy, the NLR can provide important clues on the impact of BHs on their host galaxies and vice versa.
The NLR of Seyfert galaxies has been studied extensively over the last decades (e.g., Mulchaey et al., 1996; Ho et al., 1997; Schmitt et al., 2003; Falcke et al., 1998; Bennert et al., 2002; Stoklasová et al., 2009). While most earlier studies have focused on the extent and morphology of the NLR, the interplay between radio emission and NLR, and implications for the unified model of AGNs (see Antonucci, 1993, for review), the goal of recent studies is to search for imprints of AGN feedback, e.g., in the form of outflowing gas (Schlesinger et al., 2009; Müller-Sánchez et al., 2011).
In particular, the forbidden [O III] 5007 (hereafter [O III]) emission line is well known to show blue wings, which are generally interpreted as a sign of outflow (see Crenshaw et al., 2010, and references therein). To study the kinematics of the ionized gas, spectroscopy of the extended NLR is essential. However, such a study is especially challenging for the most promising candidates to exhibit AGN feedback, high-luminosity QSOs, due to the presence of their bright nuclei.
Recent studies have thus focused on type-II (obscured) QSOs that have been discovered in large numbers from the Sloan Digital Sky Survey (SDSS; Zakamska et al., 2003; Reyes et al., 2008). For example, Greene et al. (2011) studied 15 luminous type-II QSOs at low-redshift () with spatially resolved spectroscopy. Comparing the extent of the continuum and [O III] emission, they argue that the AGN is ionizing the interstellar medium in the entire host galaxy. The large velocity dispersion of this ionized gas out to kpc scales suggests that the gas is disturbed on galactic scale. However, the velocity dispersion is below 500 km s-1 for most objects in their sample, and the overall escaping fraction is less than 25% with a median of 2%, even in the most extreme cases. Similarly, Villar-Martín et al. (2011) report blue asymmetry of the [O III] emission line in 11 objects out of a sample of 13 type-II quasars at . They interpret the asymmetry as a signature of outflows within a few kpc from the central engine. Furthermore, they find an anticorrelation between the degree by which the kinematics of the outflow is perturbed and its contribution to the total [O III] flux, suggesting that only a small fraction of the total mass of the ionized gas is involved in the outflow.
With this line of evidence for type-II quasars, we here study the NLR of type-I QSOs, PG1012+008 and PG1307+085 with spatially resolved spectroscopy. Benefiting from the wide spectral range and excellent seeing condition, we investigate the kinematics and physical conditions of the NLR as a function of radial distance. Throughout the paper, we assume a Hubble constant of = 70 km s-1 Mpc-1, = 0.7, and = 0.3.
| Name | Exposure | P.A. | Seeing | S/N | Scale | |||||
|---|---|---|---|---|---|---|---|---|---|---|
| (s) | (deg) | (″) | (pixel-1) | (kpc arcsec-1) | (Mpc) | ( erg s-1) | ( erg s-1 ) | (″) | ||
| (1) | (2) | (3) | (4) | (5) | (6) | (7) | (8) | (9) | (10) | (11) |
| PG1012+008 | 0.187 | 7400 | 142 | 472–26 | 3.1 | 909.4 | 4.94 | 1.13 | 3.4 | |
| PG1307+085 | 0.155 | 6800 | 112 | 507–5 | 2.7 | 739.2 | 4.53 | 1.41 | 1.3 |
Note. — Column 1. object name. Column 2. redshift determined from [O II] 3727. Column 3. total exposure time. Column 4. position angle of the slit. Column 5. seeing condition. Column 6. signal-to-noise ratio at 5100 Å from the center to the outermost aperture. Column 7. angular diameter distance. Column 8. luminosity distance. Column 9. [O III] luminosity measured from Bennert et al. (2002). Column 10. -band luminosity from Elvis et al. (1994). Column 11. effective radius derived from two-dimensional de Vaucouleurs fits to the surface brightness profile given in Bahcall et al. (1997).
II. OBSERVATIONS AND DATA REDUCTION
II.1. Sample Selection
To study the NLR of luminous quasars, we started with the seven low-redshift Palomar-Green (PG) quasars (Schmidt & Green, 1983), for which [O III] narrow-band imaging was obtained with the Hubble Space Telescope (HST) by Bennert et al. (2002). Out of these seven objects, we selected those with the most extended NLR that were visible from the Very Large Telescope (VLT), and at a redshift range that allowed us to cover the broadest range of emission lines in optical spectra. As a result, we selected two such objects, PG1012+008 () and PG1307+085 (), with an NLR size of 159 ( kpc) and 139 ( kpc), respectively, based on the HST images (Bennert et al., 2002). The morphology of the [O III] emission is symmetric and compact in general (Leipski et al., 2006). The surface brightness at the edge of the NLRs is erg s-1cm-2arcsec-2 ( detection).
These two QSOs were also studied with the Wide-Field Camera on-board HST (Bahcall et al., 1997), and with the Very-Large Array in the radio (Leipski et al., 2006). Here, we briefly summarize the properties of the host galaxies and the radio emission of the sample based on these previous studies. The optical image of PG1012+008 reveals a complex morphology: It is undergoing a major merger with a companion galaxy at 33 ( kpc) to the east, exhibiting clear tidal-tail structure. Another smaller, compact galaxy at 68 ( kpc) north of the QSO may also be interacting with the two galaxies. In the case of PG1307+085, the host galaxy is an isolated small elliptical galaxy.
Both QSOs are radio-quiet with total fluxes less than 0.3 mJy at 8.4 GHz for PG1012+008 and 4.8 GHz for PG1307+085 (Leipski et al., 2006). The isophotes of [O III] and the radio continuum show similar structure in both objects on a scale of ″, implying a radio-NLR interaction. Particularly for PG1012+008, a “bending” in the isophotes is apparent in the [O III] and radio images in the SE direction, although it is unclear what role is played by the merger.
The radial change of the [O III] line profile of both PG QSOs and its connection to the radio emission was investigated by Leipski & Bennert (2006) based on the spectra obtained at the New Technology Telescope at the European Southern Observatory (ESO). Investigating the substructures of the [O III] line profile, they note that jet-gas interaction plays a role in the NLRs of radio-quiet quasars. Although their method of analysis, i.e., spatially-resolved spectroscopy, is similar to ours, we present a more complete view on the NLRs using superior data with better spatial resolutions, wider wavelength ranges, and far higher signal-to-noise ratios (S/Ns), though we miss some kinematic subcomponents identified due to relatively lower spectral resolution.
II.2. Observations
To investigate the properties of the NLR based on spatially resolved spectra, we observed PG1012+008 and PG1307+085 with the visual and near-UV FOcal Reducer and low dispersion Spectrograph (FORS1) at the VLT on 2005 April 1 and 3. To achieve high spatial resolution, the observations were carried out under good seeing conditions (). A slit width of 07 was chosen to match the seeing. Based on the [O III] narrow-band images, we aligned the position angle of the slit with the maximum radial extent of the [O III] emission. The spatial resolution is 02 pixel-1. We used grism 300V with an order sorting filter GG375, covering a spectral range of 3300–7180 Å with 2.6 Å pixel-1. The instrumental broadening (), determined from arc lamps and sky lines, is 216 km s-1 at 5000 Å. For flux calibrations, we observed a spectrophotometric standard star G60-54. Table 1 summarizes the observations.
II.3. Data Reduction
Standard data reduction, i.e., bias subtraction, flat-fielding, wavelength calibration, flux calibration, and atmospheric absorption correction was carried out using a series of IRAF scripts developed for long-slit spectroscopy (e.g., Woo et al., 2005, 2006). Cosmic rays were removed using L.A.Cosmic (van Dokkum, 2001). We performed wavelength calibration using arc lines and obtained a spectral resolution of 2.6 Å pixel-1 with standard deviation of Å.
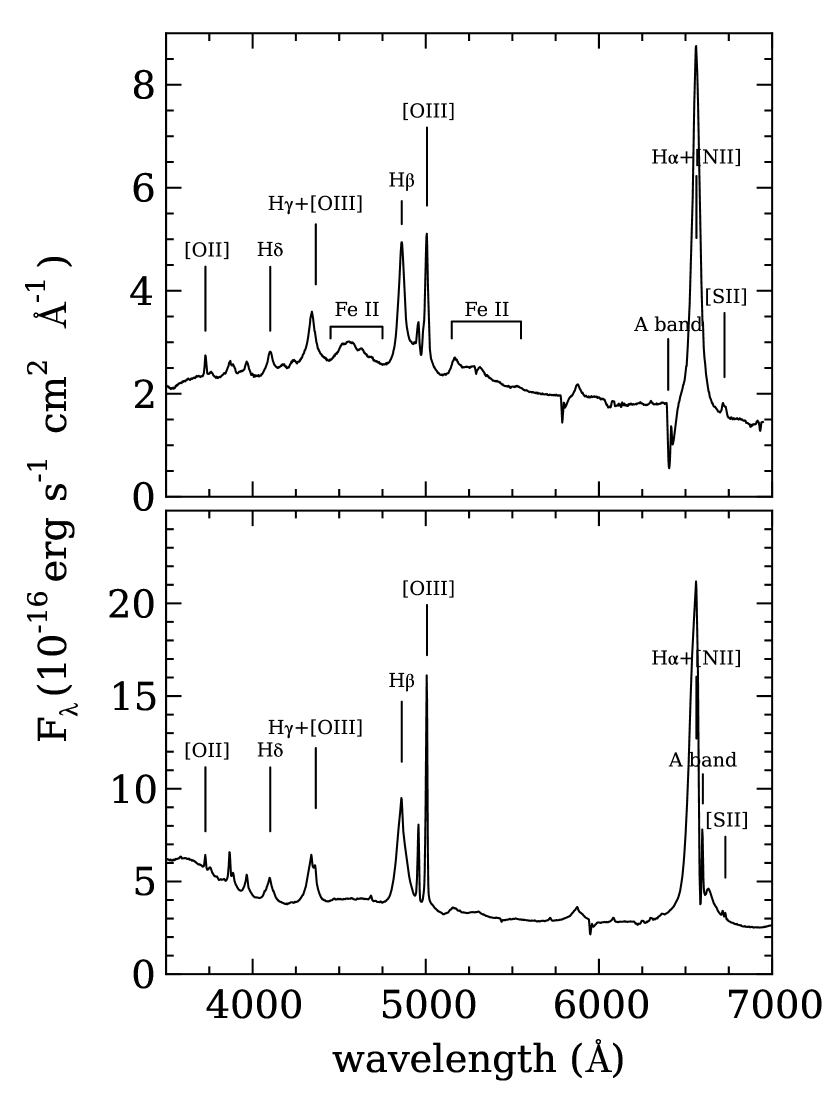
We extract seven spectra along the slit (spatial direction), covering . Positive direction indicates SE and NW for PG1012+008 and PG1307+085, respectively. The aperture size was increased from 06 at the center to 18 at the outer radii by a step of 04, in order to boost the S/N. Figure 1 presents the spectra extracted from the central aperture for both targets. Note that the region near H suffers from the atmospheric absorption ( band). We attempted a correction using the standard star spectra. However, we were unable to measure the [N II] and narrow H emission lines, due to the dominance of the broad H line.
III. RESULTS
III.1. Extended Narrow-line Region
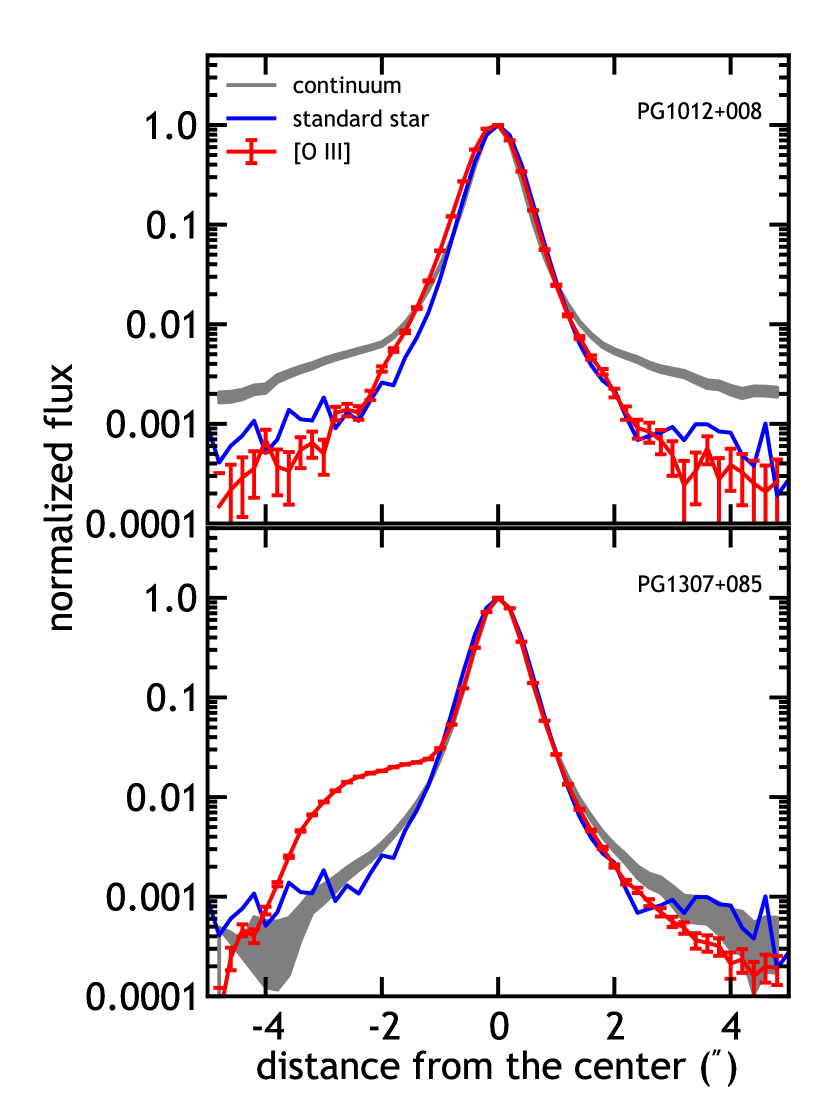
We analyze spatially resolved spectra to investigate the spatial extension of the NLR. First, to compare the relative strength of the emission between the central and extended regions, we determine the spatial profiles of [O III], continuum, and standard star, respectively. In the case of the continuum, which is dominated by the AGN and thus expected to be spatially broadened by the seeing effect, we collapse the spectra in the continuum wavelength range 5080–5120 Å to determine the spatial profile. For [O III], we sum the flux in a spectral range of Å centered on the peak of [O III], and subtract the continuum level previously determined. We also determine the point-spread function (PSF) based on the spectral image of the standard star. Figure 2 presents the spatial profiles of both targets, which are normalized by their maximum flux value. In the case of PG1012+008, the continuum spatial profile is consistent with the PSF in the inner region at -1″ ″, while at the outer region, the contribution of the host galaxy star light becomes dominant as indicated by a broad extension in the spatial profile. Although the spatial profile of [O III] is dominated by the PSF, the left side of the profile is slightly extended over the PSF or the continuum spatial profile. In the case of PG1307+085, we detect an asymmetric profile of [O III] with a distinct bump at ″, representing an extended NLR. Thus, we conclude that the [O III] NLR in both objects is marginally detected.
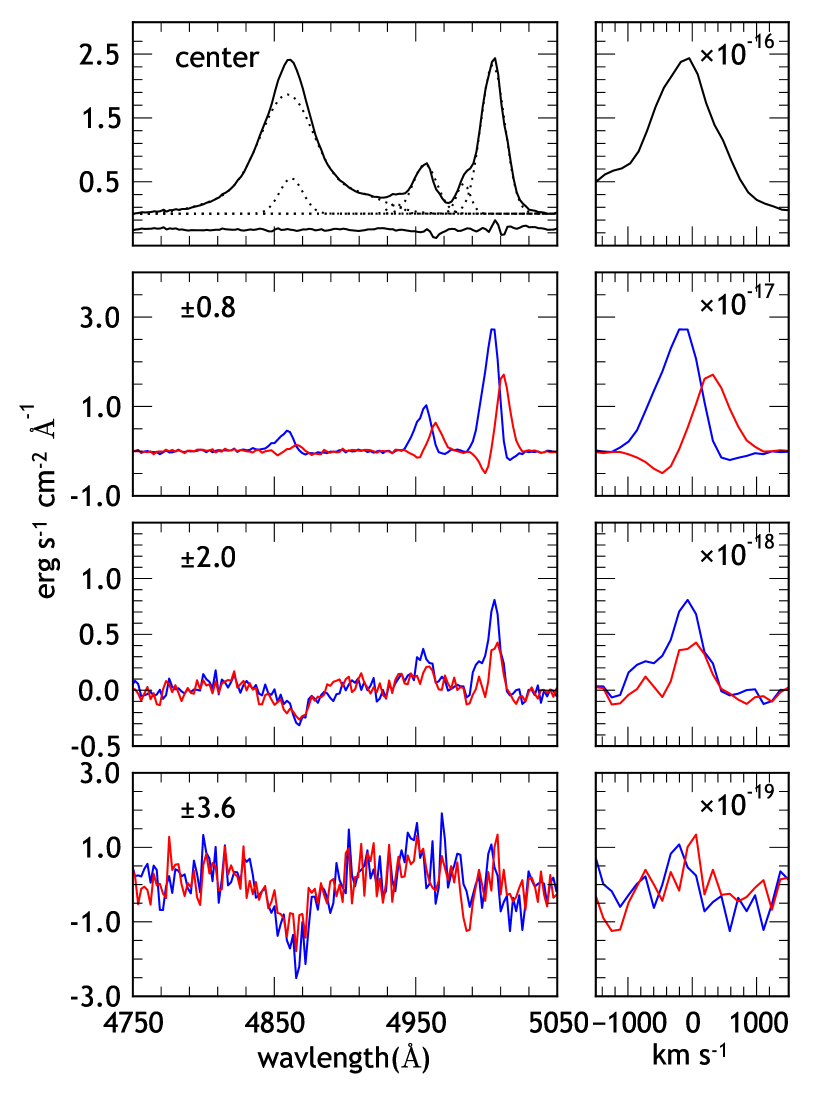
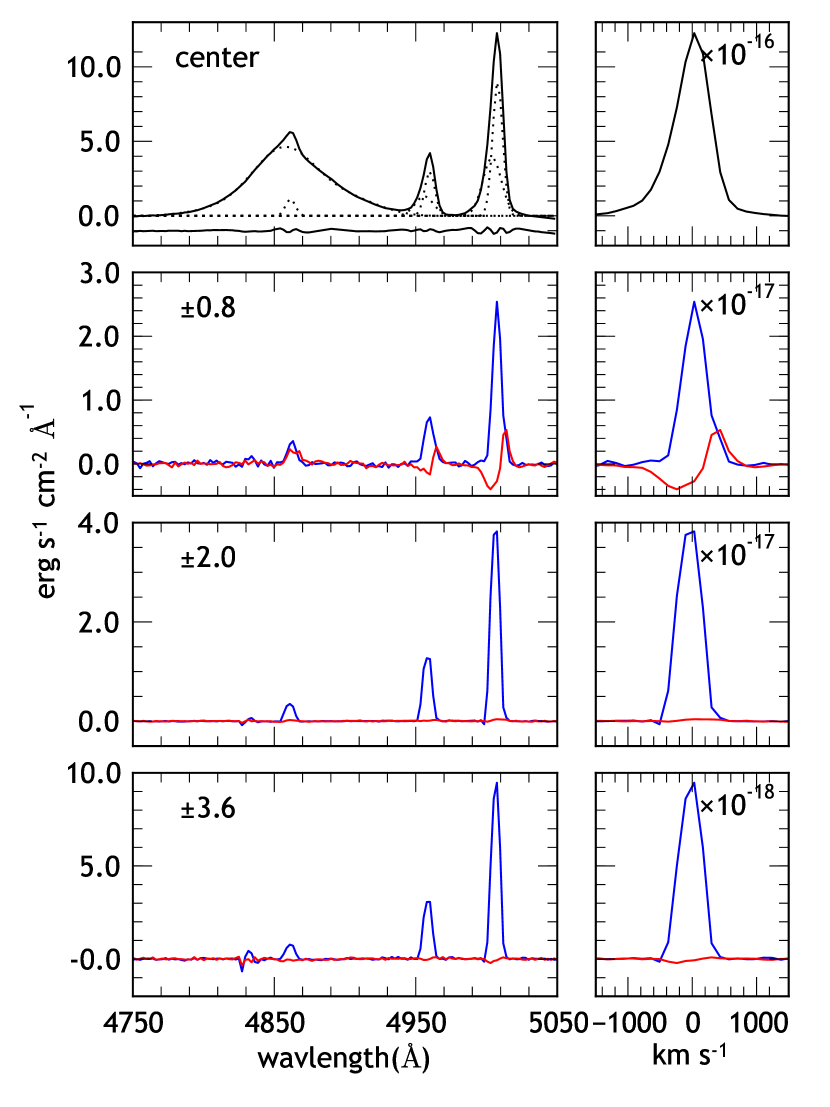
To further test whether the [O III] emission in the off-center region is consistent with being the PSF wings of the [O III] emission from the center, we use the central spectrum of each object as a template to subtract the seeing-scattered broad and narrow lines from the outer spectra. For generating a template of the central spectrum, we fit the continuum and the broad component of H (see the top panel of Figure 3), then combine the best fit models with the profiles of the narrow H and [O III]. To account for the contribution from the host galaxy star light, we also add a linear background level.
Figure 3 presents the continuum-subtracted central spectrum (top panel) and residual spectra of outer region after subtracting a scaled central spectrum (middle and bottom panels). The strong broad H component observed at the outer spectra is well subtracted along with the contribution of the PSF wings of narrow emission lines from the center, leaving a flat continuum and residual narrow emission lines. These residual [O III] and H lines represent the extended NLR in both objects. As expected from the investigation of spatial profiles (Figure 2), both objects show very different spectra as the distance from the center increases. For PG1012+008, the extended [O III] emission is detected out to ″ with similar flux on either side, while PG1307+085 shows the extended emission only on one side. The host galaxy starlight, e.g., H absorption, starts to show at ″ for PG1012+008, while it is not visible in PG1307+085, presumably due to a higher contrast of the nuclear AGN luminosity to the host galaxy star light. Thus, we detect the extended NLR emission out to ( kpc), which is larger than the sizes measured by Bennert et al. (2002) since the depth of our observation is roughly 20 times larger.
The central spectrum of both targets shows an asymmetric [O III] line profile with prominent blue wings, which can be interpreted as outflows. To properly measure the velocity of [O III], we model the H–[O III] region of the central spectrum as follows: First, we use a power law + IZwI template from Boroson & Green (1992) to fit strong Fe II multiplets in the central spectrum of PG1012+008. For PG1307+085, the Fe II emission is an order of magnitude weaker (compared to the continuum) and considered negligible. Then, we model the [O III] line profile with two Gaussians along with broad and narrow H. We use Gauss-Hermite polynomials of order six for the broad component of H, and the ratio of the two [O III] lines is fixed to the theoretical value (1/3). The best-fit models of the continuum-subtracted central spectra are shown in the top panels of Figure 3.
The “blue” component of [O III], presumably representing the outflowing gas, is blueshifted from the reference redshift by km s-1 and km s-1 for PG1012+008 and PG1307+085, respectively. The full width at half maximum (FWHM) velocity of the total line profile measured from the central spectra is km s-1 for PG1012+008 and km s-1 for PG1307+085, respectively. In contrast, as shown in Figure 3, the extended [O III] emission is narrower than the [O III] in the central spectrum for both objects, and most of the line flux is coming from low velocity gas ( km s-1). This indicates that the outflowing component with km s-1 is unresolved at the spatial resolution of our current observation and confined to within 0″7 scale (2 kpc). Thus, the emission-line profile of the extended gas indicates that the extended gas is kinematically quiescent in both QSOs. We conclude that while we detect extended emission out to (6 kpc), there are no signs of a large-scale( kpc) outflow.
We briefly compare our results with those by Leipski & Bennert (2006). The red asymmetry towards the south of the nucleus in PG1012+008 detected by Leipski & Bennert (2006) may correspond to the redshifted residual [O III] line at 08. We miss some of the complex velocity structure seen by Leipski & Bennert (2006) due to lower spectral resolution. As noted by Leipski & Bennert (2006), PG1307+085 shows a dramatic change in line profile especially to the SE (“minus” in this study) side. The residual narrow line to the SE of PG1307+08 is unresolved at our spectral resolution. Leipski & Bennert (2006) report a velocity dispersion of km s-1 for this component, which is consistent with our results. While our results are in overall agreement with those presented in Leipski & Bennert (2006), given the differences in spectral resolution and S/N, we find that the broad [O III] line profile of PG1307+085 towards the south is consistent with being a PSF wing rather than true physical extension of outflowing gas.
The [O III]/H line ratio is a diagnostic of the ionization mechanism (Baldwin et al., 1981). In the case of PG1012+008, we cannot rule out that the ionization of the extended gas is at least partially due to star formation. For PG1307+085, however, the high () [O III]/H ratio at from the center suggests that the QSO is the main source of ionization.
| Name | aaThe bolometric correction factor for is taken from Netzer (2009). | bbFrom Vestergaard & Peterson (2006). | ccMeasured at 2″ from the center. | |||
|---|---|---|---|---|---|---|
| (erg s-1) | (erg s-1) | (km s-1) | (km s-1) | |||
| PG1012+008 | 0.16 | 44.3 | 45.0 | 1729 | 8.42 | 19630 |
| PG1307+085 | 0.14 | 44.2 | 45.0 | 1885 | 8.50 |
III.2. Physical Conditions
In this section, we measure temperature, density, and ionization parameter of our targets to compare them with other AGNs.
III.2.1 Temperature and Density
We determined the temperature of the NLR gas using the [O III] (4959 + 5007)/4363 ratio as outlined in Osterbrock (1989):
| (1) |
where, is electron density and is gas temperature. With typical values of = cm-3 and K, the dependence on is negligible.
For PG1307+085, we were able to measure temperature and density using [O III] and [S II] line ratios from the center towards the south. The derived temperature is 25500 1480K at the center, and decreases with radial distance to 13,400 11,700K at 36 (9.7 kpc). Using the same methods, Bennert et al. (2006a, b) estimated the average temperature of four Seyfert 1 and four Seyfert 2 galaxies in the nuclear region as 33,590 7070K and 14,470 440K, respectively, while Greene et al. (2011) estimated a temperature range of K for 15 type-II QSOs. Note that the measurements of the Seyfert galaxies in Bennert et al. (2006a, b) included reddening correction determined from the Balmer decrement, while Greene et al. (2011) and this work did not correct for reddening. Note also that the physical scale in each measurements differs: for the Seyfert galaxies it corresponds to a few pc in the center, while for the type-II QSOs in Greene et al. (2011), it corresponds to 3″ fiber aperture of SDSS spectra, covering kpc at the median redshift. Although a direct comparison is not straightforward, the type-I QSO PG1307+085 reaches lower temperature at the center compared to Seyfert 1 galaxies and similar to type-II QSOs.
The density was measured in a standard way from the [S II] 6716/6731 ratio using IRAF temden task,111http://stsdas.stsci.edu/nebular/temden.html correcting for the effect of temperature using the derived values. The derived density ranges between 584 and 169 cm-3, decreasing with radial distance (0″–20). These values are similar to the mean density = 335 cm-3 of type-II QSOs estimated by Greene et al. (2011), and slightly lower than the mean nuclear density of Seyfert galaxies: 1070 180 cm-3 for Seyfert 1 galaxies (Bennert et al., 2006a) and 1100 315 cm-3 for Seyfert 2 galaxies (Bennert et al., 2006b). However, one should note that the nuclear density varies in a wide range ( 300–2500 cm-3) among Seyfert 1 and 2 galaxies studied by Bennert et al. (2006a, b), and it is not yet clear if the difference is significant. The higher and denser NLR of type-I QSOs can be a natural result of a dusty torus blocking the central region in type-II QSOs.
III.2.2 Ionization Parameter
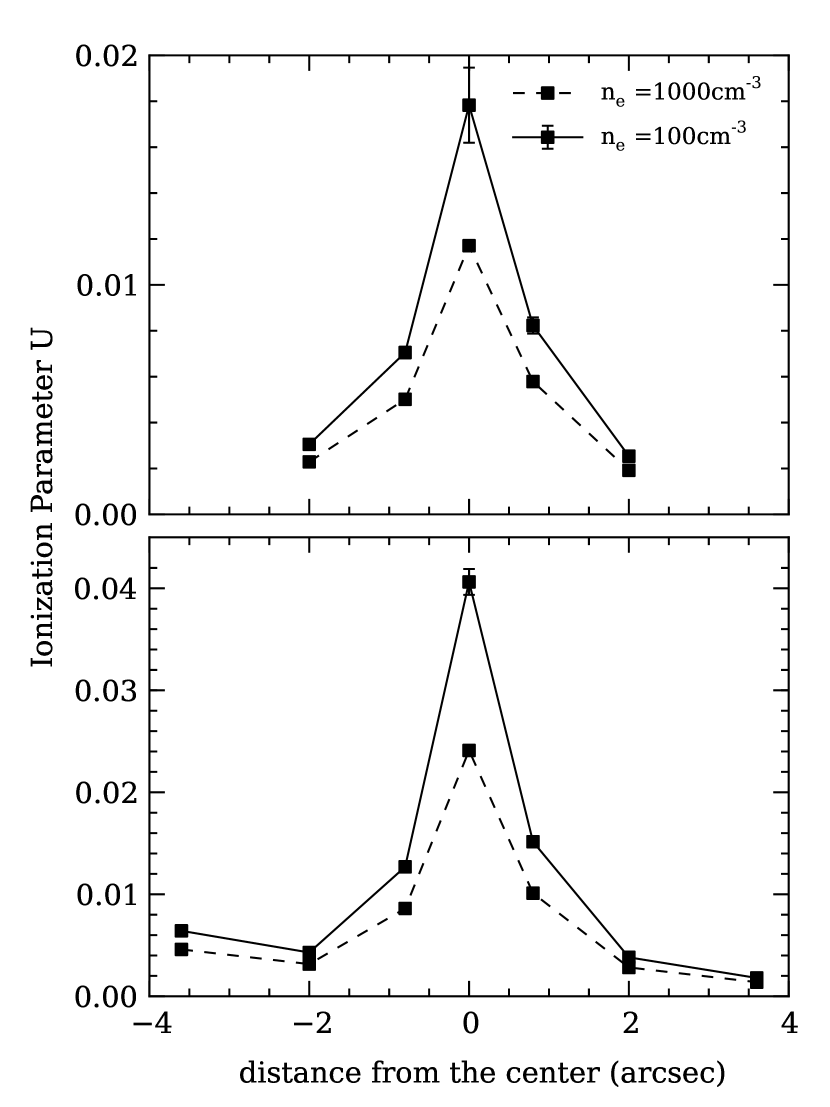
The ionization parameter is defined by the ratio of ionizing density to hydrogen density as , where is the number of the ionizing photons emitted by the AGN per second and is electron density. By measuring the emission-line flux ratio [O II] /[O III] the ionization parameter can be empirically derived (Penston et al., 1990). We estimate the ionization parameter as a function of radial distance for both targets assuming and , respectively, based on the calculations provided by Komossa & Schulz (1997, ; Figure 4).
The ionization parameter peaks at the center, and decreases with radius for both of our targets. Given that the density decreases radially as well, the actual decrease of the ionization parameter is slower than shown in either one of the curves (solid versus dashed); more accurately, it would start in the center on the dashed line and then move toward values on the solid line with increasing distance from the center.
Note that we did not apply any reddening correction to the line fluxes. If the radial decrease of the ionization parameter were entirely due to change in reddening, a simple calculation using the standard extinction curve shows that would be required between the center and the outermost apertures. Considering that the average global reddening of Seyfert 1 galaxies is (Bennert et al., 2006a), it is unlikely that the radial trend is purely caused by reddening, although there might be a small contribution from reddening.
Qualitatively, the decrease of the ionization parameter with radius is consistent with the radial trend found in Seyfert galaxies (Bennert et al., 2006a, b). The average nuclear ionization parameter of the two targets is , which is approximately five times larger than Seyfert 1 and 2 galaxies (Bennert et al., 2006a, b).
III.3. Black Hole Masses and Stellar-velocity Dispersion
We estimate BH masses from the velocity and size of the BLR based on virial assumptions (e.g., Woo & Urry, 2002; Park et al., 2012). In practice, we use the single-epoch virial mass estimator using the AGN continuum luminosity at 5100 Å () and the line dispersion of the broad H line . From the nuclear spectra extracted with an aperture of 2″ radius, including of the light, we measure and , after subtracting Fe II contamination. Compared to the values from Vestergaard & Peterson (2006), our is 0.77 dex smaller probably due to slit losses. Therefore, we use from Vestergaard & Peterson (2006).
Assuming a virial factor of (Woo et al., 2010), we calculate . Recently, Park et al. (2012) reported the systematic difference of the H line profile between the single-epoch and the rms spectra. Correcting for this effect using Equation (13) in Park et al. (2012), the mass estimates of are decreased by dex (Table 2). The estimates are consistent with those given in Vestergaard & Peterson (2006) within the errors of single-epoch BH mass ( dex).
For PG1012+008, we can also measure stellar-velocity dispersion since we clearly detect the host galaxy (at 2″ from the center). Due to the combined effect of the contamination from the AGN continuum and emission lines, and the presence of 4000 Å break, we consider the measurement based on the Ca H+K absorption lines as uncertain. In the case of the -band region, broad H affects the fitting. Thus, stellar-velocity dispersion is determined using the spectral range 5030–5300, including several strong stellar lines such as the Mg I b triplet (5172 Å) and Fe (5270 Å) (e.g., Woo et al., 2006, 2008; Greene & Ho, 2006).
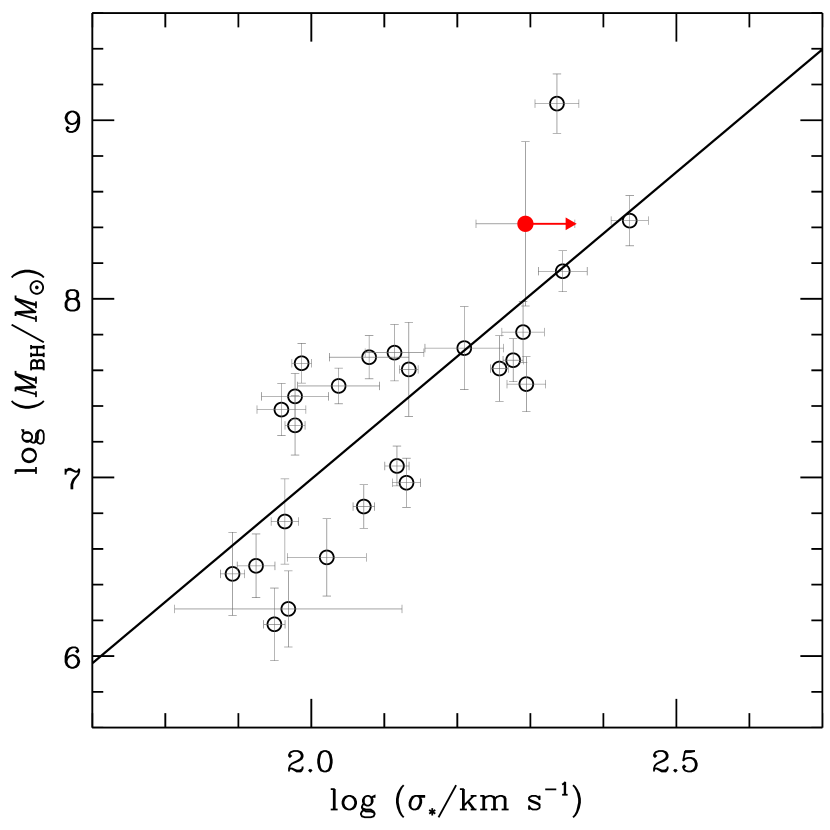
Both measurements now enable us to place the PG1012+008 on the relation in Figure 5, where the 24 reverberation-mapped AGNs and the best-fit relation from Woo et al. (2010) are overplotted for comparison. Note that the stellar velocity dispersion of PG1012+008 is measured at 2″ from the center, and can thus be considered a lower limit for the luminosity-weighted velocity dispersion of the bulge since the velocity dispersion generally increases toward the center (e.g., Kang et al., 2013). Even when taking into account an expected shift to the right, the object falls onto the local relation (Figure 5), indicating that at least this low- high-luminosity QSO is following the same relation.
IV. DISCUSSION AND SUMMARY
We investigated the kinematics and physical condition of the NLR in two type-I QSOs, PG1012+008 and PG1307+085, using spatially resolved spectroscopy. The emission from the NLRs of these two targets is dominated by a central point source with slight deviation from the expected PSFs. However, modeling the H–[O III] region of the outer spectra clearly reveals the spatially extended weak NLR out to (6 kpc) from the center, spanning a larger extent than previously reported from HST [O III] images by Leipski & Bennert (2006) due to the increase in depth of our observations. The [O III] line of the nuclear spectrum of both targets shows blue wings and broad widths with FWHM velocities exceeding km s-1. However, the same feature is not present in the outer spectra, indicating that the outflow is confined within the PSF size (2 kpc) and does not extend to galactic scales.
Compared to similar studies of type-II QSOs (Humphrey et al., 2010; Greene et al., 2011), the NLR of the two type-I QSOs studied here appears to be less extended. Due to the small sample size, and the intrinsic difficulty of inferring the true “size” of emission in long-slit observations, we are unable to draw a conclusion on whether type-I QSOs actually have less extended NLRs. Recently, Husemann et al. (2013) carried out an integral-field spectroscopy of a large sample of nearby type-I QSOs revealing a typical size of 10 kpc, similar to that of type-II QSOs studied by Greene et al. (2011). They also caution that the difference between the size determined by long-slit spectroscopy and the size based on a two-dimensional spectroscopy is on average a factor of two, and can be as high as a factor of six. Even so, the mean size of NLRs in type-I QSOs determined by Husemann et al. (2013) seems to be smaller than that of type-IIs (28 kpc) based on a comparable integral field spectroscopy by Liu et al. (2013), although these type-II QSOs are at a slightly higher redshift.
The lack of galactic scale outflows in type-I QSOs has also been pointed out by Husemann et al. (2013). Out of 31 type-I QSOs in their study, only three show kpc-scale outflow, and the spectra of extended emission generally show narrower [O III] line profile than the central QSO spectrum. In the framework of the unified model of AGNs (Antonucci, 1993), while the outflow in the projected plane may look less extended in type-Is than type-IIs, the projected velocity is expected to be larger as we look directly into the ionization cone. However, it is not yet clear whether type-Is have larger projected outflow velocities than type-IIs (see Husemann et al., 2013; Liu et al., 2013). At the same time, although the [O III] emission is expected to be more elongated or biconical for type-II QSOs, the morphology of [O III] emission seems to be more elongated in type-I QSOs (Husemann et al., 2013). It is possible that in a merger-driven evolutionary scenario (e.g., Sanders et al., 1988), AGN feedback in the ionized gas occurs mainly in obscured (type-II) phase. The sample probed here may still not be quite luminous enough to drive galactic wide energetic outflows that expel gas from the host galaxy and quench star formation as those found at high-redshift (e.g., Cano-Díaz et al., 2012). Solid evidence for large-scale outflows related to AGN feedback still remains elusive.
References
- Alexander et al. (2010) Alexander, D. M., Swinbank, A. M., Smail, I., McDermid, R., & Nesvadba, N. P. H. 2010, MNRAS, 402, 2211
- Antonucci (1993) Antonucci, R. 1993, ARA&A, 31, 473
- Bahcall et al. (1997) Bahcall, J. N., Kirhakos, S., Saxe, D. H., & Schneider, D. P. 1997, ApJ, 479, 642
- Baldwin et al. (1981) Baldwin, J. A., Phillips, M. M., & Terlevich, R. 1981, PASP, 93, 5
- Bennert et al. (2002) Bennert, N., Falcke, H., Schulz, H., Wilson, A. S., & Wills, B. J. 2002, ApJ, 574, L105
- Bennert et al. (2006a) Bennert, N., Jungwiert, B., Komossa, S., Haas, M., & Chini, R. 2006a, A&A, 459, 55
- Bennert et al. (2006b) —. 2006b, A&A, 456, 953
- Boroson & Green (1992) Boroson, T. A., & Green, R. F. 1992, ApJS, 80, 109
- Boroson & Oke (1984) Boroson, T. A., & Oke, J. B. 1984, ApJ, 281, 535
- Cano-Díaz et al. (2012) Cano-Díaz, M., Maiolino, R., Marconi, A., et al. 2012, A&A, 537, L8
- Crenshaw et al. (2003) Crenshaw, D. M., Kraemer, S. B., & George, I. M. 2003, ARA&A, 41, 117
- Crenshaw et al. (2010) Crenshaw, D. M., Schmitt, H. R., Kraemer, S. B., Mushotzky, R. F., & Dunn, J. P. 2010, ApJ, 708, 419
- Di Matteo et al. (2005) Di Matteo, T., Springel, V., & Hernquist, L. 2005, Nature, 433, 604
- Elvis et al. (1994) Elvis, M., Wilkes, B. J., McDowell, J. C., et al. 1994, ApJS, 95, 1
- Falcke et al. (1998) Falcke, H., Wilson, A. S., & Simpson, C. 1998, ApJ, 502, 199
- Ferrarese & Merritt (2000) Ferrarese, L., & Merritt, D. 2000, ApJ, 539, L9
- Feruglio et al. (2010) Feruglio, C., Maiolino, R., Piconcelli, E., et al. 2010, A&A, 518, L155
- Fischer et al. (2010) Fischer, J., Sturm, E., González-Alfonso, E., et al. 2010, A&A, 518, L41
- Fu & Stockton (2009) Fu, H., & Stockton, A. 2009, ApJ, 690, 953
- Gebhardt et al. (2000) Gebhardt, K., Bender, R., Bower, G., et al. 2000, ApJ, 539, L13
- Greene & Ho (2006) Greene, J. E., & Ho, L. C. 2006, ApJ, 641, 117
- Greene et al. (2011) Greene, J. E., Zakamska, N. L., Ho, L. C., & Barth, A. J. 2011, ApJ, 732, 9
- Hainline et al. (2011) Hainline, K. N., Shapley, A. E., Greene, J. E., & Steidel, C. C. 2011, ApJ, 733, 31
- Ho et al. (1997) Ho, L. C., Filippenko, A. V., & Sargent, W. L. W. 1997, ApJS, 112, 315
- Hopkins et al. (2006) Hopkins, P. F., Hernquist, L., Cox, T. J., et al. 2006, ApJS, 163, 1
- Humphrey et al. (2010) Humphrey, A., Villar-Martín, M., Sánchez, S. F., et al. 2010, MNRAS, 408, L1
- Husemann et al. (2013) Husemann, B., Wisotzki, L., Sánchez, S. F., & Jahnke, K. 2013, A&A, 549, A43
- Kang et al. (2013) Kang, W.-R., Woo, J.-H., Schulze, A., et al. 2013, ApJ, 767, 26
- Komossa & Schulz (1997) Komossa, S., & Schulz, H. 1997, A&A, 323, 31
- Leipski & Bennert (2006) Leipski, C., & Bennert, N. 2006, A&A, 448, 165
- Leipski et al. (2006) Leipski, C., Falcke, H., Bennert, N., & Hüttemeister, S. 2006, A&A, 455, 161
- Liu et al. (2013) Liu, G., Zakamska, N. L., Greene, J. E., Nesvadba, N. P. H., & Liu, X. 2013, MNRAS, 430, 2327
- Magorrian et al. (1998) Magorrian, J., Tremaine, S., Richstone, D., et al. 1998, AJ, 115, 2285
- Moe et al. (2009) Moe, M., Arav, N., Bautista, M. A., & Korista, K. T. 2009, ApJ, 706, 525
- Mulchaey et al. (1996) Mulchaey, J. S., Wilson, A. S., & Tsvetanov, Z. 1996, ApJS, 102, 309
- Müller-Sánchez et al. (2011) Müller-Sánchez, F., Prieto, M. A., Hicks, E. K. S., et al. 2011, ApJ, 739, 69
- Nesvadba et al. (2008) Nesvadba, N. P. H., Lehnert, M. D., De Breuck, C., Gilbert, A. M., & van Breugel, W. 2008, A&A, 491, 407
- Netzer (2009) Netzer, H. 2009, ApJ, 695, 793
- Osterbrock (1989) Osterbrock, D. E. 1989, Astrophysics of gaseous nebulae and active galactic nuclei, ed. Osterbrock, D. E.
- Park et al. (2012) Park, D., Woo, J.-H., Treu, T., et al. 2012, ApJ, 747, 30
- Penston et al. (1990) Penston, M. V., Robinson, A., Alloin, D., et al. 1990, A&A, 236, 53
- Reyes et al. (2008) Reyes, R., Zakamska, N. L., Strauss, M. A., et al. 2008, AJ, 136, 2373
- Rupke & Veilleux (2011) Rupke, D. S. N., & Veilleux, S. 2011, ApJ, 729, L27
- Sanders et al. (1988) Sanders, D. B., Soifer, B. T., Elias, J. H., et al. 1988, ApJ, 325, 74
- Schlesinger et al. (2009) Schlesinger, K., Pogge, R. W., Martini, P., Shields, J. C., & Fields, D. 2009, ApJ, 699, 857
- Schmidt & Green (1983) Schmidt, M., & Green, R. F. 1983, ApJ, 269, 352
- Schmitt et al. (2003) Schmitt, H. R., Donley, J. L., Antonucci, R. R. J., Hutchings, J. B., & Kinney, A. L. 2003, ApJS, 148, 327
- Sironi & Socrates (2010) Sironi, L., & Socrates, A. 2010, ApJ, 710, 891
- Stockton & MacKenty (1987) Stockton, A., & MacKenty, J. W. 1987, ApJ, 316, 584
- Stoklasová et al. (2009) Stoklasová, I., Ferruit, P., Emsellem, E., et al. 2009, A&A, 500, 1287
- Sturm et al. (2011) Sturm, E., González-Alfonso, E., Veilleux, S., et al. 2011, ApJ, 733, L16
- Tremonti et al. (2007) Tremonti, C. A., Moustakas, J., & Diamond-Stanic, A. M. 2007, ApJ, 663, L77
- van Dokkum (2001) van Dokkum, P. G. 2001, PASP, 113, 1420
- Vestergaard & Peterson (2006) Vestergaard, M., & Peterson, B. M. 2006, ApJ, 641, 689
- Villar-Martín et al. (2011) Villar-Martín, M., Humphrey, A., Delgado, R. G., Colina, L., & Arribas, S. 2011, MNRAS, 418, 2032
- Woo et al. (2006) Woo, J.-H., Treu, T., Malkan, M. A., & Blandford, R. D. 2006, ApJ, 645, 900
- Woo et al. (2008) —. 2008, ApJ, 681, 925
- Woo & Urry (2002) Woo, J.-H., & Urry, C. M. 2002, ApJ, 579, 530
- Woo et al. (2005) Woo, J.-H., Urry, C. M., van der Marel, R. P., Lira, P., & Maza, J. 2005, ApJ, 631, 762
- Woo et al. (2010) Woo, J.-H., Treu, T., Barth, A. J., et al. 2010, ApJ, 716, 269
- Zakamska et al. (2003) Zakamska, N. L., Strauss, M. A., Krolik, J. H., et al. 2003, AJ, 126, 2125