The uncorrelated long term -ray and X-ray variability of blazars and its implications on disk-jet coupling
Abstract
We examine the long term ( 10 years) -ray variability of blazars observed by EGRET and Fermi and find that for six sources the average flux varied by more than an order of magnitude. For two of these sources (PKS 0208-512 and PKS 0528+134), there were extensive observations (at various observing periods) by EGRET. Hence these dramatic variations are not due to a single short time-scale flare, but reflect long term changes in the average flux. Over the last twenty years, these two sources were also the target of several X-ray observatories (e.g. ROSAT, ASCA, RXTE, BeppoSAX, Chandra, Suzaku, XMM-Newton and Swift). While the ratios of the average -ray fluxes between EGRET and Fermi observations are and , their estimated keV X-ray flux do not show such dramatic variations. The X-ray emission from such flat spectrum radio quasars (FSRQs) are believed to be due to synchrotron self Compton, while -rays originate from inverse Comptonization of external soft photons from an accretion disk and/or broad line region. We argue that in this scenario, the only explanation for the uncorrelated variability is that there was an order of magnitude decrease in the external soft photons, while the jet parameters remained more or less constant. This result indicates that perhaps the accretion and jet processes are not tightly coupled in these sources.
keywords:
galaxies: active — galaxies: jets — quasars: individual: PKS 0208-512 — quasars: individual: PKS 0528+134 — gamma-rays: galaxies — X-rays: galaxies1 Introduction
Blazars are a subclass of active galactic nuclei (AGN) whose bolometric luminosity is dominated by -rays which sometimes extends to TeV energies. According to the unification scenario (Urry & Padovani, 1995), they are jet dominated sources having a small jet to line-of-sight angle. They show high variability throughout the electromagnetic spectrum, particularly in -rays which are believed to be emitted close to the base of the jet. However, the nature and emission mechanisms of the jet are still not well understood (e.g. Ferrari, 1998; Böttcher, 2007; Marscher, 2009). -ray observations of these sources can provide a better understanding of fundamental issues relating to the energetics, origin of the jet emission and possible connection to the underlying accretion disk.
COS-B satellite detected the first extragalactic -ray source (3C 273; Bignami et al. 1981). The first all sky survey in -ray was conducted by EGRET onboard CGRO (Kanbach et al., 1988; Hartman et al., 1999). EGRET detected 271 discrete sources above 100 MeV and 100 of the identified sources of EGRET catalogue are blazars (Hartman et al., 1999; Sowards-Emmerd, Romani, & Michelson, 2003; Sowards-Emmerd et al., 2004). Based on their optical line emission properties, blazars can be divided into two sub classes: flat spectrum radio quasars (FSRQs) and BL Lacs with the FSRQs being more luminous (e.g. Krolik, 1999; Kembhavi, 1999). EGRET detected significantly higher number of FSRQs than BL Lacs. The Fermi -ray space telescope (Fermi), launched in 2008, has times better sensitivity (Atwood et al., 2009) and sky coverage than EGRET, and hence it has detected sources from its more than two years of observations (Second Fermi catalogue: Nolan et al., 2012). Most of the identified Fermi sources are AGNs and the clean sample of 2nd LAT-AGN catalogue contains sources (Ackermann et al., 2011). Majority of these AGNs are blazars – BL Lacs, FSRQs, and candidate blazars of unknown type.
There have been several attempts to model spectral energy distributions (SEDs) of blazars (Boettcher 2004 and the references therein). For example, modelling the SED of the well known FSRQ 3C 279 Sikora et al. (2001), concluded that X-rays and -rays might be produced co-spatially by electrons of similar energies. They considered both synchrotron self Compton (SSC) and external Compton (EC) emission processes in their model and their results indicated that while X-rays are mainly produced via the SSC, -rays are dominated by EC process. This has been confirmed by using more detailed models and for other FSRQs (e.g., Abdo et al., 2010a; Palma et al., 2011; Sahayanathan & Godambe, 2012; Mukherjee et al., 1999).
Blazars show variability in -rays over different time scales ranging from flares as short as hour to flares extending for days or months (Hartman et al., 1999; Mattox et al., 1997; Hartman et al., 2001; Boettcher, 2004). Blazars are also variable on still longer timescales of years or decades. The most striking evidence for this is that a fraction of the EGRET detected blazars are still not detected by the more sensitive Fermi telescope. Moreover, some EGRET blazars (e.g., PKS 0208-512) were found to be mostly in the low state during Fermi observations. While there have been several studies regarding the rapid variability and flaring activity of blazars and their possible connection to varying jet parameters (e.g. Böttcher et al., 2003; Sahayanathan & Godambe, 2012), it is not clear whether the very long term ( years) variations are similar or if they are intrinsically different phenomena.
In this work we study the long term variability ( year) of FSRQ that were monitored by EGRET during its operation (1991-1997) by comparing their average EGRET flux with those measured recently by Fermi i.e. after 2007. From 1997 to 2007, there was no -ray observatory available to study these sources at GeV energies (-ray satellite AGILE was launched in 2007, but no long term monitoring has been reported).There were pointed X-ray observations of these sources by different satellites (e.g., ROSAT, RXTE-PCA, BeppoSAX, SWIFT, etc.). Our motivation is to examine any correlation between the -rays and X-rays, which in turn would provide important clues to the main driver of the long term variability. We concentrate on the -ray and X-ray variability, since SED modelling indicates that although they both arise from the same region (indeed the same electron distribution), their radiative mechanisms are different and hence their response to variation in the intrinsic jet properties will be different.
Abdo et al. (2010b) and Palma et al. (2011) studied the relatively short term variability of blazars utilising quasi-simultaneous multiwaveband observations. Abdo et al. (2010b) carried out quasi simultaneous multiwaveband observations of -ray loud blazars between 2008 October and 2009 January. Using the result from SED modelling they argue that the difference between the low and high state of luminous blazars is due to the different kinetic power of the jet which is most likely related to the varying bulk Lorentz factor of outflow within the blazar emission zone. Palma et al. (2011) reported that PKS 0528+134 did not show any significant variability in -ray band on weeks timescales. They found moderate variability in X-rays () and most radio frequencies () on timescales of weeks. In optical bands the variability is found to be of upto on timescale of several hours. However, the physics driving the long term variability may be different than the short term one.
2 Observations
From the 3rd EGRET point source catalogue (Hartman et al., 1999), blazars have been identified using multi-wavelength information (Hartman et al., 1999; Mattox, Hartman, & Reimer, 2001). Using a different identification technique Sowards-Emmerd et al. (2003, 2004) have obtained a more complete census of plausible blazar counterparts. We use their source list augmented with source identifications from 3rd EGRET catalogue in regions of the sky that were not covered by Sowards-Emmerd et al. (2003, 2004). We further consider only FSRQs that have a cumulative source detection significance for sources above the Galactic plane () and for those in the Galactic plane ( ). The -ray fluxes averaged over all the cycles of EGRET observations (P1234) were used for our calculations. The P1234 flux has been calculated from the counts map over four cycles. Our final source list contains FSRQs out of which are also present in the 2nd Fermi catalogue. To be compatible with the Fermi data, we consider only EGRET -ray fluxes above GeV, which are calculated from the average spectral index and MeV flux quoted in the 3rd EGRET catalogue.
We find FSRQs which are brighter by an order of magnitude or more during EGRET era compared to the average flux observed from Fermi data while there is one source that is fainter by a factor of (Table 1).
| Source Name | Fa | Fa | a |
|---|---|---|---|
| PKS 0208-512 | |||
| 3EGJ 1614+3424 | |||
| PKS 1622-29 | |||
| PKS 0336-01 | |||
| PKS 0528+134 | |||
| PKS 1454-354 |
a-ray ( GeV) flux during EGRET and Fermi observations in photon cm-2 s-1. is the ratio of the EGRET to Fermi flux.
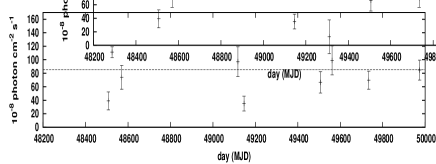
We focus first on two of these highly variable six sources (PKS 0208-512 and PKS 0528+134) that have been detected in several EGRET viewing cycles. These two sources were also observed in X-rays by different satellites during EGRET to Fermi era. Figure 1 top and bottom panels show EGRET lightcurves of PKS 0208-512 and PKS 0528+134 respectively. The dash line indicates the P1234 average flux value. The figure shows that there was extensive coverage of these sources by EGRET and the average values are not dominated by a single, short time-scale flare.

| Satellite | Date | Energy band (keV) | Fluxa | Flux2-10keVb | Ref.c |
|---|---|---|---|---|---|
| PKS 0208-512 | |||||
| ROSAT | 1990-1991 | 1 | |||
| ASCA | 1995 | 2 | |||
| ASCA | 1996 | 3 | |||
| BeppoSax | 2001 | 4,5 | |||
| Chandra | 2001 | 6 | |||
| SWIFT | 2005 | 7,8 | |||
| SWIFT | 2008 | 7,8 | |||
| Suzaku | 2008 | 7 | |||
| PKS 0528+134 | |||||
| ROSAT | 1990-1991 | 1,9,10 | |||
| ASCA | 1994 | 11 | |||
| ASCA | 1995 | 3 | |||
| RXTE-PCA | 1996 | e | e | - | |
| BeppoSax | 1997 | 5,12 | |||
| RXTE-PCA | 1999 | e | e | - | |
| Suzaku | 2008 | 13 | |||
| RXTE-PCA | 2009 | e | e | - | |
| XMM-Newton | 2009 | 13 | |||
| SWIFT | 2009 | 14 |
aReported X-ray flux in erg cm-2s-1 in the energy band given in column 3. bUsing the fluxes and spectral parameters observed in different energy bands given in references the X-ray fluxes are converted in 2-10 keV energy band in erg cm-2s-1 unit. c References: 1: Brinkmann, Siebert, & Boller (1994) 2: Reeves & Turner (2000) 3: Ueda et al. (2001) 4: Tavecchio et al. (2002) 5: Donato, Sambruna, & Gliozzi (2005). 6: Schwartz et al. (2006) 7: Abdo et al. (2010b) 8: Zhang et al. (2010) 9: Zhang et al. (1994) 10: Mukherjee et al. (1996) 11: Sambruna et al. (1997) 12: Ghisellini et al. (1999) 13: Palma et al. (2011) 14: Ghisellini, Tavecchio, & Ghirlanda (2009) dFlux has been calculated from the rest-frame keV luminosity given in the reference. eAveraged over the observations shown in Fig 2


PKS 0528+134 is one of the most luminous blazars detected by EGRET and showed several flaring episodes from 1990 to 1997 (Mukherjee et al., 1997). It was also detected by both OSSE and COMPTEL onboard CGRO (McNaron-Brown et al., 1995; Collmar et al., 1997) and has been observed simultaneously at other wavelengths (Mukherjee et al., 1999 and references therein). PKS 0208-512 shows the maximum flux variations with an average EGRET flux that is times higher than the average Fermi flux. Over the last twenty years, both sources were observed by several X-ray satellites and Table 2 gives their X-ray fluxes as reported. These different instruments measured X-ray fluxes in different energy bands (column 3 of Table 2). Using the reported spectral parameters, we converted the observed flux in different energy bands into flux in the 2-10 keV band. Specifically, we use the reported column density and spectral index to model the spectrum in XSPEC and extracted the 2-10 keV flux (column 5 of Table 2).
Pointed observation by RXTE Proportional counter array (PCA) of PKS 0528+134 were undertaken in 1996, 1999 and 2009. We used the spectra available in the standard product of the PCA observations, modelled with a power-law and Galactic absorption to obtain a keV integrated flux. Figure 2 shows the flux variations across different observations. During 2009, only upper limits were found probably because only one of the Proportional Counter Unit was working during this time. During these observations the flux did not vary significantly and hence we report an average value for three periods of observations in Table 2.
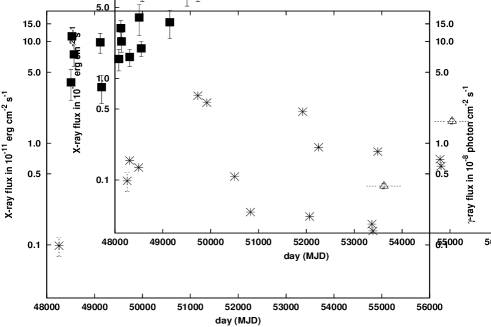
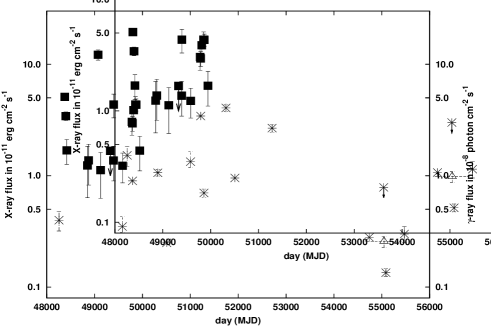
Figures 3 compares the -ray and X-ray fluxes at different times for the two sources. EGRET -ray fluxes are averaged over each observing period ( weeks) and the Fermi flux is averaged over the first two years of observation. X-ray fluxes are from pointed observations. While there is considerable scatter in the X-ray fluxes, there is no evidence for a dramatic decrease in X-ray flux, especially for PKS 0528+134. For PKS 0208-512, there is a hint of a decrease in the X-ray flux if one neglects the early ROSAT point. However, this decrease is at most a factor of 3, which is significantly less than the variation in the -ray flux of a factor of 23. Thus, we conclude that the large variability observed in -rays is not seen in X-rays.
| Satellite | Date | Energy band (keV) | Fluxa | Flux2-10keVb | Ref.c |
|---|---|---|---|---|---|
| PKS 1622-29 | |||||
| ROSAT | 1990-1991 | 1,2 | |||
| RXTE-PCA | 1997 | - | |||
| RXTE-PCA | 2006 | - | |||
| PKS 0336-01 | |||||
| Einstein | 1979-1980 | 3 | |||
| ROSAT | 1990-1991 | 1 | |||
| PKS 1454-354 | |||||
| ROSAT | 1990-91 | 1,4 | |||
| SWIFT | 2008 January | 5 | |||
| SWIFT | 2008 September | 5 | |||
| 3EGJ 1614+3424 | |||||
| ROSAT | 1990-91 | 1,4 |
aReported X-ray flux in erg cm-2s-1 in the energy band given in column 3. bUsing fluxes and spectral parameters observed in different energy bands given in references X-ray fluxes are derived for a common 2-10 keV energy band in erg cm-2s-1 unit. c References: 1: Brinkmann et al. (1994) 2: Mattox et al. (1997) 3: Owen, Helfand, & Spangler (1981) 4: Massaro et al. (2009) 5: Ghisellini et al. (2009)
For the other four sources with high -ray flux variability, only sparse X-ray observations are available. Nevertheless we report all available X-ray fluxes in Table 3. For PKS 1622-29, we have analysed existing RXTE PCA observations of 1997 and 2000. As compared to the early ROSAT observation, X-ray flux has increased in contrast to -ray emission which decreased. However, the small number of observations do not permit a reliable conclusion. For the rest, there are no reported X-ray observations during both EGRET and Fermi era.
Statistical errors on the measured flux have been reported for some of the observations. However, due to the uncertainties in the relative normalisations between different instruments and in the extrapolation to the 2-10 keV band, systematic errors on flux could be higher, but not expected to be larger than a factor of 2.
For two of the blazars, PKS 0528+134 and PKS 1622-29, the RXTE All Sky Monitor (ASM) lightcurves are available in the RXTE website (http://xte.mit.edu/asmlc/One-Day.html). However, the long term time averaged count rates for these sources PKS 0528+134 and PKS 1622-29 are not significantly higher than the systematic positive bias expected in ASM data (Chitnis et al., 2009). Thus ASM did not detect these sources.
It is to be noted that X-ray coverage of these sources are quite sparse and hence, the actual short term variability can be under-sampled. However, our main aim is to search for any long term variability which is less affected by the under-sampling of light curves. Also, for PKS 0528+134, quasi-simultaneous gamma-ray and X-ray observations have been carried out during almost all EGRET observations. It was observed that apart from a single huge flare, the variation in both X-ray and gamma-ray emission during these times are less than a factor of .
3 Discussion
In leptonic jet models, non-thermal electrons in the jet produce synchrotron emission. These electrons upscatter the synchrotron photons (SSC) and also photons coming out from accretion disk and/or broad line region (BLR) (EC) via the inverse Compton process. These emission processes contribute to the SED of blazars and modelling suggests that -ray emissions of FSRQs are dominated by EC process while the X-rays are primarily due to SSC (e.g., 3C 279: Pian et al., 1999; Abdo et al., 2010a; Sahayanathan & Godambe, 2012, PKS 0528+134: Palma et al., 2011). On the other hand, SEDs of BL Lac sources are better fitted by synchrotron self Compton (SSC) emission (e.g., Mrk 501: Petry et al., 2000; Abdo et al., 2010a). Recent progress in theoretical models for blazar emission is summarised by Boettcher (2010).
Specifically, Mukherjee et al. (1999) carried out a multiwaveband study of PKS 0528+134 during EGRET observations and SED modelling showed that during the -ray high state, the -ray emission was due to external Compton (EC) emission. Using Fermi observations, Palma et al. (2011) also carried out a coordinated multi-wavelength campaign and similarly concluded that as expected for FSRQs, the -ray emission is mainly due to EC process while SSC process is the primary X-ray emission mechanism.
In this scenario, we investigate variability in which jet or environment parameters can give rise to a strong variation in the EC component (i.e. -rays) while not affecting the SSC one (i.e. X-rays). Variation of the magnetic field density is ruled out since that would affect SSC and not the EC emission. Similarly, a change in the number density of electron would affect SSC more () than the EC emission (). Since, blazar emission is highly beamed, observed flux is a sensitive function of the Doppler beaming factor (). For a discrete jet, synchrotron self Compton emission is proportional to , whereas, external Compton flux is proportional to , where is the energy spectral index. The average value of -ray photon spectral index () derived from Fermi and EGRET data sets are and respectively (Abdo et al., 2010c; Bhattacharya, Sreekumar, & Mukherjee, 2009) and hence variation in cannot be the cause of the -ray intensity variation. For the average value of , the Doppler factor would need to decrease by to cause a factor of decrease in the EC flux. However, this would have led to a decrease in the SSC component as well by a factor of , which was not observed. Thus, variation in any of the intrinsic jet parameters such as number density, magnetic field, spectral index or Doppler factor cannot explain the uncorrelated variation in X-ray/-ray emission.
The EC emission is proportional to the external photon flux from accretion disk or BLR region, while SSC emission is independent. If the external photon flux was a factor of more during EGRET observation time, then it would naturally explain why -rays changed by a factor of ten while the X-ray flux remained nearly constant. This has important implications on the relationship between the jet and the accretion process. If the flux from the disk or BLR, which is connected to the accretion process can change by an order of magnitude but the average intrinsic properties of the jet are not affected, it implies very weak or no coupling between the accretion and jet emission processes.
For PKS 0528+134, the X-ray observations showed no significant variation i.e. the variation was less than a factor of . If one considers the extreme conservative limit, wherein the X-ray emission did decrease by a factor of during the Fermi era, it implies that the Doppler factor did decrease by a factor . However, this decrease in Doppler factor alone cannot explain the observed large -ray flux variation. An additional decrease in the external photon flux by a factor of is required. Thus in this extreme case, a factor of change in the accretion process caused only a modest factor change in the Doppler factor, implying that the accretion and jet processes are not tightly coupled.
If the external photons arising from the accretion disk or the BLR region did indeed change significantly over time, one can observe a significant decrease in the optical broad line flux during the Fermi era compared to EGRET. Such a decrease, would be a direct evidence for the model proposed here. However, in order to obtain an averaged line flux long term spectroscopic monitoring of these sources in optical is required. While, there were several photometric observations of PKS 0528+134 (e.g. Villata et al., 1997; Raiteri et al., 1998; Mukherjee et al., 1999), optical spectroscopic observations have been carried out only in recent years (Palma et al., 2011).
Apart from synchrotron process, the photometric observation will have contributions from accretion disk, BLR region and also from the host galaxies. So the optical photometric flux is not always dominated by synchrotron and/or synchrotron self Compton processes (Whiting, Majewski, & Webster, 2003; Mukherjee et al., 1999). PKS 0528+134 was observed in optical during few EGRET observing periods and the variation is within a factor of . This source was also observed in optical during the night of 2001 August 29 (Whiting et al., 2003). Palma et al. (2011) also observed the source in 2009 and the variation between these observations (BVR band) is a factor of .
There were only few optical observations of PKS 0208-512. This source was observed in optical wavebands during the nights of 2001 August 29 (Whiting et al., 2003) and 2008 December 14 (Abdo et al., 2010b). So, it is not possible to have a meaningful long term average of optical emission from this object.
PKS 1622-29 was monitored in optical (mainly in R band) for more than a decade by the program for Extragalactic Astronomy (PEGA) (Osterman Meyer et al., 2008). Though the source showed strong variation in shorter time scale (Figure 1 and 2 of Osterman Meyer et al., 2008), the long term average variation is within a factor of . However, the number of pointed observations is too few to derive a reliable long term average flux. More importantly, a huge -ray flare of this source was observed with EGRET and hence, the calculated EGRET average flux may be overestimated. Therefore, we have mainly considered PKS 0208-512 and PKS 0528+134 for our analysis. Unfortunately, as per our knowledge, there are no reported optical spectra of these blazars during both EGRET and Fermi times.
Radio emission probably originates in a different emission region than that of X-ray and -ray. Hence, the high frequency radio flux might be delayed by a few months to that of X-rays and -rays. Since the main objective of this work is to study the long term behaviour of blazars ( year), due to the longer cooling time scales at radio wavelengths, the high-frequency radio power could be a good representative for the long time-averaged jet power. PKS 0528+134 has been observed at a wavelength of from 1997 April to 2004 December using SCUBA camera at the James Clerk Maxwell Telescope (Jenness, Robson, & Stevens, 2010). A total of observations were carried out over nights. The source did not show large variations during this period (). Lonsdale, Doeleman, & Phillips (1998) conducted a survey of bright extragalactic radio sources with mm ( GHz) VLBI. They reported that the mm fluxes are Jy and Jy as measured by Kitt Peak and Haystack telescopes and MPIR meter telescope near Bonn and Onsala telescopes respectively. This source has been studied in the observed frequency range GHz from 2007 February to 2008 December with IRAM Plateau de Bure Interferometer (PdBI). Reported average fluxes in mm band, mm band and mm band are () Jy, () Jy and () Jy respectively (Maury et al., 2010). Clearly, the flux variation in mm band between these two observations is less than a factor of . Agudo et al. (2010) observed PKS 0528+134 during 2005 July at GHz and the reported flux is () Jy. This source was also monitored at GHz during 2001 October and the reported flux is Jy (Lee et al., 2008). This source is also observed at other high radio frequencies at different times and no large flux variation is noticed (e.g., Palma et al., 2011; Massardi et al., 2009; Gu, Cao, & Jiang, 2009; Lanyi et al., 2010; Wiren et al., 1992; Abdo et al., 2010a; Petrov et al., 2007; Lister & Homan, 2005; Kellermann et al., 2004; Cara & Lister, 2008 etc.).
The measured GHz flux of PKS 0208-512 is mJy utilising the observation with Arcminute Cosmology Bolometer Array Receiver (ACBAR) during 2002 observing seasons (Kuo et al., 2007). WMAP has detected PKS 0208-512 and no significant variation is noticed among one year averaged, three year averaged and five year averaged fluxes (Bennett et al., 2003; Hinshaw et al., 2007; Wright et al., 2009). Using the five year WMAP data, Chen & Wright (2009) reported that observed GHz, GHz and GHz fluxes of this source are () Jy, () Jy and () Jy respectively. PKS 0208-512 has been observed at other high radio frequencies at different times and no large flux variation is noticed (e.g., Ricci et al., 2006; Massardi et al., 2008; Murphy et al., 2010; Tingay et al., 2003; etc.).
The results obtained in this work need to be confirmed for other highly variable -ray sources through reliable long term X-ray monitoring data. It would also be interesting to study long term behaviour of such sources at other wavelengths which may provide additional clues on the strength of coupling between the jet and accretion process.
Acknowledgements
This work is based on the data provided by the ASM/RXTE teams at MIT and at the RXTE SOF, GOF and High Energy Astrophysics Science Archive Research Center (HEASARC) provided by NASA’s Goddard Space Flight Center.
References
- Abdo et al. (2010a) Abdo A. A. et al., 2010a, ApJ, 716, 30
- Abdo et al. (2010b) Abdo A. A. et al., 2010b, ApJ, 716, 835
- Abdo et al. (2010c) Abdo A. A. et al., 2010c, ApJ, 720, 435
- Ackermann et al. (2011) Ackermann M. et al., 2011, ApJ, 743, 171
- Agudo et al. (2010) Agudo I., Thum C., Wiesemeyer H., Krichbaum T. P., 2010, ApJS, 189, 1
- Atwood et al. (2009) Atwood W. B. et al., 2009, ApJ, 697, 1071
- Bennett et al. (2003) Bennett C. L. et al., 2003, ApJS, 148, 97
- Bhattacharya et al. (2009) Bhattacharya D., Sreekumar P., Mukherjee R., 2009, Research in Astronomy and Astrophysics, 9, 85
- Bignami et al. (1981) Bignami G. F. et al., 1981, A&A, 93, 71
- Boettcher (2004) Boettcher M., 2004, in ESA Special Publication, Vol. 552, Proceedings of the 5th INTEGRAL Workshop on the INTEGRAL Universe, 16-20 February 2004, Munich, Germany., V. Schoenfelder, G. Lichti, & C. Winkler, ed., p. 543
- Boettcher (2010) Boettcher M., 2010, ArXiv e-prints, astro-ph:1006.5048
- Böttcher (2007) Böttcher M., 2007, Ap&SS, 309, 95
- Böttcher et al. (2003) Böttcher M. et al., 2003, ApJ, 596, 847
- Brinkmann et al. (1994) Brinkmann W., Siebert J., Boller T., 1994, A&A, 281, 355
- Cara & Lister (2008) Cara M., Lister M. L., 2008, ApJ, 674, 111
- Chen & Wright (2009) Chen X., Wright E. L., 2009, ApJ, 694, 222
- Chitnis et al. (2009) Chitnis V. R., Pendharkar J. K., Bose D., Agrawal V. K., Rao A. R., Misra R., 2009, ApJ, 698, 1207
- Collmar et al. (1997) Collmar W. et al., 1997, A&A, 328, 33
- Donato et al. (2005) Donato D., Sambruna R. M., Gliozzi M., 2005, A&A, 433, 1163
- Ferrari (1998) Ferrari A., 1998, ARA&A, 36, 539
- Ghisellini et al. (1999) Ghisellini G. et al., 1999, A&A, 348, 63
- Ghisellini et al. (2009) Ghisellini G., Tavecchio F., Ghirlanda G., 2009, MNRAS, 399, 2041
- Gu et al. (2009) Gu M., Cao X., Jiang D. R., 2009, MNRAS, 396, 984
- Hartman et al. (1999) Hartman R. C. et al., 1999, ApJS, 123, 79
- Hartman et al. (2001) Hartman R. C. et al., 2001, ApJ, 558, 583
- Hinshaw et al. (2007) Hinshaw G. et al., 2007, ApJS, 170, 288
- Jenness et al. (2010) Jenness T., Robson E. I., Stevens J. A., 2010, MNRAS, 401, 1240
- Kanbach et al. (1988) Kanbach G. et al., 1988, Space Sci. Rev., 49, 69
- Kellermann et al. (2004) Kellermann K. I. et al., 2004, ApJ, 609, 539
- Kembhavi (1999) Kembhavi A., 1999, Quasar and Active Galactic Nuclei. Cambridge University Press, —1999
- Krolik (1999) Krolik J., 1999, Active Galactic Nuclei. Princeton University Press, —1999
- Kuo et al. (2007) Kuo C. L. et al., 2007, ApJ, 664, 687
- Lanyi et al. (2010) Lanyi G. E. et al., 2010, AJ, 139, 1695
- Lee et al. (2008) Lee S.-S., Lobanov A. P., Krichbaum T. P., Witzel A., Zensus A., Bremer M., Greve A., Grewing M., 2008, AJ, 136, 159
- Lister & Homan (2005) Lister M. L., Homan D. C., 2005, AJ, 130, 1389
- Lonsdale et al. (1998) Lonsdale C. J., Doeleman S. S., Phillips R. B., 1998, AJ, 116, 8
- Marscher (2009) Marscher A. P., 2009, ArXiv e-prints, astro-ph: 0909.2576
- Massardi et al. (2008) Massardi M. et al., 2008, MNRAS, 384, 775
- Massardi et al. (2009) Massardi M., López-Caniego M., González-Nuevo J., Herranz D., de Zotti G., Sanz J. L., 2009, MNRAS, 392, 733
- Massaro et al. (2009) Massaro E., Giommi P., Leto C., Marchegiani P., Maselli A., Perri M., Piranomonte S., Sclavi S., 2009, A&A, 495, 691
- Mattox et al. (2001) Mattox J. R., Hartman R. C., Reimer O., 2001, ApJS, 135, 155
- Mattox et al. (1997) Mattox J. R., Wagner S. J., Malkan M., McGlynn T. A., Schachter J. F., Grove J. E., Johnson W. N., Kurfess J. D., 1997, ApJ, 476, 692
- Maury et al. (2010) Maury A. J. et al., 2010, A&A, 512, A40
- McNaron-Brown et al. (1995) McNaron-Brown K. et al., 1995, ApJ, 451, 575
- Mukherjee et al. (1997) Mukherjee R. et al., 1997, ApJ, 490, 116
- Mukherjee et al. (1999) Mukherjee R. et al., 1999, ApJ, 527, 132
- Mukherjee et al. (1996) Mukherjee R. et al., 1996, ApJ, 470, 831
- Murphy et al. (2010) Murphy T. et al., 2010, MNRAS, 402, 2403
- Nolan et al. (2012) Nolan P. L. et al., 2012, ApJS, 199, 31
- Osterman Meyer et al. (2008) Osterman Meyer A. et al., 2008, AJ, 136, 1398
- Owen et al. (1981) Owen F. N., Helfand D. J., Spangler S. R., 1981, ApJ, 250, L55
- Palma et al. (2011) Palma N. I. et al., 2011, ApJ, 735, 60
- Petrov et al. (2007) Petrov L., Hirota T., Honma M., Shibata K. M., Jike T., Kobayashi H., 2007, AJ, 133, 2487
- Petry et al. (2000) Petry D. et al., 2000, ApJ, 536, 742
- Pian et al. (1999) Pian E. et al., 1999, ApJ, 521, 112
- Raiteri et al. (1998) Raiteri C. M., Ghisellini G., Villata M., de Francesco G., Lanteri L., Chiaberge M., Peila A., Antico G., 1998, A&AS, 127, 445
- Reeves & Turner (2000) Reeves J. N., Turner M. J. L., 2000, MNRAS, 316, 234
- Ricci et al. (2006) Ricci R., Prandoni I., Gruppioni C., Sault R. J., de Zotti G., 2006, A&A, 445, 465
- Sahayanathan & Godambe (2012) Sahayanathan S., Godambe S., 2012, MNRAS, 419, 1660
- Sambruna et al. (1997) Sambruna R. M. et al., 1997, ApJ, 474, 639
- Schwartz et al. (2006) Schwartz D. A. et al., 2006, ApJ, 640, 592
- Sikora et al. (2001) Sikora M., Błażejowski M., Begelman M. C., Moderski R., 2001, ApJ, 554, 1
- Sowards-Emmerd et al. (2003) Sowards-Emmerd D., Romani R. W., Michelson P. F., 2003, ApJ, 590, 109
- Sowards-Emmerd et al. (2004) Sowards-Emmerd D., Romani R. W., Michelson P. F., Ulvestad J. S., 2004, ApJ, 609, 564
- Tavecchio et al. (2002) Tavecchio F. et al., 2002, ApJ, 575, 137
- Tingay et al. (2003) Tingay S. J., Jauncey D. L., King E. A., Tzioumis A. K., Lovell J. E. J., Edwards P. G., 2003, PASJ, 55, 351
- Ueda et al. (2001) Ueda Y., Ishisaki Y., Takahashi T., Makishima K., Ohashi T., 2001, ApJS, 133, 1
- Urry & Padovani (1995) Urry C. M., Padovani P., 1995, PASP, 107, 803
- Villata et al. (1997) Villata M. et al., 1997, A&AS, 121, 119
- Whiting et al. (2003) Whiting M. T., Majewski P., Webster R. L., 2003, PASA, 20, 196
- Wiren et al. (1992) Wiren S., Valtaoja E., Terasranta H., Kotilainen J., 1992, AJ, 104, 1009
- Wright et al. (2009) Wright E. L. et al., 2009, ApJS, 180, 283
- Zhang et al. (2010) Zhang S., Collmar W., Torres D. F., Wang J.-M., Lang M., Zhang S.-N., 2010, A&A, 514, A69
- Zhang et al. (1994) Zhang Y. F., Marscher A. P., Aller H. D., Aller M. F., Terasranta H., Valtaoja E., 1994, ApJ, 432, 91