e-mail: daniela.mueller@astro.uni-tuebingen.de 22institutetext: Laboratoire AIM, CEA/IRFU, CNRS/INSU, Université Paris Diderot, CEA DSM/IRFU/SAp, 91191 Gif-sur-Yvette, France
A 0535+26 in the April 2010 outburst: probing the accretion regime at work
Abstract
Context. A number of accreting X-ray pulsars experience spectral changes, both on the long time scales and on the time scales of the neutron star spin period. The sources seem to form two distinct groups which differ by the type of the spectral variations with flux. Such a bimodality probably reflects two different regimes of accretion that may result in a particular pulsar depending on its luminosity – so-called sub- and super-critical regimes.
Aims. We investigated the behavior of the spectral parameters of the Be/X-ray binary system A 0535+26, as a function of flux and pulse phase.
Methods. We used the data collected with INTEGRAL and RXTE during the April 2010 outburst of the source. We analyzed the phase-averaged and phase-resolved spectra and performed pulse-to-pulse spectral analysis of the pulsar.
Results. Our analysis reveals variability in the continuum parameters of the source’s pulse-averaged spectrum with flux. The pulse-averaged cyclotron line energy does not change with the source luminosity during the outburst, which is consistent with previous studies. Our pulse-phase resolved and pulse-to-pulse analyses reveal, however, indications for a positive correlation of the cyclotron line energy with flux, as well as a flux-dependence of the continuum parameters. Based on the observed behavior, we argue that A 0535+26 operates at the sub-critical accretion regime.
Key Words.:
X-rays: binaries - Stars: neutron - Accretion, accretion disks - pulsars: individual A 0535+261 Introduction
The X-ray transient A 0535+26 111A 0535+26 is referred to as 1A 0535+262 in SIMBAD Astronomical Database was discovered by the satellite Ariel V during a giant outburst in April 1975 (Rosenberg et al. 1975). The source belongs to the class of Be/X-ray binaries. It consists of an accreting neutron star orbiting the O9.7 IIIe optical star HDE 245770 (Li et al. 1979; Giangrande et al. 1980). The system regularly undergoes X-ray outbursts separated by quiescence phases (Motch et al. 1991). In Be/X-ray binaries, outbursts are often divided into normal and giant ones. Normal outbursts repeat periodically at times near the periastron passage and are thought to originate from an increase of the accretion rate () due to a closer position of the neutron star to its Be star companion (Stella et al. 1986). Giant outbursts show a larger increase in luminosity (100–1000) and last several tens of days (Stella et al. 1986). Often there is, however, no strict distinction between the two types of outbursts. Thus, some outbursts in A 0535+26 can not be clearly assigned to one of those two groups. Besides the outburst in 1975, A 0535+26 went through giant outbursts in 1980 (Nagase et al. 1982), 1983 (Sembay et al. 1990), 1989 (Makino et al. 1989), 1994 (Finger et al. 1996), 2005 (Tueller et al. 2005), 2009 (Krimm et al. 2009; Caballero et al. 2009, 2011c) and 2011 (Camero-Arranz et al. 2011; Tchernin et al. 2011; Caballero et al. 2011a).
The distance of the system has been measured to be around 2 kpc (Steele et al. 1998). Recent measurements of the orbital period give 111.1 days (Finger et al. 2006). The pulse period is around 103.39 s (Caballero et al. 2007).
The phase-averaged X-ray spectrum of A 0535+26 can be described by a hard power law ( = 0.8–1.1 for 2–18 keV Ariel-V/SSI observations, Ricketts et al. 1975) modified above 15–20 keV by an exponential roll-off (TTM/HEXE spectrum in 2–156 keV, Kendziorra et al. 1994). Alternatively, Acciari et al. (2011) used the thermal Comptonization model to fit the low-energetic part of the X-ray continuum. Additionally, the spectrum shows absorption lines, interpreted as cyclotron resonant scattering features (CRSFs). Such features are caused by resonant scattering of photons off the electrons in Landau levels (see, e.g., Truemper et al. 1978; Isenberg et al. 1998). The energy of the fundamental line and the spacing between harmonics are directly proportional to the magnetic field strength. Two cyclotron absorption lines at about 50 keV and 100 keV were reported and interpreted as the fundamental and the first harmonic and implying a magnetic field strength of about G (Kendziorra et al. 1994; Caballero et al. 2007). While the presence of the fundamental line at about 50 keV was initially questioned (Grove et al. 1995; Araya & Harding 1996), newer analyses clearly confirm the presence of both lines and their interpretation as a fundamental cyclotron feature and its first harmonic (Caballero et al. 2007).
An evolution of the cyclotron line energy with the source luminosity has been reported for several accreting X-ray pulsars. A negative correlation of the line energy with luminosity has been observed in V 0332+53 and 4U 0115+63 (Tsygankov et al. 2006, 2007, 2010; Mowlavi et al. 2006). A positive correlation was detected for Her X-1 and GX 304-1 (Staubert et al. 2007; Klochkov et al. 2012). A similar behavior is seen in the pulse-to-pulse variations. For V 0332+53 and 4U 0115+63, a negative correlation of cyclotron line energy with the amplitude of individual pulses and a softening of the spectral continuum with pulse amplitude was reported, whereas for Her X-1 and A 0535+26 a positive correlation of the line energy with pulse amplitude and a hardening of the spectrum with pulse amplitude was observed (Klochkov et al. 2011). Since A 0535+26 showed the spectral-flux dependence on the pulse-to-pulse timescales only, it is important to verify and study this behavior, using the data from a new outburst of the source.
Pulse-phase resolved analysis shows that the spectrum of the main peak of the pulse profile seems to be harder than the spectrum of the secondary peak (Kendziorra et al. 1994; Caballero 2009). Caballero (2009) also found a noticeably lower cyclotron line energy during the main peak compared to the secondary one.
In this work, we analyzed the April 2010 outburst of A 0535+26. On April 3 2010, a brightening of A 0535+26 in the Swift/BAT light curve was reported (Caballero et al. 2010). In the 20–100 keV energy band of INTEGRAL/ISGRI the flux of the source reached a value of about 0.92 Crab and the fundamental cyclotron line was detected at about 47.6 keV (Caballero et al. 2010). The outburst analyzed in this work took place after the giant outburst of December 2009, which reached a flux of about 5.14 Crab in the 15–50 keV Swift/BAT light curve (Caballero et al. 2010).
Our analysis is focused on the spectral evolution of A 0535+26 as a function of luminosity. We analyzed phase-averaged, pulse-phase resolved, and pulse-amplitude resolved (pulse-to-pulse) spectra of the 2010 outburst, to explore spectral variations on short (down to the pulsar’s spin period) and long (several days) time scales. A description of the observations and data processing is given in Section 2. In Section 3, we describe the analysis of the phase-averaged, phase-resolved and pulse-to-pulse spectra. In Sections 4 and 5, we discuss and summarize our results.
2 Observations and data processing
For our analysis, we used data from the JEM-X and IBIS instruments of the INTEGRAL satellite (INTErnational Gamma-Ray Astrophysics Laboratory, Winkler et al. 2003) and from the PCA and HEXTE instruments onboard Rossi X-ray Timing Explorer (RXTE, Bradt et al. 1993).
The JEM-X monitor provides spectra and images with arc-minute resolution in the 3–35 keV energy band (Lund et al. 2003). The high angular resolution gamma-ray imager IBIS consists of two detector layers, ISGRI and PICsIT (Ubertini et al. 2003). The ISGRI layer, which we used for our analysis, is sensitive at energies from 15 keV to 1 MeV (Lebrun et al. 2003). The PCA instrument onboard RXTE consists of a set of five proportional counters and is sensitive to energies 2–60 keV (Jahoda et al. 2006). The high-energy detector HEXTE operates in the energy range 15–250 keV (Rothschild et al. 1998).
We used data covering the time from the maximum to the decay of the April 2010 outburst (2010-04-03 to 2010-04-17, Table 1). A Swift/BAT light curve of A 0535+26 with the indicated observations is shown in Fig. 1.

| Observation | Exposure [ks] | Flux in Crab [10-100 keV] |
|---|---|---|
| INTEGRAL 0912 | 65.1 | 0.978 |
| INTEGRAL 0914 | 23.8 | 0.675 |
| INTEGRAL 0915 | 28.6 | 0.368 |
| INTEGRAL 0916 | 29.4 | 0.191 |
| INTEGRAL 0917 | 31.7 | 0.096 |
| RXTE 95347-02-01-00 | 3.3 | 0.908 |
| RXTE 95347-02-01-01 | 3.3 | 0.986 |
| RXTE 95347-02-01-02 | 3.0 | 0.715 |
The INTEGRAL data were processed using OSA 9.0. For the ISGRI data we performed an additional gain correction to account for known problems in the OSA 9.0 energy calibration. We used the JEM-X data in the 5–30 keV range and the ISGRI data in the 20–145 keV range. We added systematic errors of 3% for JEM-X and 2% for ISGRI, which we estimated by fitting a Crab spectrum accumulated with the respective instruments with a canonical power-law with a photon index of 2.1. The Crab spectra are taken during the same observations since both sources are present simultaneously in the INTEGRAL field-of-view.
We used HEASoft Version 6.11 and
selected the energy ranges 5–60 keV for PCA
and 20–145 keV for
HEXTE for the RXTE data.
In the PCA spectra we excluded data below 5 keV due to
an instrumental background feature at the xenon L edge around
4.8 keV, which is poorly modelled and might introduce
systematic effects to our spectral fits (Rothschild et al. 2006; Caballero et al. 2008)
We added a systematic error of 1% for PCA and 1% for HEXTE data as recommended by the instruments teams. A systematic error for the HEXTE data is required due to the stop of the rocking motion of the HEXTE Cluster A in 2006 and HEXTE Cluster B in December 2009. Since then, HEXTE Cluster A is fixed on-source while HEXTE Cluster B measures the background, which is then converted to an adequate background for Cluster A (Pottschmidt et al. 2006). Similarly to Rothschild et al. (2011), we used the recorn model in XSPEC to account for uncertainties in the correction factor of the background.
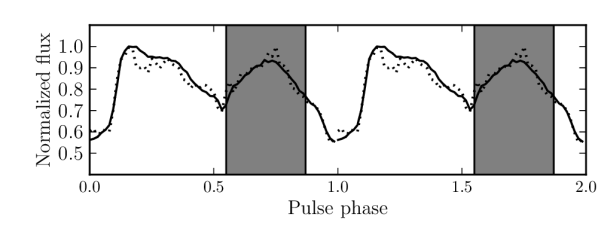
In order to select time intervals for the phase-resolved and pulse-to-pulse analyses, we extracted light curves for each observation. We then converted the photon arrival times to the solar system barycenter and corrected them for the orbital motion of the binary system using the ephemeris from Finger et al. (2006). The pulse period was determined with the epoch-folding technique. The pulse phase zero corresponds to the minimum in the pulse profile (see Fig. 11).
| Observation | /d.o.f. | |||||
| INTEGRAL 0912 | 1.1/110 | |||||
| INTEGRAL 0914 | 0.9/110 | |||||
| INTEGRAL 0915 | 0.9/110 | |||||
| INTEGRAL 0916 | 0.8/110 | |||||
| INTEGRAL 0917 | 0.9/110 | |||||
| RXTE 95347-02-01-00 | 1.2/152 | |||||
| RXTE 95347-02-01-01 | 1.5/152 | |||||
| RXTE 95347-02-01-02 | 1.3/152 |
3 Spectral analysis
3.1 Phase averaged spectra
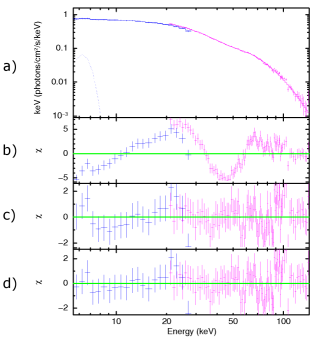
The spectra of A 0535+26 for various luminosity states were best fitted by a
power-law with a photon index modified
by an exponential rolloff with the folding energy (the cutoffpl model in XSPEC):
We included an emission line at around 6.4 keV to model the Fe K fluorescence line. Additionally, the residuals of the fit require inclusion of a an absorption line around 40 keV (Fig. 2) which we interpret as a CRSF (see Introduction). To account for this feature, we included a multiplicative absorption line with a Gaussian optical depth profile (the XSPEC gabs model) with a centroid energy of 44.4 keV:
| (1) |
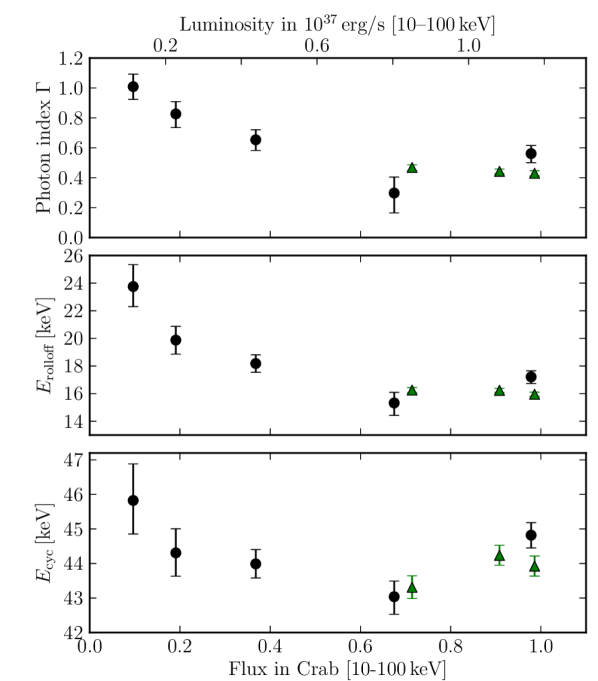
where is the cyclotron line centroid energy, and characterize the line strength and width respectively. The RXTE observations also indicate the presence of the first harmonic line around 104 keV. The best-fit parameters for the INTEGRAL and RXTE observations are summarized in Table 2. Figure 3 shows the photon index , the rolloff energy and the cyclotron line energy as a function of 10–100 keV flux in Crab units. The latter is obtained from a direct comparison of the source flux with that of the simultaneously observed Crab nebula. Because the first harmonic in the RXTE spectra is not statistically significant and to be consistent with the INTEGRAL spectral model, only one Gaussian absorption line was included in our spectral model, accounting for the fundamental cyclotron line.
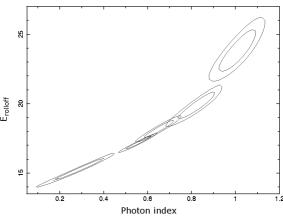
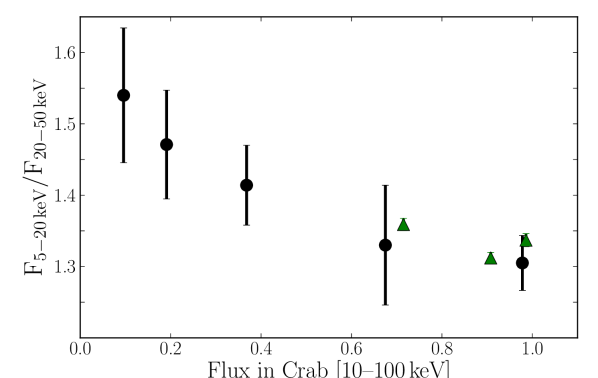
The photon index decreases from 1.0 for low luminosities to 0.5 for the outburst maximum, indicating a hardening of the power-law continuum with flux. The rolloff energy , however, decreases from 24 to 16 keV from the lowest to highest luminosity. That is, the part of the continuum around softens with flux. No correlation of the cyclotron line energy with the source luminosity is observed. The cyclotron line energy, however, varies irregularly between 43 keV and 46 keV. To rule out any coupling between and , we produced contour plots of those two parameters (Fig. 4). Since the evolution of indicates a hardening of the spectrum with increasing flux while the variation of suggests the opposite behavior, we calculated the hardness ratio to study the spectral variations independently of the spectral model. Figure 5 shows a ratio of the 5–20 keV flux to the 20–50 keV flux as a function of the 10–100 keV flux. The observed decrease of the ratio implies an overall hardening of the spectrum with flux. A similar behavior is reported in Caballero et al. (2013) for the normal double-peaked outburst of August 2009. The results of this analysis, i.e. no correlation for the cyclotron line energy and a spectral hardening with flux, seem to support our results in the analyzed luminosity range. Following Acciari et al. (2011), we tried to model the spectra with the compTT model in XSPEC. We find that although the compTT model provides a good description of the X-ray spectrum below 35 keV (the energy range used in Acciari et al. 2011), it produces strong residuals when applied to the overall energy range evaluated in this paper, thus making the compTT overall fit formally unacceptable. Nevertheless, we analyzed the evolution of the cyclotron line energy as a function of flux using compTT and found it to be consistent with the results, obtained with our phenomenological model.
3.2 Pulse-phase resolved spectroscopy
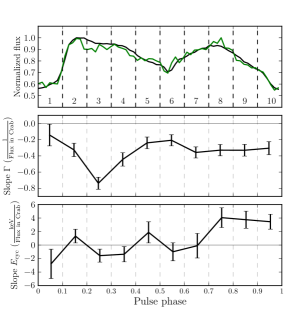
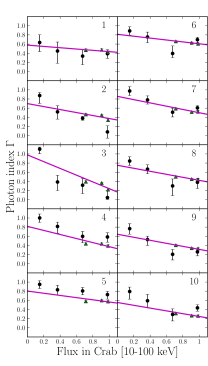
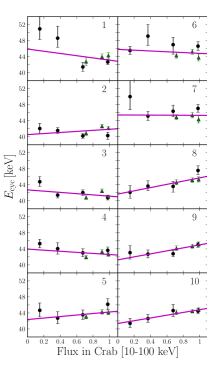
To select pulse-phase intervals, we produced pulse profiles which are similar to those reported earlier (e.g. Caballero 2009 and Caballero et al. 2011b) and do not show strong variation with flux. We then extracted spectra in 10 equal phase bins for each observation. That is, we performed pulse-phase resolved spectroscopy separately for different flux levels. Figure 6 summarizes the evolution of the photon index and the cyclotron line energy with pulse phase at different fluxes. For each pulse-phase bin separated by vertical dashed lines and marked by a number from 1 to 10, left column, and are shown as a function of 10–100 keV flux in the middle and the right column, respectively. To increase the photon statistics in the observations at the lowest flux levels, we summed up the observations from the INTEGRAL revolutions 0916 and 0917. For each pulse-phase bin, we performed a linear fit of the –flux and –flux dependencies shown by the solid lines. The slopes of the linear fits with the corresponding 1 uncertainties are shown in the bottom panels of the left column. The value of the slope with the associated uncertainty gives a rough estimate of the significance of the linear correlation between the parameters.
and show systematic variations with pulse phase and flux. The evolution of as a function of flux, for individual pulse-phase intervals, indicates a hardening of the power-law part of the continuum with flux in almost all phase bins. In the pulse phases between 0.7 and 1.0 there is a strong indication (slope/error 3 ) for a positive correlation of the cyclotron line energy with flux (bottom panel of left column in Fig. 6). To estimate quantitatively the significance of the non-zero slopes, we performed a F-test, which yields a value of the probability that the improvement in obtained by moving from a fit of the dependences by a constant to a linear fit with non-zero slope is due to statistical flucuations. Lower values of , thus, indicate larger significance. In case of the –flux dependence, the -values for most phase bins are at the level of a few per cent indicating marginal significance for individual bins. For the cyclotron line energy dependence on flux in the phase interval 0.7–1.0., i.e. the phase bins 8, 9, and 10, the -values are 0.027, 0.009, and 0.001, respectively.
To check possible influence of any systematic differences in calibration between the INTEGRAL and RXTE instruments on our results, we re-calculated the significances using only the INTEGRAL data points. For the dependence of on flux, the -values remained at a level of a few per cent. For the –flux dependence in the phase bins 8, 9, and 10, the -values are found to be 0.08, 0.17, and 0.05, respectively. The values for the slope, however, did not change considerably. We find, therefore, no indication that the measured correlations are driven by systematic differences between the instruments onboard the two satellites.
As before, to check the stability of our results with respect to the choice of the continuum model, following Acciari et al. (2011) we fitted the spectra using the thermal Comptonization model compTT in XSPEC. Even though the spectral fits are formally unacceptable (similar to the case of phase-averaged analysis, see Section 3.1), the evolution of the cyclotron line energy with flux is well reproduced.
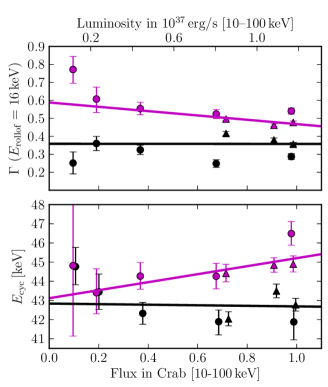
In the following, the two peaks of the double-peaked pulse profile are referred to as the main and secondary pulse. To characterize spectral variations within larger pulse-phase intervals, namely in the main and secondary pulses, we extracted spectra for two broad pulse-phase intervals for each observation. The first interval, 0.1–0.5, contains the main peak, the second one, 0.6–1.0, – the secondary peak. The best-fit parameters, as a function of flux, for the two phase intervals are shown in Fig. 7. To characterize the hardness of the continuum by the photon index only, we fixed the rolloff energy to its averaged value of 16 keV for the upper plot of Fig. 7. The spectrum is harder and the cyclotron line energy lower for the main pulse. We observe an indication for a spectral hardening and a positive trend of the cyclotron line energy with flux for the secondary peak. The values for the slopes of the linear fit together with the results of the linear correlation analysis are shown in Table 3.
| Observation | parameter | linear fit | correlation coeff. | probability |
| Pulse-phase-resolved analysis | ||||
| phase 0.1–0.5 | (Crab unit)-1 | 0.28 | 0.51 | |
| keV (Crab unit)-1 | -0.57 | 0.14 | ||
| phase 0.6–1.0 | (Crab unit)-1 | -0.83 | 0.01 | |
| keV (Crab unit)-1 | 0.60 | 0.12 | ||
| Pulse-to-pulse analysis | ||||
| INTEGRAL | (-5.79 1.66) /(ISGRI cts/s) | -0.96 | 0.01 | |
| (0.69 6.78) keV/(ISGRI cts/s) | -0.17 | 0.78 | ||
| RXTE | (-9.12 1.84) /(PCA cts/s) | -0.99 | ||
| (2.02 1.26) keV/(PCA cts/s) | 0.78 | 0.12 | ||
| values from Klochkov et al. (2011) | ||||
| INTEGRAL | (-8.71 0.86) /(ISGRI cts/s) | -0.96 | 0.01 | |
| (1.36 0.53) keV/(ISGRI cts/s) | +0.94 | 0.02 | ||
| RXTE | (-1.54 0.19) /(PCA cts/s) | -0.98 | ||
| (1.92 0.92) keV/(PCA cts/s) | +0.70 | 0.19 |
3.3 Pulse-to-pulse analysis
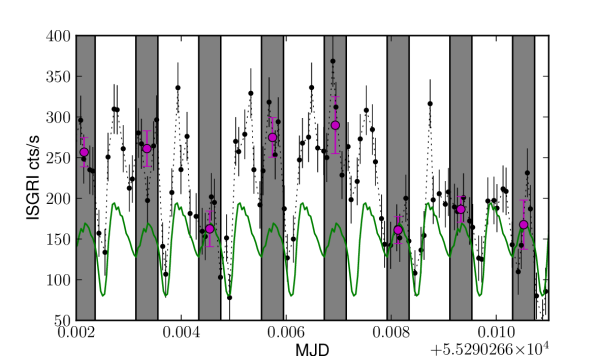
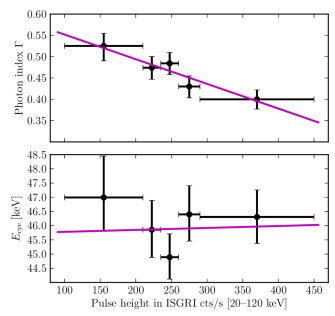
We performed a spectral analysis of the source on a pulse-to-pulse basis, similar to Klochkov et al. (2011). To identify individual pulsations, we extracted light curves for all INTEGRAL and RXTE observations. Following Klochkov et al. (2011), we have chosen the secondary peak of the pulse profile (Fig. 11) for our analysis, to be able to compare our results. In the pulse profiles above keV the secondary peak is higher than the first one, thus, providing better statistics for the measurements of the cyclotron line around 50 keV. For each individual pulsation cycle, we calculated the mean ISGRI (for the INTEGRAL observations) and PCA (for the RXTE observations) count rate in the selected pulse-phase interval, which we refer to as height or amplitude of individual pulses. We then grouped pulses of a similar pulse height together to accumulate spectra as a function of pulse height.
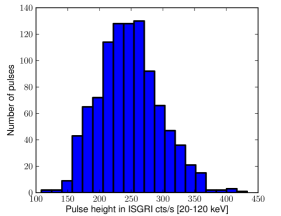
For the pulse-to-pulse analysis of the INTEGRAL observations, we only used the data from the revolution 0912 taken during the maximum of the outburst, which provided the best photon statistics. Strong pulse-to-pulse variability can be seen clearly in Fig. 11, where the 20–120 keV ISGRI light curve, together with the repeated averaged pulse profile and the selected pulse phase interval, is shown. The distribution of the measured amplitudes of individual pulses for this observation is shown in the left panel of Fig. 11. We accumulated spectra in five pulse-height bins: 100–210, 210–235, 235–260, 260–290, and 290–450 ISGRI counts/s.
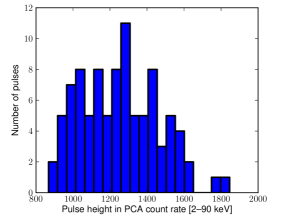
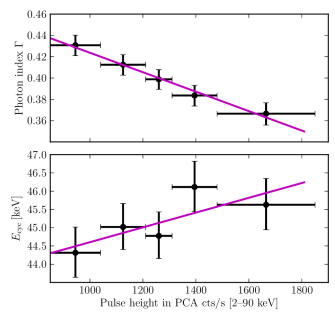
For RXTE, we analyzed all three observations together as they were performed at a similar luminosity levels, close to the maximum of the source’s outburst. The selected pulse height intervals for which the spectra have been accumulated are 850–1040, 1040–1210, 1210–1310, 1310–1480, and 1480–1850 PCA counts/s. The distribution of pulse heights for the RXTE data is shown in the right panel of Fig. 11.
The INTEGRAL and RXTE observations were analyzed separately because of possible systematic effects of non-perfect cross-calibration between the two observatories. The best-fit photon index and cyclotron line energy as a function of pulse height are shown in Fig. 11. We fixed the rolloff energy to 15.5 keV for the INTEGRAL and 15.2 keV, for the RXTE data for the plot of the photon index . A significant decrease of the photon index (hardening of the power-law continuum) with pulse height is indicated by the data from both satellites. The cyclotron line energy, however, does not show any considerable evolution with pulse amplitude in the INTEGRAL data and an indication of a positive correlation with pulse height in the RXTE data. The results of the corresponding formal linear correlation analysis are shown in Table 3. Although the statistics of our data does not allow us to confirm the positive correlation between and pulse amplitude reported in Klochkov et al. (2011) (although, some support to the correlation is leaned by the RXTE data), the measured slopes are in agreement, within uncertainties, with those reported by Klochkov et al. (2011) and repeated in the bottom section of Table 3
4 Discussion
We have analyzed the phase-averaged, phase-resolved and pulse-to-pulse spectra of A 0535+26 as a function of the source luminosity. In all types of the analysis, the continuum gets harder with increasing flux. In some pulse-phase intervals, the data show indications of a positive -flux correlation, although with marginal significance (3 ). The pulse-averaged centroid energy of the cyclotron line measured over longer time scales (days) shows some irregular variability but no clear dependence on flux, which is consistent with previous observations of this source. In the following, we discuss our results in more detail.
4.1 Long-term spectral variations with luminosity
As mentioned in the introduction, a relation between the cyclotron line centroid energy and luminosity was reported for a number of accreting pulsars. Since the work of Basko & Sunyaev (1976), it is known that the geometry of the emitting structure (column), on/above the polar caps of an accreting neutron star, must be different for the luminosities above and below a certain critical value which depends on the pulsar’s properties. In the following, accreting pulsars with luminosities below are referred to as sub-critical sources while those with luminosities exceeding – as super-critical. According to this picture, V 0332+53 and 4U 0115+63, which show a negative correlation and a softening of the spectrum with flux, belong to so-called super-critical sources, whose luminosities are above . In such sources, infalling matter is most probably decelerated in a radiative shock, whose height is believed to increase with , i.e., drift towards an area with a lower -field strength. Her X-1 and GX 304-1, where a positive correlation and a hardening of the spectrum with flux are observed, are the examples of sub-critical sources (), where infalling matter is stopped by the Coulomb drag and collective plasma effects, rather than in a radiative shock. In such sources, the height of the emitting region decreases with increasing luminosity, owing to a corresponding increase in ram pressure of the infalling material (Staubert et al. 2007 and Becker et al. 2012).
The newest theoretical calculations by Becker et al. (2012) predict for A 0535+26, a value of the critical luminosity erg/s, which is 5–6 times larger than the peak flux of the outburst analyzed here (see the upper X-axis of Fig. 3). Thus, A 0535+26 must have been accreting in a sub-critical regime during the outburst. Though, the key indication of this regime, namely the positive correlation between the CRSF energy and flux, is not firmly established in this source. Its X-ray continuum shows, however, a hardening with increasing flux, which is also observed in the other two sub-critical sources, Her X-1 and GX 304-1 (the super-critical sources V 0332+53 and 4U 0115+63 show an opposite behavior of the spectral continuum, see above). If the accretion regime in A 0535+26 is similar to one in Her X-1 and GX 304-1, the expected positive correlation must be smeared due to a special geometry of the emitting structure and/or a special orientation of the system with respect to the observer’s line of sight. Alternatively, A 0535+26 might represent yet another, “third” accretion regime which yields very little, if any, variations in the height of the emitting region above the star surface (i.e., in the measured cyclotron line energy) in the observed range of luminosities. Indeed, while the luminosities of Her X-1 and GX 304-1 are below, but relatively close to the corresponding values of (see Fig. 2 in Becker et al. 2012), A 0535+26 is far below . Thus, the configuration of the accretion column in this source might differ substantially from those in the other two sub-critical pulsars. These considerations seem to be supported by the latest observations of a giant outburst of A 0535+26, analyzed by Caballero et al. (2012), when the source luminosity approached (i.e., a luminosity range of Her X-1 and GX 304-1). In this preliminary analysis, a few measurements of , corresponding to the highest luminosities, indeed show an indication of an increase towards higher fluxes (Fig. 1 of Caballero et al. 2012). Further observations are, however, necessary to confirm this effect.
4.2 Pulse-phase dependence of the spectrum
It is necessary to reconstruct the geometry of the rotating neutron star and its emitting regions to understand the results of the phase-resolved spectral analysis. Such a reconstruction can be made based on the observed pulse profiles of a pulsar using, e.g., the decomposition method by Kraus et al. (1995). This technique has recently been applied to A 0535+26 by Caballero et al. (2011b). As a result, the pulse profiles of the source were reproduced in a model, including a hollow column, a thermal halo and taking into account relativistic light deflection in the strong gravitational field of the neutron star. Derived from the results of Caballero et al. (2011b), the observed pulse profile can be produced by one magnetic pole passing through the observer’s line of sight, whereas the second pole is never seen directly from the top but only through the gravitationally bent radiation from the lateral emission of the accretion column and its thermal scattering halo.
Since we observed similar pulse profiles as those used by Caballero et al. (2011b), we adopt the reconstructed geometry for our data. In our analysis, we observe a slightly harder spectrum for the main pulse with respect to the secondary pulse. Magnetized plasma gets optically thin for photons (E) which propagate parallel to the magnetic field lines. Thus, the main peak is probably formed by harder photons escaping the accretion column from top, along the field lines. About half a phase later, we probably see the lateral emission of both the accretion column and their thermal halos.
In our phase-resolved analysis, we observe variations of the cyclotron line energy with pulse phase in range 42–50 keV, which is probably caused by the changing viewing conditions of the scattering region and a dependence of the magnetic scattering cross sections on the angle between the magnetic field and the line of sight (Harding & Daugherty 1991). Variations over pulse phase are also seen in the slope of the linear fits to the and values as a function of flux (Fig. 6). While a significant decrease of with flux is present at most pulse phases, a considerable (positive) -flux correlation is only seen during the secondary peak (Figs. 6 and 7). According to the geometrical picture described above, the emerging radiation is emitted roughly perpendicular to the axis of the accretion column(s), that is, perpendicular to the field lines, in the secondary peak. As discussed in e.g. Ferrigno et al. (2011), at such angle, the resonant scattering features are expected to be deeper and narrower. Therefore, in the secondary peak, the viewing conditions of the line-forming region might be favourable for measuring variations with flux. In the pulse-averaged spectral analysis, the dependence is smeared out.
4.3 Pulse-to-pulse variability
As we noted in Sect. 3.3, the results of our pulse-to-pulse analysis, namely the spectral variations with the amplitude of individual pulses, are in agreement with those reported by Klochkov et al. (2011) on the basis of the observations of the source’s outburst in 2005 with better photon statistics. With our data, we have reproduced the hardening of the power-law with pulse amplitude. An indication of a positive correlation of the cyclotron line energy with flux can only be seen in the RXTE data (Fig. 11). If the positive correlation between the line energy and flux on the pulse-to-pulse time scale in A 0535+26 is real, the question remains: why the correlation is not observed on the pulse-averaged spectra accumulated over longer time scales? A qualitative explanation of this discrepancy might be the following. Strong pulse-to-pulse variability of the source’s flux leads to the relatively broad distribution of the amplitudes of individual pulses – more than a factor of two, as indicated in Fig. 11. Thus, pulse-averaged spectra accumulated over a longer time include contributions by pulses of very different heights. The pulse-to-pulse variability of the source’s spectrum must lead to a substantial smearing effect, especially in case of a line-like feature. If A 0535+26 indeed accrets in a regime with very little (if any) variation in the height of the emitting region with flux, as discussed in Sect. 4.1, the reduced sensitivity of the pulse-averaged spectroscopy to the –flux correlation might indeed lead to the observed discrepancy between the pulse-averaged and pulse-to-pulse results.
5 Summary and conclusions
In this work, we present the spectral analysis of the observational data taken with RXTE and INTEGRAL on the Be/X-ray binary system A 0535+26, during its outburst in April 2010. We studied the source’s broad-band X-ray spectrum as a function of luminosity on the pulse-averaged, pulse-phase resolved, and pulse-to-pulse basis. In all cases, a hardening of the X-ray continuum with flux is observed. This behavior is similar to that of other sub-critical sources, Her X-1 and GX 304-1. An indication of a positive correlation between the cyclotron line energy and flux (a characteristic feature of a sub-critical source) is only found in some pulse-phase resolved and pulse-to-pulse spectra (Fig. 6 and Table 3).
Based on the spectrum-flux dependence of A 0535+26, which is similar to that of other sub-critical sources, and on the source’s luminosity, which is well below the critical luminosity , we conclude that the pulsar operates in a sub-critical accretion regime, where the radiative shock, if formed, is not capable of decelerating the accreted plasma to rest. Instead, the in-falling matter is most probably stopped by the Coulomb drag and collective plasma effects. A similar behavior was reported in earlier works on this source, see e.g. Caballero et al. (2007, 2008, 2011c).
The lack of a firm detection of a –flux correlation, which is expected in this accretion regime, we tentatively attribute to a substantially lower ratio of the source luminosity to the critical one, compared to other sub-critical sources. At such a low luminosity level, the amplitude of variation in the height of the line-forming region with luminosity (mass accretion rate) might be substantially narrower than that in Her X-1 and GX 304-1.
Acknowledgements.
This research is based on observations with INTEGRAL, an ESA project with instruments and science data centre funded by ESA member states (especially the PI countries: Denmark, France, Germany, Italy, Switzerland, Spain), Poland and with the participation of Russia and the USA. For this analysis we also used RXTE observations provided by the RXTE Science Operations Center and Swift/BAT transient monitor results provided by the Swift/BAT team. This work has been partially funded by the DLR, grant 50 OR 1008, and by the Carl-Zeiss-Stiftung. IC acknowledges financial support from the French Space Agency CNES through CNRS. We thank the anonymous referee for very valuable comments.References
- Acciari et al. (2011) Acciari, V. A., Aliu, E., Araya, M., et al. 2011, ApJ, 733, 96
- Araya & Harding (1996) Araya, R. A. & Harding, A. K. 1996, A&AS, 120, C183
- Basko & Sunyaev (1976) Basko, M. M. & Sunyaev, R. A. 1976, MNRAS, 175, 395
- Becker et al. (2012) Becker, P. A., Klochkov, D., Schönherr, G., et al. 2012, A&A, 544, A123
- Bradt et al. (1993) Bradt, H. V., Rothschild, R. E., & Swank, J. H. 1993, A&AS, 97, 355
- Caballero (2009) Caballero, I. 2009, PhD thesis, IAAT University of Tuebingen
- Caballero et al. (2011a) Caballero, I., Ferrigno, C., Klochkov, D., et al. 2011a, The Astronomer’s Telegram, 3204, 1
- Caballero et al. (2011b) Caballero, I., Kraus, U., Santangelo, A., Sasaki, M., & Kretschmar, P. 2011b, A&A, 526, A131
- Caballero et al. (2009) Caballero, I., Kretschmar, P., Pottschmidt, K., et al. 2009, The Astronomer’s Telegram, 2337, 1
- Caballero et al. (2007) Caballero, I., Kretschmar, P., Santangelo, A., et al. 2007, A&A, 465, L21
- Caballero et al. (2012) Caballero, I., Müller, S., Bordas, P., et al. 2012, in American Institute of Physics Conference Series, Vol. 1427, American Institute of Physics Conference Series, ed. R. Petre, K. Mitsuda, & L. Angelini, 300–301
- Caballero et al. (2013) Caballero, I., Pottschmidt, K., Marcu, D. M., et al. 2013, ApJ, 764, L23
- Caballero et al. (2011c) Caballero, I., Pottschmidt, K., Santangelo, A., et al. 2011c, ArXiv e-prints
- Caballero et al. (2008) Caballero, I., Santangelo, A., Kretschmar, P., et al. 2008, A&A, 480, L17
- Caballero et al. (2010) Caballero, I., Santangelo, A., Pottschmidt, K., et al. 2010, The Astronomer’s Telegram, 2541, 1
- Camero-Arranz et al. (2011) Camero-Arranz, A., Finger, M. H., Wilson-Hodge, C., et al. 2011, The Astronomer’s Telegram, 3166, 1
- Ferrigno et al. (2011) Ferrigno, C., Falanga, M., Bozzo, E., et al. 2011, A&A, 532, A76
- Finger et al. (2006) Finger, M. H., Camero-Arranz, A., Kretschmar, P., Wilson, C., & Patel, S. 2006, in Bulletin of the American Astronomical Society, Vol. 38, AAS/High Energy Astrophysics Division #9, 359
- Finger et al. (1996) Finger, M. H., Wilson, R. B., & Harmon, B. A. 1996, ApJ, 459, 288
- Giangrande et al. (1980) Giangrande, A., Giovannelli, F., Bartolini, C., Guarnieri, A., & Piccioni, A. 1980, A&AS, 40, 289
- Grove et al. (1995) Grove, J. E., Strickman, M. S., Johnson, W. N., et al. 1995, ApJ, 438, L25
- Harding & Daugherty (1991) Harding, A. K. & Daugherty, J. K. 1991, ApJ, 374, 687
- Isenberg et al. (1998) Isenberg, M., Lamb, D. Q., & Wang, J. C. L. 1998, ApJ, 493, 154
- Jahoda et al. (2006) Jahoda, K., Markwardt, C. B., Radeva, Y., et al. 2006, ApJS, 163, 401
- Kendziorra et al. (1994) Kendziorra, E., Kretschmar, P., Pan, H. C., et al. 1994, A&A, 291, L31
- Klochkov et al. (2012) Klochkov, D., Doroshenko, V., Santangelo, A., et al. 2012, A&A, 542, L28
- Klochkov et al. (2011) Klochkov, D., Staubert, R., Santangelo, A., Rothschild, R. E., & Ferrigno, C. 2011, A&A, 532, A126
- Kraus et al. (1995) Kraus, U., Nollert, H.-P., Ruder, H., & Riffert, H. 1995, ApJ, 450, 763
- Krimm et al. (2009) Krimm, H. A., Barthelmy, S. D., Baumgartner, W., et al. 2009, The Astronomer’s Telegram, 2336, 1
- Lebrun et al. (2003) Lebrun, F., Leray, J. P., Lavocat, P., et al. 2003, A&A, 411, L141
- Li et al. (1979) Li, F., Clark, G. W., Jernigan, J. G., & Rappaport, S. 1979, ApJ, 228, 893
- Lund et al. (2003) Lund, N., Budtz-Jørgensen, C., Westergaard, N. J., et al. 2003, A&A, 411, L231
- Makino et al. (1989) Makino, F., Cook, W., Grunsfeld, J., et al. 1989, IAU Circ., 4769, 1
- Motch et al. (1991) Motch, C., Stella, L., Janot-Pacheco, E., & Mouchet, M. 1991, ApJ, 369, 490
- Mowlavi et al. (2006) Mowlavi, N., Kreykenbohm, I., Shaw, S. E., et al. 2006, A&A, 451, 187
- Nagase et al. (1982) Nagase, F., Hayakawa, S., Kunieda, H., et al. 1982, ApJ, 263, 814
- Pottschmidt et al. (2006) Pottschmidt, K., Rothschild, R. E., Gasaway, T., Suchy, S., & Coburn, W. 2006, in Bulletin of the American Astronomical Society, Vol. 38, AAS/High Energy Astrophysics Division #9, 384–+
- Ricketts et al. (1975) Ricketts, M. J., Turner, M. J. L., Page, C. G., & Pounds, K. A. 1975, Nature, 256, 631
- Rosenberg et al. (1975) Rosenberg, F. D., Eyles, C. J., Skinner, G. K., & Willmore, A. P. 1975, Nature, 256, 628
- Rothschild et al. (1998) Rothschild, R. E., Blanco, P. R., Gruber, D. E., et al. 1998, ApJ, 496, 538
- Rothschild et al. (2011) Rothschild, R. E., Markowitz, A., Rivers, E., et al. 2011, ApJ, 733, 23
- Rothschild et al. (2006) Rothschild, R. E., Wilms, J., Tomsick, J., et al. 2006, ApJ, 641, 801
- Sembay et al. (1990) Sembay, S., Schwartz, R. A., Orwig, L. E., Dennis, B. R., & Davies, S. R. 1990, ApJ, 351, 675
- Staubert et al. (2007) Staubert, R., Shakura, N. I., Postnov, K., et al. 2007, A&A, 465, L25
- Steele et al. (1998) Steele, I. A., Negueruela, I., Coe, M. J., & Roche, P. 1998, MNRAS, 297, L5+
- Stella et al. (1986) Stella, L., White, N. E., & Rosner, R. 1986, ApJ, 308, 669
- Tchernin et al. (2011) Tchernin, C., Ferrigno, C., & Bozzo, E. 2011, The Astronomer’s Telegram, 3173, 1
- Truemper et al. (1978) Truemper, J., Pietsch, W., Reppin, C., et al. 1978, ApJ, 219, L105
- Tsygankov et al. (2006) Tsygankov, S. S., Lutovinov, A. A., Churazov, E. M., & Sunyaev, R. A. 2006, MNRAS, 371, 19
- Tsygankov et al. (2007) Tsygankov, S. S., Lutovinov, A. A., Churazov, E. M., & Sunyaev, R. A. 2007, Astronomy Letters, 33, 368
- Tsygankov et al. (2010) Tsygankov, S. S., Lutovinov, A. A., & Serber, A. V. 2010, MNRAS, 401, 1628
- Tueller et al. (2005) Tueller, J., Ajello, M., Barthelmy, S., et al. 2005, The Astronomer’s Telegram, 504, 1
- Ubertini et al. (2003) Ubertini, P., Lebrun, F., Di Cocco, G., et al. 2003, A&A, 411, L131
- Winkler et al. (2003) Winkler, C., Courvoisier, T. J.-L., Di Cocco, G., et al. 2003, A&A, 411, L1