AMI Observations of the Anomalous Microwave Emission in the Perseus Molecular Cloud
Abstract
We present observations of the known anomalous microwave emission region, G159.6-18.5, in the Perseus molecular cloud at 16 GHz performed with the Arcminute Microkelvin Imager Small Array. These are the highest angular resolution observations of G159.6-18.5 at microwave wavelengths. By combining these microwave data with infrared observations between 5.8 and 160 m from the Spitzer Space Telescope, we investigate the existence of a microwave – infrared correlation on angular scales of 2 arcmin. We find that the overall correlation appears to increase towards shorter infrared wavelengths, which is consistent with the microwave emission being produced by electric dipole radiation from small, spinning dust grains. We also find that the microwave – infrared correlation peaks at 24 m (6.7), suggesting that the microwave emission is originating from a population of stochastically heated small interstellar dust grains rather than polycyclic aromatic hydrocarbons.
Subject headings:
dust, extinction – Infrared: ISM – ISM: clouds – ISM: general – ISM: individual objects (G159.6-18.5) – Radio continuum: ISM1. Introduction
A new Galactic emission mechanism, commonly referred to as anomalous microwave emission (AME), has been observed by a number of experiments aimed at measuring fluctuations in the Cosmic Microwave Background (CMB) in the frequency range 10 – 100 GHz (e.g. Leitch et al., 1997). Studies over the last decade have shown that AME is prevalent in a variety of Galactic environments such as molecular clouds (Watson et al., 2005; Casassus et al., 2008; Tibbs et al., 2010; Planck Collaboration, 2011), dark clouds (Casassus et al., 2006; AMI Consortium: Scaife et al., 2009a, b; Dickinson et al., 2010), Hii regions (Dickinson et al., 2007, 2009; Tibbs et al., 2012), and in the diffuse interstellar medium (Leitch et al., 1997; Lagache, 2003; Miville-Deschênes et al., 2008; Ghosh et al., 2012). AME has also been detected within a star forming region in the external galaxy NGC 6946 (Murphy et al., 2010; AMI Consortium: Scaife et al., 2010). The AME is observed as an excess of emission at cm wavelengths above the other Galactic emission mechanisms and is expected to be a substantial contaminant to the CMB in the frequency range 10 – 100 GHz. Hence, it is of critical importance that we completely comprehend the physical emission mechanism involved.
The current favored explanation for the source of this emission is electric dipole radiation originating from rapidly rotating very small dust grains (Draine & Lazarian, 1998). Interstellar dust grains are responsible for the mid- to far-infrared (IR) emission, which is generally thought to be produced by a combination of stochastic and thermal equilibrium emission processes. The stochastic emission observed at mid-IR wavelengths ( 3 – 70 m) is generated by emission from polycyclic aromatic hydrocarbons (PAHs) and a population of small carbonaceous dust grains, while larger silicate dust grains are responsible for the thermal equilibrium emission at far-IR wavelengths ( 70 m). The spinning dust hypothesis implies that there is an intrinsic link between the AME and the stochastic emission observed in the mid-IR as both are produced by small interstellar dust grains. If the spinning dust mechanism proves to be correct, then AME studies represent a new window in which to probe small interstellar dust grains and the physics involved.
In this analysis we focus on a known region of AME in the vicinity of the Perseus molecular cloud. The dust feature G159.6-18.5 has previously been studied and found to exhibit AME on angular scales of 1 degree (Watson et al., 2005; Planck Collaboration, 2011) and 10 arcmin (Tibbs et al., 2010). Also, a recent study performed by Tibbs et al. (2011) used IR observations of the region to characterize the dust properties and investigate the physical conditions in which the AME is observed. In this work, we present new observations of the Perseus molecular cloud performed with the Arcminute Microkelvin Imager (AMI) Small Array (SA). These observations represent the highest angular resolution observations of this region at microwave wavelengths to date, and allow us to investigate the AME on angular scales of 2 arcmin, providing further insight into the physical processes producing the AME.
2. Observations
2.1. AMI SA Data
The AMI SA is a radio interferometer consisting of ten 3.7 m antennas situated at Mullard Radio Astronomy Observatory, Lord’s Bridge, Cambridge. The array has a baseline range of 5 – 20 m and operates in eight 0.75 GHz channels over the frequency range 12 – 18 GHz (AMI Consortium: Zwart et al., 2008). However, due to interference from geostationary satellites, the two lowest frequency channels were ignored throughout this analysis.
| Target | RA | Dec | r.m.s. noise |
|---|---|---|---|
| (J2000) | (J2000) | (mJy beam-1) | |
| Per1 | 03:44:34.6 | +32:08:07.3 | 0.20 |
| Per2 | 03:39:57.7 | +31:56:14.1 | 0.26 |
| Per3 | 03:37:20.7 | +31:23:29.3 | 0.24 |
| Per4 | 03:43:17.6 | +32:00:28.9 | 0.30 |
| Per5 | 03:43:02.2 | +31:43:25.7 | 0.32 |
| Per6 | 03:42:49.5 | +31:29:34.3 | 0.35 |
| Per7 | 03:40:24.5 | +31:15:43.1 | 0.39 |
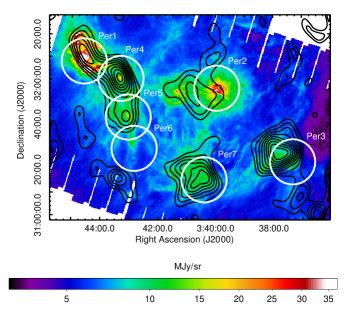
The AMI SA has a typical system temperature of 25 K, and the point source sensitivity of the array is 30 mJy s1/2, which corresponds to 0.2 mJy over an 8 hour observing run. Observations of G159.6-18.5 were performed throughout June and July 2010, with a total of seven individual pointings (see Table 1). The location of the pointings was chosen to coincide with both the AME features previously observed with the Very Small Array (VSA) at 33 GHz on angular scales of 10 arcmin (Tibbs et al., 2010), and the small scale structure present in the mid-IR Spitzer maps of the region (Tibbs et al., 2011). Figure 1 displays a map of the 24 m emission overlaid with the VSA 33 GHz contours highlighting the strong spatial correlation between the microwave and mid-IR emission on angular scales of 10 arcmin. Also displayed in Figure 1 are the seven AMI SA pointings listed in Table 1.
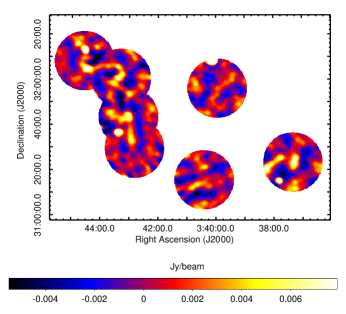
Data reduction was performed using the reduce software package. reduce was specifically designed for AMI observations and automatically flags interference, shadowing, and hardware errors, applies path delay corrections and performs phase and flux density calibrations. Phase calibration was performed using observations of J0359+3220, while flux density calibration was performed using short observations of 3C48. The reduced data were imaged using the aips data package. The task imagr was used to perform both the Fourier Transform and deconvolution for all of the pointings. This task uses a CLEAN based algorithm to perform the deconvolution and we implemented a Briggs robust parameter of 0, which provides a compromise between uniform and natural weighting, and a small loop gain to help retain the extended emission. This resulted in seven CLEAN maps, one for each pointing, and the r.m.s. noise in each of these maps is listed in Table 1. These seven pointings were primary beam corrected and combined to produce a mosaic of the region as displayed in Figure 2. The half power point of the AMI SA primary beam is 20 arcmin at 16 GHz, and the mean AMI SA synthesized beam (FWHM) for these observations is 2.6 2.1 arcmin2 at 16 GHz.
2.2. NVSS Data
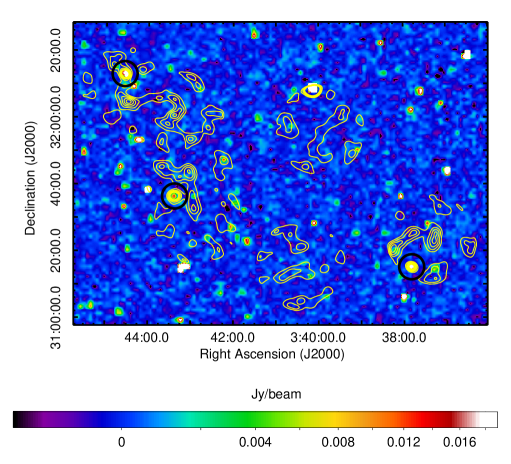
To identify compact radio sources within the region we used the NVSS 1.4 GHz map (Condon et al., 1998). Figure 3 displays the NVSS map of G159.6-18.5 overlaid with the AMI SA contours. We find three point sources in the AMI SA mosaic, all of which correspond to a source in the NVSS 1.4 GHz map. These sources, which are highlighted in Figure 3, are listed in Table 2 along with the measured flux density at 16 GHz. The errors include a fitting error combined in quadrature with a 5 % calibration uncertainty. The location of these sources is such that they do not contaminate the bulk of the extended emission observed in the AMI SA map. It is also apparent that there is a significant lack of correlation between the emission observed with the AMI SA at 16 GHz and the 1.4 GHz emission, which suggests that the source of the emission in the AMI SA mosaic is not originating from either free-free or synchrotron emission. Based on observations performed on both 1 degree and 10 arcmin angular scales, the AME accounts for 80 % of the cm emission in G159.6-18.5 (Watson et al., 2005; Planck Collaboration, 2011; Tibbs et al., 2010). Additionally, new observations of G159.6-18.5 obtained with the Robert C. Byrd Green Bank Telescope at 1.4 and 5 GHz (Tibbs et al., 2013) show that the AME observed in this region with the VSA (Tibbs et al., 2010) cannot be accounted for by free-free or synchrotron emission.
| Source | RA | Dec | |
|---|---|---|---|
| (J2000) | (J2000) | (mJy) | |
| NVSS J034433+321255 | 03:44:33.7 | +32:13:04.0 | 18.82 3.30 |
| NVSS J033749+311514 | 03:37:49.4 | +31:15:16.4 | 20.43 3.51 |
| NVSS J034323+313643 | 03:43:22.7 | +31:36:30.7 | 21.78 3.51 |
2.3. Spitzer Data
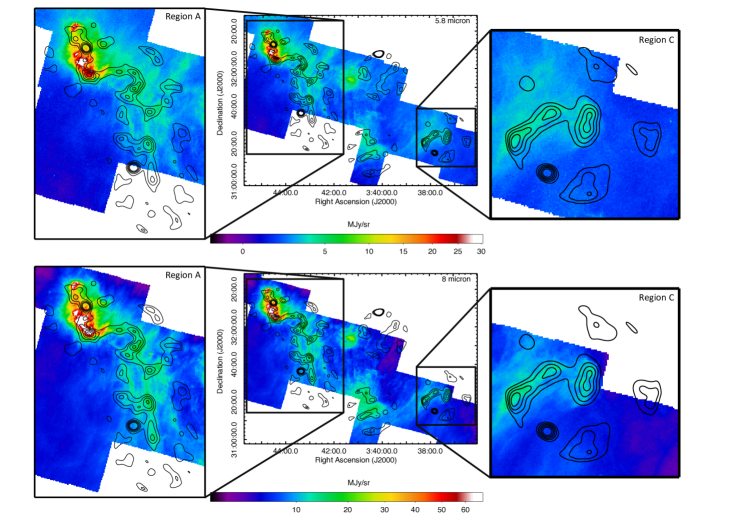
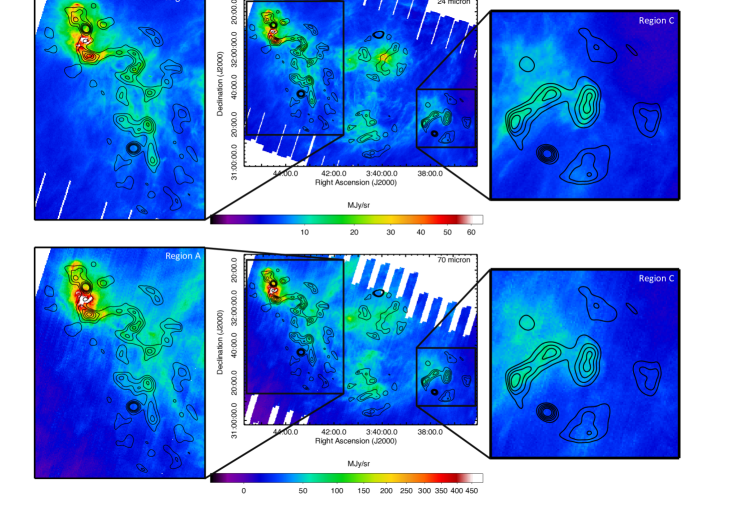
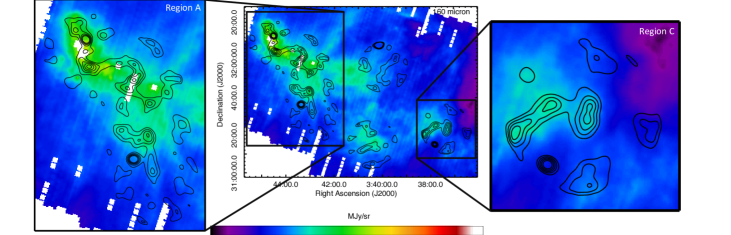
The Perseus molecular cloud has been observed at mid- to far-IR wavelengths with the Spitzer Space Telescope as part of the Cores to Disks (c2d) Legacy Program (Evans et al., 2003). However, the IR data used in this analysis are the reprocessed c2d Spitzer data that are described by Tibbs et al. (2011). These data include IRAC maps of G159.6-18.5 at 5.8 and 8 m and MIPS maps at 24, 70, and 160 m. These five Spitzer maps, all of which have been point source subtracted, provide adequate wavelength coverage incorporating both the stochastically heated dust grains emitting at mid-IR wavelengths and the dust in thermal equilibrium with the exciting radiation field, which emits at longer wavelengths. Figures 4 and 5 display G159.6-18.5 as observed with the two Spitzer IRAC bands and the three Spitzer MIPS bands, respectively. Contours of the AMI SA emission are overlaid on all five of the Spitzer maps.
3. Microwave – IR Correlation
One of the diagnostics of AME is the strong spatial correlation between the microwave and IR emission. Using the new AMI SA observations presented in Section 2.1 along with the Spitzer data described in Section 2.3, we investigated this microwave – IR correlation in G159.6-18.5 at higher angular resolution than has been performed previously. In Figures 4 and 5 we display G159.6-18.5 with the AMI SA contours overlaid on the Spitzer maps at 5.8, 8, 24, 70, and 160 m. We defined sub regions within the cloud following a similar naming convention as defined by Tibbs et al. (2010) for the VSA observations. Region A is defined as the mini mosaic of pointings Per1, Per4, Per5, and Per6, while region B, region C, and region D correspond to pointings Per7, Per3, and Per2, respectively. Looking at Figures 4 and 5, particularly the zoomed in views of sub regions A and C, it is evident that the microwave emission is spatially correlated with the IR emission. In fact, the microwave emission traces the filamentary structure of the dust, confirming that the microwave – IR correlation identified previously in G159.6-18.5 on 10 arcmin angular scales by Tibbs et al. (2010) is still present on the angular scales observed by the AMI SA ( 2 arcmin).
To quantify the observed correlation between the microwave and IR emission, we performed a Pearson correlation analysis. However, since the AMI SA is an interferometer most of the extended emission is resolved out, and therefore the AMI SA data and the Spitzer data cannot be compared directly. To overcome this issue, the Spitzer data must be resampled with the AMI SA sampling distribution to account for the incomplete u,v coverage. This task was performed using the aips routine uvsub, which applies the AMI SA sampling distribution to the Spitzer data.
After resampling the Spitzer data, a Pearson correlation analysis was performed in the image plane between the AMI SA map and the five resampled Spitzer maps. Before performing the correlation, all the maps were regridded to a common 1 arcmin pixel grid to ensure the data obeyed the Nyquist sampling theorem, which ensures that each pixel represents approximately independent data points. All six maps (see Figure 6) were then trimmed to ensure that only the sky coverage common to all the maps was included in the analysis. This also ensures that any artificial edge effects due to the Fourier Transform do not bias the correlation. As we are only interested in the extended emission, the three sources identified in Section 2.2 were masked and excluded from the rest of this analysis. The results of the correlation analysis are displayed in Figure 7, which plots the Pearson correlation coefficient as a function of wavelength. All uncertainties on the correlation coefficients were estimated using the Fisher to transformation (Fisher, 1915), and computing the 68 % confidence interval.
4. Discussion
The results of the Pearson correlation analysis displayed in Figure 7, and listed in Table 3, show a clear peak in the correlation at 24 m at a statistical level of 6.7. In absolute terms, the peak at 24 m, with a correlation coefficient of 0.46 0.02, is not a particularly strong correlation, however, as we discuss later, what is interesting is how the relative correlation coefficients vary as a function of wavelength. In addition to the peak in the correlation at 24 m, we find that even if we ignore the 24 m data point, there is a hint (1.4) of a non-zero correlation between the Pearson correlation coefficients and the IR wavelengths, which increases at shorter wavelengths. This result tentatively implies that the AME is more correlated with the shorter IR wavelengths, and it is possible to observe this effect by looking at Figure 6 where the correlation is clearly stronger with the shorter IR wavelengths. The shorter IR wavelength emission is due to stochastically heated, small dust grains, and this result suggests that the AME is more strongly correlated with the smaller dust grains, which is consistent with the spinning dust hypothesis, where only the smallest dust grains can spin at the frequencies required to produce the observed AME. A similar result was obtained by Casassus et al. (2006) for LDN1622, where they found that the microwave – IR correlation increased towards shorter IR wavelengths.

Ultra-compact Hii (UCHii) regions, characterized by densities of cm-3, emission measures of pc cm-6, and physical sizes of 0.1 pc (Wood & Churchwell, 1989), could possibly contaminate the microwave – IR correlation. However, these objects would appear bright and point-like in the AMI SA map, and as shown in Section 2.2, there are only three point sources identified in the AMI SA map. These three sources are all extragalactic radio sources, and as stated in Section 3, they were masked for the correlation analysis, thereby ruling out any possible contamination from UCHii regions.
To further investigate the microwave – IR correlation, we repeated the Pearson correlation analysis. However, this time we performed the analysis separately for each of the sub regions within G159.6-18.5 to allow us to better understand how the microwave – IR correlation varies throughout the cloud. The results of the correlation analysis performed on these sub regions are displayed in Figure 8, and tabulated in Table 3, and show that there is a clear variation in the microwave – IR correlation throughout the entire region.
For regions A and B, the correlation increases from 160 to 70 m and peaks at 24 m before falling sharply to 8 and 5.8 m. This is similar to what was found for the entire mosaic. Region C shows a flat correlation from 160 to 24 m, with a non-significant peak at 70 m. This implies that the large dust grains and the small dust grains must be well mixed in this region. However, as is seen in regions A and B, in region C the correlation falls at 8 and 5.8 m. For region D, the correlation increases from 160 to 70 m, then decreases at 24 m, before rising again at 8 and 5.8 m. Region D corresponds to the central region of the shell of G159.6-18.5 containing the B0 V star HD 278942, which is thought to be responsible for the entire shell-like structure. As discussed by Tibbs et al. (2010, 2011), due to the presence of this star, this region is dominated by a very hot dust component that can be seen in the 24 m Spitzer map. It is therefore likely that the emission at 24 m from this region is not due to stochastically heated small dust grains, but is in fact due to thermal emission of large dust grains which have been heated to such temperatures that cause it to emit at 24 m. This would therefore explain the lack of correlation between the microwave emission and the 24 m emission in this region.
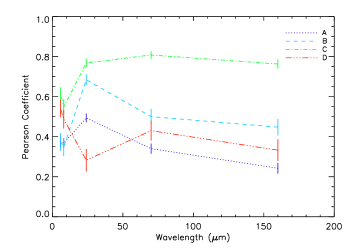
One interesting result is that the correlation does not appear to peak at 5.8 or 8 m for any of the sub regions, with the exception of region D, but even this does not show a strong peak. In fact, we find that for regions A, B, and C, the correlation actually decreases from 24 m to 8 and 5.8 m. These results are consistent with the results found for the entire region, which shows a stronger correlation at 24 m than at either 5.8 or 8 m. Assuming that contamination from spectral lines is negligible, the IRAC 5.8 and 8 m bands, which cover the wavelength of known PAH features at 6.2 and 7.7 m, are expected to trace the PAH emission, while the 24 m emission is due to stochastically heated small dust grains. The fact that we do not find a peak in the correlation at 5.8 or 8 m, but actually at 24 m, appears to suggest that the AME is originating from a population of small dust grains rather than PAHs.
| Wavelength | Entire | Region A | Region B | Region C | Region D |
|---|---|---|---|---|---|
| (m) | Region | ||||
| 5.8 | 0.34 0.02 | 0.37 0.02 | 0.37 0.04 | 0.61 0.03 | 0.54 0.04 |
| 8 | 0.35 0.02 | 0.37 0.02 | 0.35 0.04 | 0.55 0.04 | 0.49 0.05 |
| 24 | 0.46 0.02 | 0.49 0.02 | 0.68 0.03 | 0.77 0.02 | 0.28 0.06 |
| 70 | 0.34 0.02 | 0.34 0.03 | 0.50 0.04 | 0.81 0.02 | 0.43 0.05 |
| 160 | 0.32 0.02 | 0.24 0.03 | 0.45 0.04 | 0.76 0.02 | 0.33 0.05 |
A recent study of this region was performed by Tibbs et al. (2011), who used IR observations to constrain the properties of the dust and investigated the physical conditions in which the AME is observed. Tibbs et al. (2011) found that there was an enhancement in the exciting radiation field in regions of AME. It may be possible that this is what we are observing here, and it is the excitation at 24 m, rather than the abundance of the small dust grains, that is producing the correlation with the AME. This is also consistent with the result found in the Hii region RCW175 by Tibbs et al. (2012), where the AME was highly correlated with the radiation field. If this is the case, then this suggests that the excitation mechanism of the AME may be more important than the abundance of the carriers. This idea has previously been discussed by Casassus et al. (2008), who found that the environmental factors that boost the spinning dust emissivities are more dominant than the abundance of the carriers.
5. Conclusions
In order to accurately characterize foreground contaminants to the CMB in the microwave regime, the physical emission mechanism responsible for producing AME must be understood. In this work we present observations of the dust feature G159.6-18.5, located in the Perseus molecular cloud, with the AMI SA. In total, seven pointings were observed and these observations represent the highest angular resolution data of the AME within this region. These seven pointings were compared to the low frequency NVSS data to ensure that there is minimal contamination from free-free emission and emission from UCHii regions, confirming that the bulk of the AMI SA emission is due to AME.
We made use of the available high resolution IR observations obtained with the Spitzer Space Telescope to investigate the microwave – IR correlation. These IR observations were resampled with the AMI SA sampling distribution, to account for the incomplete coverage of the u,v plane, and a Pearson correlation analysis was performed. The results of this analysis confirm that the microwave – IR correlation observed on angular scales of 10 arcmin is still present on angular scales of 2 arcmin. We find that the microwave – IR correlation tentatively increases towards shorter wavelengths, which is what you would expect if the AME is produced by the smallest dust grains. This result is consistent with the spinning dust hypothesis, however, we also found a significant peak in the microwave – IR correlation at 24 m (6.7), suggesting that the AME is being produced by small dust grains rather than PAHs. This result is a significant step forward in improving our understanding of the AME, however, this is only one region and only by studying a wide variety of AME regions will we be able to gain a more complete picture of the AME.
Acknowledgments
We thank A. Noriega-Crespo and S. Carey for stimulating discussions. We also thank the referee for providing detailed comments that have substantially improved the content of this paper. This work has been performed within the framework of a NASA/ADP ROSES-2009 grant, no. 09-ADP09-0059. CD acknowledges support from an STFC Advanced Fellowship and an EU Marie-Curie IRG grant under the FP7. We thank the staff of the Mullard Radio Astronomy Observatory for their invaluable assistance in the commissioning and operation of AMI, which is supported by Cambridge University and the STFC.
References
- AMI Consortium: Scaife et al. (2009a) AMI Consortium: Scaife, A. M. M., Hurley-Walker, N., Green, D. A., et al. 2009a, MNRAS, 394, L46
- AMI Consortium: Scaife et al. (2009b) AMI Consortium: Scaife, A. M. M., Hurley-Walker, N., Green, D. A., et al. 2009b, MNRAS, 400, 1394
- AMI Consortium: Scaife et al. (2010) AMI Consortium: Scaife, A. M. M., Nikolic, B., Green, D. A., et al. 2010, MNRAS, 406, L45
- AMI Consortium: Zwart et al. (2008) AMI Consortium: Zwart, J. T. L., Barker, R. W., Biddulph, P., et al. 2008, MNRAS, 391, 1545
- Casassus et al. (2006) Casassus, S., Cabrera, G. F., Förster, F., et al. 2006, ApJ, 639, 951
- Casassus et al. (2008) Casassus, S., Dickinson, C., Cleary, K., et al. 2008, MNRAS, 391, 1075
- Condon et al. (1998) Condon, J. J., Cotton, W. D., Greisen, E. W., et al. 1998, AJ, 115, 1693
- Dickinson et al. (2007) Dickinson, C., Davies, R. D., Bronfman, L., et al. 2007, MNRAS, 379, 297
- Dickinson et al. (2009) Dickinson, C., Davies, R. D., Allison, J. R., et al. 2009, ApJ, 690, 1585
- Dickinson et al. (2010) Dickinson, C., Casassus, S., Davies, R. D., et al. 2010, MNRAS, 407, 2223
- Draine & Lazarian (1998) Draine B. T., Lazarian A., 1998, ApJ, 508, 157
- Evans et al. (2003) Evans, N. J., II, Allen, L. E., Blake, G. A., et al. 2003, PASP, 115, 965
- Fisher (1915) Fisher R. A., 1915, Biometrika, 10, 507
- Ghosh et al. (2012) Ghosh, T., Banday, A. J., Jaffe, T., et al. 2012, MNRAS, 422, 3617
- Lagache (2003) Lagache G., 2003, A&A, 405, 813
- Leitch et al. (1997) Leitch, E. M., Readhead, A. C. S., Pearson, T. J., & Myers, S. T. 1997, ApJ, 486, L23
- Miville-Deschênes et al. (2008) Miville-Deschênes, M.-A., Ysard, N., Lavabre, A., et al. 2008, A&A, 490, 1093
- Murphy et al. (2010) Murphy, E. J., Helou, G., Condon, J. J., et al. 2010, ApJ, 709, L108
- Planck Collaboration (2011) Planck Collaboration, Ade, P. A. R., Aghanim, N., Arnaud, M., et al. 2011, A&A, 536, A20
- Tibbs et al. (2010) Tibbs C. T., Watson R. A., Dickinson C., et al. 2010, MNRAS, 402, 1969
- Tibbs et al. (2011) Tibbs, C. T., Flagey, N., Paladini, R., et al. 2011, MNRAS, 418, 1889
- Tibbs et al. (2012) Tibbs, C. T., Paladini, R., Compiegne, M., et al. 2012, ApJ, 754, 94
- Tibbs et al. (2013) Tibbs, C. T., Paladini, R., Dickinson, C., et al. 2013, submitted to ApJ
- Watson et al. (2005) Watson, R. A., Rebolo, R., Rubiño-Martín, J. A., et al. 2005, ApJ, 624, L89
- Wood & Churchwell (1989) Wood, D. O. S., & Churchwell, E. 1989, ApJS, 69, 831