INSIGHTS INTO AGN AND HOST GALAXY CO-EVOLUTION FROM HARD X-RAY EMISSION
Abstract
We study the AGN-host co-evolution issue here by focusing on the correlation between the hard X-ray emission from central AGNs and the stellar populations of the host galaxies. By focusing on the galaxies with strong H line emission (EW(HÅ), both X-ray and optical spectral analysis are performed on 67 (partially) obscured AGNs that are selected from the XMM-Newton 2XMMi/SDSS-DR7 catalog originally cross-matched by Pineau et al. The sample allows us to study central AGN activity and host galaxy directly and simultaneously in individual objects. Combining the spectral analysis in both bands reveals that the older the stellar population of the host galaxy, the harder the X-ray emission will be, which was missed in our previous study where the ROSAT hardness ratios are used. By excluding the contamination from the host galaxies and from the jet beaming emission, the correlation indicates that the Compton cooling in the accretion disk corona decreases with the mean age of the stellar population. We argue that the correlation is related to the correlation of with the host stellar population. In addition, the [O I]/H and [S II]/H narrow-line ratios are identified to correlate with the spectral slope in hard X-ray, which can be inferred from the currently proposed evolution of the X-ray emission because of the confirmed tight correlations between the two line ratios and stellar population age.
1 INTRODUCTION
The co-evolution of active galactic nuclei (AGNs) and their host galaxies has been a hot topic in astrophysics for many years. The co-evolution issue is basically implied by several observational facts. At first, the mass of a central supermassive blackhole (SMBH) is found to be strongly correlated with various properties of the host galaxy where the SMBH resides in. These properties include the velocity dispersion, luminosity and mass of the bulge of the host galaxy (e.g., Magorrian et al. 1998; Tremaine et al. 2002; Ferrarese & Merritt 2000; Greene & Ho 2006; Greene et al. 2008; Haring & Rix 2004; Gebhardt et al. 2000a, b; Merritt & Ferrarese 2001; McLure & Dunlop 2002; Woo & Urry 2002; Woo et al. 2010; Ferrarese & Ford 2005; Gultekin et al. 2009). Secondly, the cosmic star formation history is found to be traced by the evolution of number density of Quasi-stellar objects (QSOs), and by the growth of central SMBH since to the present (e.g., Nandra et al. 2005; Silverman et al. 2008; Shankar et al. 2009; Hasinger et al. 2005; Ueda et al. 2003; Croom et al. 2004; Aird et al. 2010; Assef et al. 2011). Thirdly, about half of local AGNs are identified to be associated with circumnuclear young stellar populations and violent ongoing star formation activities (see Wang & Wei 2010 for a brief summary of the references). Finally, both AGNs and starforming galaxies show the “down-sizing” effect in which both activities at later epoch predominantly occur in the less massive systems with lower luminosities (e.g., Cowie et al. 2003; Bongiorno et al. 2007; Ueda et al. 2003; McLure & Dunlop 2004; Hasinger et al. 2005; Alonso-Herrero et al. 2008).
With these implications, significant observational progress has been achieved in the past decade to understand the elusive evolutionary relationship between the star formation and SMBH growth. Heckman & Kauffmann (2006 and references therein) indicates that the majority of local SMBH growth occurs not only in high accretion phase, but also in the galaxies with young stellar populations and with ongoing or recent star formations. This conclusion is recently extended to less massive SMBH by Goulding et al. (2010). Not only the theoretical simulations, but also the analysis of AGN’s host galaxies suggest a possible delay of Myr for the detectable AGN phenomenon after the onset of star formation activity (e.g., Wang & Wei 2006; Schawinski et al. 2007; Reichard et al. 2008; Li et al. 2008; Wild et al. 2010; Zhou et al. 2005, Davis et al. 2007; Hopkins et al. 2005). Moreover, as compared to the distribution of quiescent galaxies, observations show that there is an excess of AGNs in the “green valley” between the blue cloud and red sequence, which is commonly interpreted by the suppression of star formation due to the feed back from AGNs (e.g., Sanchez et al. 2004; Nandra et al. 2007; Schawinski et al. 2009; Treister et al. 2009).
A natural question on the complicated co-evolution issue is how AGNs co-evolve with their host galaxies, and which parameter of AGN’s accretion determines the coevolution. In order to answer the question, one needs to study both accretion activity and host galaxy properties simultaneously in individual AGN. It is well known that AGNs are luminous X-ray emitters up to 100keV. The hard X-ray emission is a powerful tool to identify nuclear SMBH accretion activity and to study the accretion process that fuels AGNs, both because it can penetrate the obscuration material much more easily than lower energy emission and because it is produced in the region very close to SMBH. Wang et al. (2010) studied a sample of ROSAT-selected partially obscured AGNs to explore the evolutionary role of the X-ray emission. Although the X-ray spectral slopes are found to be roughly correlated with the two narrow emission-line ratios, i.e., [O I]/H and [S II]/H, the authors failed in identifying a correlation between the slopes and host galaxy stellar population ages. They argued that the nondetection of the correlation is mainly due to the large uncertainties of the used X-ray spectral slopes. The slopes are estimated from the ROSAT hardness ratios, and the intrinsic absorptions are entirely ignored in their study. To overcome this fundamental drawback, we perform a systematic spectral study on a sample selected from the XMM-Newton 2XMMi catalog cross-correlated with Data Release 7 of the Sloan Digital Sky Survey (SDSS) to explore the co-evolution of the AGN’s X-ray emission and AGN’s host galaxy. The cross-correlation was originally done by Pineau et al. (2011). In the current study, we mainly focus on the type II and partially obscured AGNs because the starlight component from host galaxy and the narrow emission-lines can be easily and accurately extracted from individual observed optical spectrum. Meanwhile, it is emphasized that the X-ray spectral slope can be highly improved for individual object through the spectral fitting on the wider energy band. The XMM-Newton satellite (Jansen et al. 2001) was launched by the European Space Agency in 1999. The instruments onboard the satellite works in the energy range from 0.2 to 12 keV.
The paper is organized as follows. §2 presents the sample selection and data reductions, including the starlight component removal, line profile modeling and X-ray spectral fitting. The analysis and results are shown in §3. The discussion is presented in §4. A cold dark matter (CDM) cosmology with parameters = 0.7, = 0.3, and = 0.7 (Spergel et al. 2003) is adopted throughout the paper.
2 SAMPLE SELECTION AND DATA REDUCTION
2.1 Sample Selection From the 2XMMi/SDSS-DR7 Catalog
The incremental Second XMM-Newton Serendipitous Source Catalog (2XMMi) is an updated version of the 2XMM catalog (Watson et al. 2009). The 2XMMi catalog contains a total of 221,012 unique, serendipitous X-ray sources, and is the largest catalog of X-ray sources ever published at that time. Because of the high throughput of the EPIC cameras onboard the XMM-Newton satellite, the catalog reaches a 90% completeness at a sensitive of and in the 0.5-2.0 keV and 2.0-12.0 keV bandpass, respectively. An accuracy of 2″ is typical for the source positions. Pineau et al. (2011 and references therein) recently performed a 2XMMi/SDSS program to identify the optical counterparts of the XMM-Newton X-ray sources from the SDSS-DR7 catalog (Abazajian et al. 2009). The cross-correlation uses the traditionally adopted likelihood ratio estimator that is only based on the probability of spatial coincidence of the X-ray source and the optical candidate. By only considering the point-like sources with a position accuracy in X-ray, the cross-correlation returns a total of more than 30,000 X-ray sources that have a SDSS-DR7 optical counterpart with an identification probability larger than 90% (Pineau et al. 2011).
A sub-sample is selected from the 2XMMi/SDSS-DR7 catalog as follows. At first, to exclude spurious matches as far as possible, we require that a) the probability of identification is no less than 95%; b) the angular distance between individual XMM-newton X-ray source and the corresponding optical counterpart is not larger than 3″, taking into account of the SDSS fiber aperture111The middle panel in Figure 3 in Pineau et al. (2011) shows that there are a few of matched objects whose matching distances are larger than 5″, even when the identification probability is larger than 95%. The aperture selection criterion is useful to ensure that the detected X-ray emission mainly comes from the center of each galaxy because the SDSS fiber is located on the center of each galaxy by the SDSS photometric analysis.; c) the redshift is smaller than 0.2; d) the objects are not classified as star, according to the spectral type classification given by the SDSS pipelines (Glazebrook et al. 1998; Bromley et al. 1998). There are 1327 objects fulfilling the above criteria. In order to avoid the effect caused by the optical spectra with poor quality, we further require that the -band brightness is brighter than 19 mag. An equivalent width of the H emission line larger than 5Å is necessary to exclude BL Lac objects and quiescent galaxies (e.g., the so-called X-ray Bright Optically Normal Galaxies, XBONGs) as far as possible (e.g., Caccianiga et al. 2008), because one can not ensure that the X-ray emission from the quiescent galaxies (especially the elliptical galaxies) do come from the central AGNs in the latter case (e.g., Fabbiano 1989). With the two selection rules, we are left with 733 sources. The objects with X-ray flux in the 0.2-12 keV bandpass lower than are removed from the subsequent spectral modelings, which excludes the extracted X-ray spectra with low photon count rates.
There is a total of 362 2XMMi/SDSS-DR7 objects fulfilling the above selection criteria, after removing some duplications. Nine objects are at first removed from the subsequent spectral modeling because of the poor sky-line subtraction at the H region. In addition, the SDSS optical spectra show that: SDSS J122153.96+042742.5 is a H II region within NGC 4303; SDSS J121901.36+471524.9 (NGC 4258) is a typical starforming galaxy associated with a Wolf-Rayet bump at He II; SDSS J093249.57+472522.8 shows a spectrum typical of a CV star, and is incorrectly classified as a QSO by the SDSS pipelines. Among the remained 350 sources, there are 268 narrow emission-line galaxies (almost all the objects are classified as either transition galaxies or type II AGNs, see Section 3.2 below) and 82 type I AGNs, according to the classification done by the SDSS pipelines. The SDSS spectra of the type I AGNs are then inspected one by one by eyes. The inspection yields that 19 out of the 82 objects show a continuum that is dominated by the starlight from their host galaxies (hereafter partially obscured AGNs for short). The other 14 objects can be classified as Seyfert 1.5 galaxies in which the spectra are dominated by the featureless continuum from the AGNs and show evident narrow emission lines from AGNs. The rest are broad-line AGNs and narrow-line Seyfert 1 galaxies.
With these selection procedures, the sub-sample used in the subsequent spectral analysis therefore contains the 268 narrow emission-line galaxies, the 19 partially obscured AGNs and the 14 Seyfert 1.5 galaxies222The Seyfert 1.5 galaxies are useful in studying the relationship between the narrow emission-line ratios and their hard X-ray emission (see §3.3.2 for the details), because in these galaxies the narrow component of the Balmer lines can be accurately extracted from the observed line profile..
2.2 SDSS Optical Spectroscopy
The 1-Dimensional optical spectra listed in the sub-sample are analyzed by the IRAF333IRAF is distributed by National Optical Astronomy Observatory, which is operated by the Association of Universities for Research in Astronomy, Inc., under cooperative agreement with the National Science Foundation. package through the standard procedures as follows. For each of the spectra, the Galactic extinction is at first corrected by the color excess, the parameter taken from the Schlegel, Finkbeiner, and Davis Galactic reddening map (Schlegel et al. 1998), by assuming an extinction law of milky way (Cardelli et al. 1989). The spectrum is then transformed to the rest frame, along with the flux correction due to the relativity effect, given the redshift provided by the SDSS pipelines.
For the narrow emission-line galaxies and partially obscured AGNs, the stellar absorption features are subsequently separated from each rest-frame spectrum by modeling the continuum and absorption features by the sum of the first seven eigenspectra (see §4.4 for the discussion of the contamination from the scattered AGN’s continuum). The eigenspectra are built through the principal component analysis (PCA) method (e.g., Li et al. 2005; Hao et al. 2005; Wang & Wei 2008; Boroson & Lauer 2012; Francis et al. 1992) from the standard single stellar population spectral library developed by Bruzual & Charlot (2003). A Galactic extinction curve with is adopted in the modeling to account for the intrinsic extinction due to the host galaxy. A powerlaw continuum and an empirical Fe II template are additionally required to appropriately fit the underlying continuum in five objects. The powerlaw index is fixed to be the typical value of type I AGNs (i.e, , Vanden Berk et al. 2001 and references therein) in the fitting. The empirical Fe II template given by Boroson & Green (1992) is used in the continuum modeling, after the template is broadened to the FWHM of the H broad component by convolving with a Gaussian profile.
For the Seyfert 1.5 galaxies, we model the underlying continuum by a combination of a broken powerlaw and the Fe II template, because the continuum is dominated by the emission from central AGNs.
A minimization is performed for each of the spectra over the rest-frame wavelength range from 3700 to 8000Å, except for the regions with strong emission lines 444The wavelength regions used in the spectral modelings are 3700-3717, 3740-3860,3880-4335, 4345-4675,4690-4850,4870-4950, 5020-6290,6310-6540,6600-6710,6740-8000., they are H, H, H, [O III]4959, 5007, He II4686, [N II]6548, 6583, [S II]6716, 6731, [O III]4363, [O II]3727, [Ne III]3869, 3967, and [O I]6300.
After removing the continuum from each observed spectrum, the emission-line profiles are modeled by the SPECFIT task (Kriss 1994) in the IRAF package for both H and H regions, they are in the wavelength ranges: 6500-6750 and 4820-5050. Each line profile is modeled by a linear combination of a set of several Gaussian profiles. A broad H or H is required in the modelings if the observed profile can not be properly fitted by the narrow component alone. The intensity ratios of the [O III] and [N II] doublets are fixed to their theoretical values. The flux of the [O I]6300 emission line is measured through direct integration by the SPLOT task in the IRAF package.
2.3 XMM-Newton EPIC Spectra
Only the XMM-Newton EPIC PN (Struder et al. 2001) data are used in our X-ray spectral analysis. The data are reduced by the SAS v11.0 software555http://xmm,esac.esa.int/ and by the corresponding calibration files. For each of the objects listed in the sub-sample, the events corresponding to patterns 0-4 are selected from the PN data, and the CCD chip gaps are avoided. The bad and hot pixels are then removed from the original image. The source spectrum is extracted from a circular aperture at the detected source position. The aperture has a radius of 25-40″ depending on the brightness of the object. The background is obtained from a circular source-free region that is offset from but close to the source. The pile-up in the data is checked by the SAS task epatplot. The tasks rmfgen and arfgen are used to generate the needed response files.
There are 92 objects that have adequate photon count rates for the next spectral modelings. The extracted spectra are fitted by the XSPEC package (Arnaud 1996). The fittings are performed via a basic model666A powerlaw photon spectrum is defined as , where is the photon energy and is the photon index. expressed as over the 0.2-8 keV band for most of the objects, because of their relatively low photon count rates. The neutral reflection model (, Magdziarz & Zdziarski 1995) is required in four objects to reproduce the “bump” at the high energy end (e.g., Zycki et al. 1994). We add an additional Gaussian profile in eight sources to reproduce the narrow iron K emission lines at 6.4 keV (rest frame). SDSS J030349.10-010613.4 (NGC 1194) shows the most complex X-ray energy spectrum among the sub-sample. In the object, we add a component with keV to match better the emission below 2keV. In addition to the Fe K emission line, the spectrum shows the K emission lines from Si, S, and Ca that are superposed on a neutral reflection component (e.g., Greenhill & Tilak 2008). The spectral fitting of each object includes an absorption due to the Galactic column density at the line-of-sight. The value of density is taken from the Leiden/Argentine/Bonn (LAB) Survey (Kalberla et al. 2005). As an illustration, the best-fitting model is reproduced in Figure 1 for SDSS J151640.21+001501.8.
3 RESULTS AND ANALYSIS
In order to ensure the reliability of the inferred conclusions, only the objects whose uncertainties of the X-ray photon index are less than 0.3 are considered in the subsequent statistical analysis. Finally, there are 67 objects fulfilling the criterion (hereafter final sample for short). The results derived from the above spectral analysis are tabulated in Table 1 for the final sample. The identification of each object and the corresponding redshift are listed in Columns (1) and (2), respectively. Columns (3) to (6) tabulate the line ratios of [N II]/H, [S II]/H, [O I]/H, and [O III]/H in logarithm for each of the objects. The fitted spectral photon index in hard X-ray is listed in Column (8). All the quoted errors correspond to a 1 significance level. Columns (9) and (10) show the spectral fitting inferred intrinsic X-ray luminosity in the 2-10keV bandpass and the intrinsic [O III] line luminosity (), respectively. The line luminosity is corrected for the local extinction. The extinction is inferred from the narrow-line ratio H/H by assuming the Balmer decrement for standard case B recombination and the Galactic extinction curve with .
3.1 Stellar Population Age Measurements
The 4000Å break index (Bruzual 1983; Balogh et al. 1999) defined as
| (1) |
is widely used as an age indicator of the stellar population of the bulge of a galaxy (e.g., Heckman et al. 2004; Kauffmann et al. 2003c; Kauffmann & Heckman 2009; Kewley et al. 2006; Wang & Wei 2008, 2010; Wild et al. 2007, 2010). It is believed that is an excellent mean age indicator until a few Gyr after the onset of a star formation activity (e.g., Kauffmann et al. 2003c; Bruzual & Charlot 2003). We measured the index in the removed starlight spectra for all of the 268 narrow emission-line galaxies and the 19 partially obscured AGNs. The measured values are tabulated in Column (7) in Table 1 for the objects listed in the final sample. By using the same data reduction method described above, Wang et al. (2011) has estimated the typical uncertainty of for the measured from the duplicate SDSS observations.
3.2 BPT Diagnostic Diagram
Figure 2 displays the [N II]/H versus [O III]/H Baldwin-Phillips-Terlevich (BPT) diagnostic diagram for the final sample. The BPT diagram was originally proposed by Baldwin et al. (1981), and then refined by Veilleux & Osterbrock (1987). The diagram is commonly used to determine the dominant powering source in narrow emission-line galaxies through their emission-line ratios. AGNs are concentrated in the upper right corner of the BPT diagram because of their harder ionizing fields. We plot the narrow emission-line galaxies and the broad-line AGNs (i.e., the partially obscured AGNs and Seyfert 1.5 galaxies) in Figure 2 by the filled and open squares, respectively. The broad-line emission that is obtained through our profile modeling is excluded from the line ratio calculations. The solid line shows the empirical demarcation line that is proposed by Kauffmann et al. (2003) to separate ‘pure’ starforming galaxies according to the large sample provided by SDSS. Stasinska et al. (2006) proposed a theoretical demarcation line between ‘pure’ starforming galaxies and AGNs based on their photoionization models. The theoretical line is shown by the dashed line in Figure 2, which is close to and slightly restrictive than the empirical line drawn by Kauffmann et al. (2003). Stasinska et al. (2006) argued that the Kauffmann line includes the starforming galaxies that have an AGN contribution to H up to 3%. As shown by the diagram, all the objects listed in the final sample, except one, are located above both demarcation lines.
3.3 Statistical Analysis
3.3.1 X-ray Luminosity and Spectral Photon Index
The left and right panels in Figure 3 show the distributions of and for the final sample, respectively. The measured has an average (median) value of 1.87 (1.83). The values are highly consistent with the previous studies that indicate a typical index of for radio-quiet AGNs (e.g., Zdziarski et al. 1995; Reeves & Turner 2000; Piconcelli et al. 2005; Dadina 2008; Panessa et al. 2008; Zhou & Zhang 2010; Corral et al. 2011; Panessa et al. 2008; Mateos et al. 2010). The 2-10keV luminosity spans from to , which is typical for type II AGNs (e.g., Heckman et al. 2005; Panessa et al. 2006; Singh et al. 2011). The average and median values of are and , respectively. It is noted that the X-ray luminosities of most known X-ray luminous star-forming and elliptical galaxies are not higher than (e.g., Zezas et al. 2003; Lira et al. 2002a, 2002b; O’Sullivan et al. 2001).
3.3.2 Correlations
Figure 4 plots the tight correlation between and . An unweighted fitting yields a relationship with a 1 standard deviation of 0.63. The tight correlation between and plays an important role in estimating bolometric luminosities in type II AGNs (e.g., Heckman et al. 2004; Brinchmann et al. 2004; Kewley et al. 2006). The correlation was reported in previous studies by many authors (e.g., Heckman et al. 2005; Jin et al. 2012; LaMassa et al. 2011; Georgantopoulos & Akylas 2010), although Heckman et al. (2005) indicates that the correlation becomes much weaker for an optically selected Type II AGN sample. They argued that the weaker correlation is mainly due to the intrinsic photoelectric absorption in X-ray band. Recent studies, however, show an agreement of luminosity functions between the optically and X-ray-selected AGNs (e.g., Georgantopoulos & Akylas 2010; Trouille & Barger 2010). The insert panel in Figure 4 presents the distribution of the ratio. The distribution has a mean value of 1.4, and a dispersion of 0.63 dex. Again, one can see a consistency with the previous studies (see the citations quoted above).
The main results of this paper are shown in Figure 5 for the final sample, in which the fitted is plotted as a function of , [S II]/H and [O I]/H in the left, middle and right panels, respectively. Although the size of the current sample is smaller than that used in Wang & Wei (2010), much improved correlations (especially the versus correlation) can be clearly identified from the figure thanks to the better determination of photon index. The results of Spearman rank-order tests are summarized in Table 2. The calculated correlation coefficients and the corresponding probabilities of null correlation are listed in the first and second rows, respectively.
The new anti-correlation between and shows that the X-ray spectra of AGNs are a function of the age of stellar population of the host galaxies: older the stellar population, harder the central X-ray emission will be. The current study additionally reproduces the anti-correlations between the X-ray photon index and the two line ratios. Two similar correlations were identified in Wang & Wei (2010) by using the ROSAT hardness ratios. Wang & Wei (2010) argued that the correlations are consistent with the previous theoretical calculations and observational results. High energy observations show that dozens of LINERs with high [O I]/H ratios have hard, flat X-ray spectra (e.g., Flohic et al. 2006; Gliozzi et al. 2008; Rinn et al. 2005). In the theoretical ground, photoionization calculations indicate that a hard ionizing field with a powerlaw index can produce the strong [O I] line emission (i.e., , Kewley et al. 2006).
Figure 5 naturally implies that the two narrow emission-line ratios are related with the stellar population ages. In fact, Wang & Wei (2008, 2010) identified two tight correlations between and the two line ratios in both optically- and ROSAT X-ray-selected AGN samples. The two correlations are re-examined and confirmed here in the XMM-Newton selected sample. The two line ratios of [S II]/H and [O I]/H are plotted against in Figure 6 for the sub-sample. The filled circles mark the objects that are listed in the final sample. Strong correlations can be clearly identified for both samples from the figure. Spearman rank-order tests are performed to show the significance of the correlations. The estimated correlation coefficients are listed in Table 3. The value shown in the bracket for each entry is the probability of null correlation. By combining the relationship with , we argue that the two correlations are possibly driven by the change of AGN’s X-ray spectrum as a function of age of its host galaxy, although the “line-mixing” effect caused by star formation could not be entirely excluded.
4 DISCUSSION
The role of X-ray emission in the AGN-host coevolution issue is explored by our spectral analysis in both optical and X-ray bands of a sample selected from the 2XMMi/SDSS-DR7 catalog. With the much better determination of the X-ray spectral photon index, the analysis allows us to identify a strong anti-correlation between the photon index and stellar population age, which was missed in our previous study. The correlation indicates that the X-ray emission from the central SMBH accretion activity plays an important role in the AGN-host coevolution issue, in which the hardness of X-ray spectrum increases with the host galaxy stellar population age.
4.1 X-ray Emission in AGNs
Because the hard X-ray emission is believed to be produced in the inner region of an AGN, the photon index in hard X-ray is therefore important in studying the accretion process and emission mechanism in AGNs. The hard X-ray spectra of radio-quiet Seyfert galaxies are dominated by a powerlaw component with a mean photon index of (Mushotzky et al. 1980; Nandra et al. 1990; Page et al. 2005; Shemmer et al. 2005; Vignali et al. 2005; Just et al. 2007), which is traditionally explained by the comptonization of the seed UV/soft-X-ray photons from the accretion disk by the energetic electrons in hot plasma cloud (e.g., Haardt & Maraschi 1991; Zdziarski et al. 2000; Kawaguchi et al. 2001). Previous studies frequently indicate that the properties of X-ray emission is strongly related with the ones derived from optical spectroscopic observations. There is a strong anti-correlation between and FWHM of AGN’s broad H emission line (e.g., Brandt et al. 1997; Leighly 1999; Reeves & Turner 2000; Shemmer et al. 2006, 2008; Zhou & Zhang 2010; Jin et al. 2012). Direct correlation analysis and PCA analysis indicate that the fundamental Eigenvector-I (EI) space is strongly correlated with the soft X-ray spectral index (e.g., Wang et al. 1996; Laor et al. 1997; Vaughan et al. 1999; Grupe 2004; Xu et al. 2003; Boroson & Green 1992 and see Sulentic et al. 2000 for a review). Briefly, the larger the photon index, the stronger the Fe II blends and [O III] line emission will be.
It is now commonly believed that the EI space is physically driven by , where (e.g., Boroson 2002). Thanks to the great progress made in the reverberation mapping technique, empirical relationships have been well established in past decades to estimate the viral blackhole mass in a type I AGN from single epoch optical spectroscopic observation (see a recent review in Marziani & Sulentic 2012 and references therein). The calibrations allow various authors to identify a correlation between and in radio-quiet type I AGNs (e.g., Grupe 2004; Desroches et al. 2009; Gierlinski & Done 2004; Lu & Yu 1999; Porquet et al. 2004; Wang et al. 2004; Bian 2005, Shemmer et al. 2006, 2008; Risaliti et al. 2009; Jin et al. 2012; Zhou & Zhao 2010), although non-monotonic trends are suggested by Kelly et al. (2008) and Gu & Cao (2009) when low-luminosity AGNs are included. The correlation implies that the accretion rate is related to the physical conditions in the hot corona producing the hard X-ray emission. Pounds et al. (1995) points out that a high state tends to produce a steep soft X-ray spectrum. A commonly accepted explanation for the correlation is that: the corona cools more efficiently due to the inverse Compton scattering when the disk flux irradiating the corona increases. The enhanced cooling then results in a soft, steep X-ray spectrum at high state. Cao (2009) recently suggests that the correlation could be explained by the disk-corona model in which the corona is heated by magnetic field reconnections.
4.2 Co-evolution of AGNs and Their Host Galaxies
The main results obtained in this paper indicate that the physical process occurring in the central SMBH accretion activity correlates with the host galaxy stellar population: the strength of Compton cooling in the corona around the SMBH+disk system decreases with the mean age of stellar population of the host galaxy. Taking into account of the strong correlation between and , the relationship is likely to be related to the correlation between and the host galaxy.
Wang et al. (2006) extended the EI space into middle-far-infrared colors by performing a PCA analysis on a sample of IRAS-selected Seyfert 1.5 galaxies. Because the color addresses the relative importance of AGN activity and starburst activity, the extension therefore suggests an evolutionary role of the EI space, which naturally implies an evolution of the photon index with the host galaxy stellar population. The evolutionary role of has been frequently suggested in observational ground in past a few years. A direct correlation between and stellar population age of host galaxy is established by different approaches: using as a proxy of in type II AGNs (e.g., Kewley et al. 2006; Wild et al. 2007777In subsequent work, Wild et al. (2010) show that the accretion rate versus stellar population age correlation does not hold follwing a starburst.; Kauffmann et al. 2007) and estimating directly from the Balmer broad lines in partially obscured AGNs (Wang et al. 2008, 2010). In addition to the stellar population age, is found to be related with the ongoing SFR, when the SFR is assessed by the near-infrared polycyclic aromatic hydrocarbon (PAH) emission (e.g., Watabe et al. 2008; Woo et al. 2012; Imanishi & Wada 2004). Chen et al. (2009) identified a tight correlation between and the specific SFR in Seyfert 2 galaxies. The authors argue that supernova explosions might play a key role in the fueling of gas to central SMBH (see also in the numerical simulation studies, e.g. Wada et al. 2009; Schartmann et al. 2010).
As a subclass of AGNs, narrow-line Seyfert 1 galaxies (NLS1s)888NLS1s are commonly defined as the AGNs with narrow Balmer broad emission lines, weak [O III] lines and strong Fe II complex, i.e., , [O III]/H, and Fe II/, see Komossa (2008) for a recent review. are statistically clustered at one extreme end of the AGN’s correlation space (e.g., Boroson & Green 1992; Zamfir et al. 2008; Grupe 2004). These galaxies are believed to have less massive SMBH and higher than do broad-line Seyfert 1 galaxies (BLS1s, e.g., Boroson 2002; Collin & Kawaguchi 2004). Steeper X-ray spectra are on average found in NLS1s than in BLS1s (e.g., Laor et al. 1994; Boller et al. 1996; Wang et al. 1996; Zhou & Zhang 2010; Puchnarewicz et al. 1992; Grupe 1996, 2004; Boller et al. 1996; Brandt et al. 1997; Leighly 1999; Comastri 2000; Vaughan et al. 2001; Zhou et al. 2006), although relatively flat X-ray energy spectra are identified in a very small fraction of NLS1s (e.g., Zhou et al. 2006; Williams et al. 2004). NLS1s are expected to be “young” AGNs at early evolutionary stage associated with intense circumnuclear star formation and with young stellar populations (see also in Mathur 2000 for other arguments). In fact, Sani et al. (2010) recently revealed an enhanced star formation activity in NLS1s from the Spitzer spectroscopy as compared with BLS1s with the same AGN luminosity. The morphological study indicates a higher fraction of nuclear star-formation rings for NLS1s than for BLS1s (Deo et al. 2006). Based on the SDSS survey, Mao et al. (2009) found three particular broad-line AGNs whose narrow emission lines are identified to be ionized by hot stars rather than AGNs. The three objects all show NLS1-like broad emission lines. Castello-Mor et al. (2012) recently argued that a NLS1-core can be identified in a large fraction of X-ray luminous starforming galaxies.
As an additional test for the driver of the aforementioned correlations, we estimate for the final sample by using the parameter as a proxy (e.g., Kauffmann & Heckman 2006), where and are the [O III] line luminosity and the bulge velocity dispersion, respectively. The Seyfert 1.5 galaxies are excluded from the estimation because of the non-available starlight component in their optical spectra. The bolometric luminosity is transformed from through the bolometric correction (Heckman et al. 2004). The [O III] contribution from star formation is not corrected both because of the tight correlation between and and because a majority of the final sample is located far from the demarcation lines shown in the BPT diagram (Figure 2). The viral blackhole mass is estimated from the relationship: (Tremaine et al. 2002), by 1) assuming each galaxy listed in the final sample has a bulge, and 2) using the velocity dispersion that is measured for each object in the PCA fittings through the cross-correlation method as a proxy of the value of the bulge. In order to obtain the intrinsic velocity dispersion, the instrumental resolution is corrected through the equation by assuming a pure Gaussian profile. The galaxies with (corresponding ) are removed from the following analysis because the SDSS instrumental resolution is .
The left panel in Figure 7 reproduces the previously reported anti-correlation between and the index (e.g., Kewley et al. 2006; Wild et al. 2007; Kauffmann et al. 2007). Because the sample size is less than 30, the Kendall’s generalized is calculated to quantify the significance of the correlation. The test returns a Kendall’s (), and a probability of , where is the probability that there is no correlation between the two variables. is plotted against in the right panel in Figure 7. It is unfortunately that the same statistical test returns a non-correlation between the two variables ( and ). The negative result might be caused by the following two facts: the small sample size and the large scatter when is used as a proxy of (e.g, Kauffmann et al. 2003).
4.3 Contamination in Hard, Flat X-ray Spectra
In addition to the intrinsically low accretion rate, the hard, flat X-ray spectra could be resulted from the other reasons. Observations show that “normal” galaxies are X-ray emitters with a typical X-ray luminosity of (e,g, Fabbiano 1989; Georgakakis et al. 2008; Brandt et al. 2001). The X-ray emission in the “normal galaxies” is dominantly emitted from the diffuse hot gas (K) and evolved stellar point sources with K (e.g, Fabbiano & Shaply 2002; Read & Ponman 2002, and see a review in Fabbiano 2006). In principle, the X-ray spectra extracted by us contain the emission from not only the AGNs, but also the host galaxies, both because of the used large aperture and because of the poor spatial resolution. In order to examine the contamination caused by the host galaxies, is plotted against the luminosity ratio between AGNs and their host galaxies in the left panel of Figure 8 by using the [O III] line luminosity as a proxy of the bolometric luminosity of AGNs. The absolute magnitudes of the host galaxies are taken from the catalog provided in Simard et al. (2011) who performed two-dimensional bulge+disk decompositions for a sample of SDSS-DR7 galaxies999It is noted that the contamination in the absolute magnitude caused by central ANGs is ignorable because our sample is dominated by type II AGNs in which the central AGN’s continuum is heavily obscured by the torus due to the orientation effect. The total light from the host galaxies is adopted because the largest host galaxy half-light radius in our sample is , which is much smaller than the smallest aperture () used in our X-ray spectral reduction.. The measurements in the and bands are presented by the blue-solid and red-open points, respectively. Two positive correlations are expected if there is strong contamination from the host galaxies. Spearman rank-order tests, however, return two marginal anti-correlations: for the band, and for the band. These statistical results indicate that the hard, flat X-ray spectra are not caused by the contamination from the host galaxy X-ray emission.
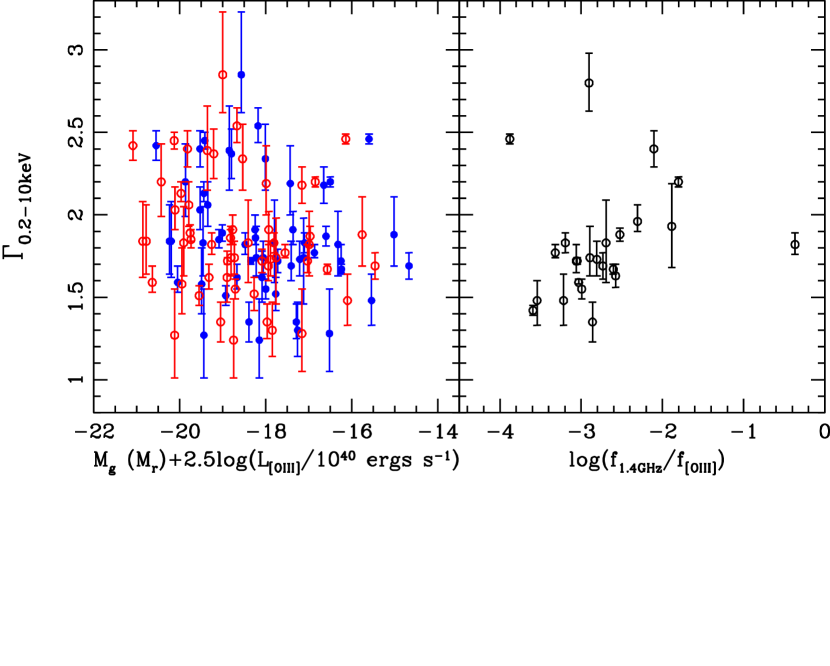
The hard, flat X-ray spectra could be alternatively caused by the strong Doppler-boosted emission from the relativistic jets. The average X-ray photon index of radio-loud QSOs is about 1.6 (e.g., Reeves & Turner 2000). By cross-matching the final sample with the FIRST survey catalog (Becker et al. 2003), is plotted against the flux ratio in the right panel of Figure 8 to examine the jet beaming contamination, where and are the [O III] line flux and radio flux at 1.4GHz, respectively. The figure shows a positive correlation between the two variables (with a Kendall’s and ). Briefly, the stronger the radio emission, the softer and steeper the X-ray spectrum will be. The correlation is, however, contrary to the expectation that is inferred from the jet beaming hypothesis. The contrary hence suggests that the correlations involving is not driven by the contamination from the jet emission.
4.4 Contamination From Scattered AGN Continuum
One problem in stellar population synthesis of strong type II AGNs is how to assess the underlying scattered continuum from central engine (e.g., Cid Fernandes & Terlevich 1995; Storchi-Bergmann et al. 2000; Cid Fernandes et al. 2004), which is implied by the commonly accepted Unified Model (e.g., Antonucci 1993). The scattered continuum can contaminate measurement by impacting the spectral shape at the blue end. Basically, an underestimated is expected if the contamination is ignored. The difficulty in separating the underlying continuum from observed spectrum mainly comes from the strong degeneracy between the continuum and the spectra of young O and B stars (e.g., Cid Fernandes et al. 2004; Hao et al. 2005).
To address the contamination issue, we formally re-model the continuum of the objects by a linear combination of the used eigenspectra and a powerlaw continuum with different index. Again, it is emphasized that one needs to bear in mind the degeneracy between AGN’s continuum and blue spectra of massive stars, which could result in an overestimated of the amplitude of the powerlaw (e.g., Cid Fernands et al. 2004), and the same of the inferred . In Figure 9, the measured values of in which the contribution from AGN’s continuum is formally corrected are compared with that shown in Table 1. The powerlaw index varies from 1.5 to 1.9.
5 SUMMARY
The evolutionary role of hard X-ray emission is examined by performing X-ray and optical spectral analysis on 67 (partially) obscured AGNs selected from the XMM-Newton 2XMMi/SDSS-DR7 catalog. With much better determined X-ray photon index, is found to correlate with the stellar population, which is likely related to the evolution of . The better determination also allows us to identify two improved correlations between and the narrow-line ratios (i.e., [O I]/H and [S II]/H). Finally, the current sample confirms the two previously established tight correlations between the two line ratios and .
References
- Abazajian et al. (2009) Abazajian, K. N., Adelman-McCarthy, J. K., Agueros, M. A., et al. 2009, ApJS, 182, 543
- Alonso-Herrero et al. (2008) Alonso-Herrero, A., Perez-Gonzalez, P. G., Rieke, G. H., Alexander, D. M., Rigby, J. R., Papovich, C., Donley, J. L., & Rigopoulou, D. 2008, ApJ, 677, 127
- Antonucci (1993) Antonucci, R. R. J. 1993, ARA&A, 31, 473
- Aird et al. (2010) Aird, J., et al. 2010, MNRAS, 401, 2531
- Arnaud (1996) Arnaud, K. A. 1996, in ASP Conf. Ser. 101, Astronomical Data Analysis Software and Systems V, ed. G. H. Jacoby and J. Barnes, (San Francisco, CA: ASP), 17
- Assef et al. (2011) Assef, R. J., et al. 2011, ApJ, 728, 56
- Balogh et al. (1999) Balogh, M. L., et al. 1999, ApJ, 527, 54
- Baldwin et al. (1981) Baldwin, J. A., Phillips, M. M., & Terlevich, R. 1981, PASP, 93, 5
- Becker et al. (2003) Becker, R. H., Helfand, D. J., White, R. L., Gregg, M. D., & Laurent-Muehleisen, S. A. 2003, VizieR Online Data Catalog, 8071, 0
- Bian (2005) Bian, W. H., 2005, Chinese J. Astron. Astrophys., 5, 289
- Boller et al. (1996) Boller, T., Brandt, W. N., & Fink, H. 1996, A&A, 305, 53
- Bongiorno et al. (2007) Bongiorno, A., et al. 2007, A&A, 472, 443
- Boroson (2002) Boroson, T. A. 2002, ApJ, 565, 78
- Boroson & Green (1992) Boroson, T. A., & Green, R. F. 1992, ApJS, 80, 109
- Brandt et al. (1997) Brandt, W. N., Mathur, S., Reynolds, C. S., & Elvis, M. 1997, MNRAS, 292, 407
- Brandt et al. (2001) Brandt, W. N., et al. 2001, AJ, 122, 2810
- Bromley et al. (1998) Bromley, B. C., Press, W. H., Lin, H., & Kirshner, R. P. 1998, ApJ, 505, 25
- Brinchmann et al. (2004) Brinchmann, J., Charlot, S., White, S. D. M., Tremonti, C., Kauffmann, G., Heckman, T., & Brinkmann, J. 2004, MNRAS, 351, 1151
- Bruzual (1983) Bruzual, A. G. 1983, ApJ, 273, 105
- Bruzual & Charlot (2003) Bruzual, G., & Charlot, S. 2003, MNRAS, 344, 100
- Caccianiga et al. (2008) Caccianiga, A. et al. 2008, A&A, 477, 735
- Cao (2009) Cao, X. 2009, MNRAS, 394, 207
- Cardelli et al. (1989) Cardelli, J. A., Clayton, G. C., & Mathis, J. S. 1989, ApJ, 345, 245
- Castello-Mor et al. (2012) Castello-Mor, N., Barcons, X., Ballo, L., Carrera, F. J., Ward, M. J., & Jin, C. 2012, A&A, 544, 48
- Chen et al. (2009) Chen, Y.M., Wang, J. M., Yan, C. S., Hu, C., & Zhang, S. 2009, ApJ, 695, 130
- Cid Fernandes & Terlevich (1995) Cid Fernandes, R. Jr., & Terlevich, R. 1995, MNRAS, 272, 423
- Cid Fernandes et al. (2004) Cid Fernandes, R., Gu, Q., Melnick, J., Terlevich, E., Terlevich, R., Kunth, D., Rodrigues Lacerda, R., & Joguet, B. 2004, MNRAS, 355, 273
- Collin & Kawaguchi (2004) Collin, S., & Kawaguchi, T. 2004, A&A, 426, 797
- Comastri (2000) Comastri, A. 2000, New A Rev., 44, 403
- Corral et al. (2011) Corral, A., Della Ceca, R., Caccianiga, A., Severgnini, P., Brunner, H., Carrera, F. J., Page, M. J., & Schwope, A. D. 2011, A&A, 530, 42
- Cowie et al. (2003) Cowie, L. L., Barger, A. J., Bautz, M. W., Brandt, W. N., & Garmire, G. P. 2003, ApJ, 584, 57
- Croom et al. (2004) Croom, S. M., Smith, R. J., Boyle, B. J., Shanks, T., Miller, L., Outram, P. J., & Loaring, N. S. 2004, MNRAS, 349, 1379
- Dadina (2008) Dadina, M. 2008, A&A, 485, 417
- Davis et al. (2007) Davies, R., Mueller Sanchez, F., Genzel, R., et al. 2007, ApJ, 671, 1388
- Deo et al. (2006) Deo, R. P., Crenshaw, D. M., & Kraemer, S. B. 2006, AJ, 132, 321
- Desroches et al. (2009) Desroches, L., Greene, J. E., & Ho, L. C. 2009, ApJ, 698, 1515
- Fabbiano (1989) Fabbiano, G. 1989, ARA&A, 27, 87
- Fabbiano (2006) Fabbiano, G. 2006, ARA&A, 44, 323
- Fabbiano & Shaply (2002) Fabbiano, G., & Shapley, A. 2002, ApJ, 565, 908
- Ferrarese & Ford (2005) Ferrarese, L., & Ford, H. 2005, Space Sci. Rev., 116, 523
- Ferrarese & Merritt (2000) Ferrarese, L., & Merritt, D. 2000, ApJ, 539, 9
- Flohic et al. (2006) Flohic, H. M. L. G., Eracleous, M., Chartas, G., Shields, J. C., & Moran, E. C. 2006, ApJ, 647, 140
- Francis et al. (1992) Francis, P. J., Hewett, P. C., Foltz, C. B., & Chaffee, F. H. 1992, ApJ, 398, 476
- (44) Gebhardt, K. et al. 2000a, ApJ, 539, 13
- (45) Gebhardt, K. et al. 2000b, ApJ, 543, 5
- Georgakakis (2008) Georgakakis, A. 2008, AN, 329, 174
- Georgantopoulos & Akylas (2010) Georgantopoulos, I., & Akylas, A. 2010, A&A, 509, 38
- Gierlinski & Done (2004) Gierlinski, M., & Done, C. 2004, MNRAS, 349, L7
- Glazebrook et al. (1998) Glazebrook, K., Offer, A. R., & Deeley, K. 1998, ApJ, 492, 98
- Gliozzi et al. (2008) Gliozzi, M., Foschini, L., Sambruna, R. M., & Tavecchio, F. 2008, A&A, 478, 723
- Goulding et al. (2010) Goulding, A. D., Alexander, D. M., Lehmer, B. D., & Mullaney, J. R. 2010, MNRAS, 406, 597
- Greene & Ho (2006) Greene, J. E., & Ho, L. C. 2006, ApJ, 641, 21
- Greene et al. (2008) Greene, J. E., Ho, L. C., & Barth, A. J. 2008, ApJ, 688, 159
- Grupe (1996) Grupe D. 1996, PhD thesis, Univ. Gottingen
- Greenhill et al. (2008) Greenhill, L. J., Tilak, A., & Madejski, G. 2008, ApJ, 686, 13
- Grupe (2004) Grupe, D. 2004, AJ, 127, 1799
- Gu & Cao (2009) Gu, M., & Cao, X. 2009, MNRAS, 399, 349
- Gultekin et al. (2009) Gultekin, K., et al. 2009, ApJ, 698, 198
- Haardt & Maraschi (1991) Haardt, F., & Maraschi, L. 1991, ApJ, 380, 51
- Hao et al. (2005) Hao, L., et al. 2005, AJ, 129, 1795
- Haring & Rix (2004) Haring, N., & Rix, H. W. 2004, ApJ, 604, 89
- Hasinger et al. (2005) Hasinger, G., Miyaji, T., & Schmidt, M. 2005, A&A, 441, 417
- Heckman & Kauffman (2006) Heckman, T. M., & Kauffmann, G. 2006, New A Rev., 50, 677
- Heckman et al. (2004) Heckman, T. M., Kauffmann, G., Brinchmann, J., et al. 2004. ApJ, 613, 109
- Heckman et al. (2005) Heckman, T. M., Ptak, A., Hornschemeier, A., & Kauffmann, G. 2005, ApJ, 634, 161
- Hopkins et al. (2005) Hopkins, P. F., Hernquist, L., Martini, P., et al. 2005, ApJ, 625, 71
- Imanishi & Wada (2004) Imanishi, M., & Wada, K. 2004, ApJ, 617, 241
- Jansen et al. (1999) Jansen, F., et al. 2001, A&A, 365, L1
- Jin et al. (2012) Jin, C., Ward, M., & Done, C. 2012, MNRAS, 425, 907
- Just et al. (2007) Just, D. W., Brandt, W. N., Shemmer, O., Steffen, A. T., Schneider, D. P., Chartas, G., & Garmire, G. P. 2007, ApJ, 665, 1004
- Kalberla et al. (2005) Kalberla, P. M. W., Burton, W. B., Hartmann, D., Arnal, E. M., Bajaja, E., Morras, R., & Poppel, W. G. L. 2005, A&A, 440, 775
- Kauffmann & Heckman (2009) Kauffmann, G., & Heckman, T. M. 2009, MNRAS, 397, 135
- Kauffmann et al. (2003) Kauffmann, G., Heckman, T. M., White, S. D. M., et al. 2003, MNRAS, 341, 33
- Kauffmann et al. (2007) Kauffmann, G., et al. 2007, ApJS, 173, 357
- Kawaguchi et al. (2001) Kawaguchi, T., Shimura, T., & Mineshige, S. 2001, ApJ, 546, 966
- Kelly et al. (2008) Kelly, B. C., Bechtold, J., Trump, J. R., Vestergaard, M., & Siemiginowska, A. 2008, ApJS, 176, 355
- Kewley et al. (2006) Kewley, L. J., Groves, B., Kauffmann, G., & Heckman, T. 2006, MNRAS, 372, 961
- Komossa (2008) Komossa, S. 2008, RevMexAA Conf. Ser., 32, 86
- Kriss (1994) Kriss, G. 1994, Adass, 3, 43
- LaMassa et al. (2011) LaMassa, S. M., Heckman, T. M., Ptak, A., Martins, L., Wild, V., Sonnentrucker, P., & Hornschemeier, A. 2011, ApJ, 729, 52
- Laor et al. (1994) Laor, A., Fiore, F., Elvis, M., Wilkes, B. J., & McDowell, J. C. 1994, ApJ, 435, 611
- Laor et al. (1997) Laor, A., Fiore, F., Elvis, M., Wilkes, B. J., & McDowell, J. C. 1997, ApJ, 477, 93
- Leighly (1999) Leighly, K. M. 1999, ApJS, 125, 317
- Li et al. (2008) Li, C., Kauffmann, G., Heckman, T., M., White, S. D. M., & Jing, Y. P. 2008, MNRAS, 385, 1915
- Li et al. (2005) Li, C., Wang, T. G., Zhou, H. Y., Dong, X, B., & Cheng, F, Z. 2005, AJ, 129, 669
- (86) Lira, P., Ward, M., Zezas, A., Alonso-Herrero, A., & Ueno, S. 2002a, MNRAS, 330, 259
- (87) Lira, P., Ward, M., Zezas, A., & Murray, S. S. 2002b, MNRAS, 333, 709
- Lu & Yu (1999) Lu, Y. J. & Yu, Q. J. 1999, ApJ, 526, 5
- Magdziarz & Zdziarski (1995) Magdziarz, P., & Zdziarski, A. A. 1995, MNRAS, 273, 837
- Magorrian et al. (1998) Magorrian, J., et al. 1998, AJ, 115, 2285
- Mao et al. (2009) Mao, Y. F., Wang, J., & Wei, J. Y. 2009, ApJ, 698, 859
- Marziani & Sulentic (2012) Marziani, P., & Sulentic, J. W. 2012, New Astronomy Review, 56, 49
- Mateos et al. (2010) Mateos, S., et al. 2010, A&A, 510, 35
- Mathur (2000) Mathur, S. 2000, MNRAS, 314, L17
- McLure & Dunlop (2002) McLure, R. J., & Dunlop, J. S. 2002, MNRAS, 331, 795
- McLure & Dunlop (2004) McLure, R. J., & Dunlop, J. S. 2004, MNRAS, 352, 1390
- Merritt & Ferrarese (2001) Merritt, D., & Ferrarese, L. 2001, MNRAS, 320, L30
- Mushotzky et al. (1980) Mushotzky, R. F., Marshall, F. E., Boldt, E. A., Holt, S. S., & Serlemitsos, P. J. 1980, ApJ, 235, 377
- Nandra et al. (2005) Nandra, K., Laird, E. S., & Steidel, C. C. 2005, MNRAS, 360, L39
- Nandra et al. (1990) Nandra, K., Pounds, K. A., & Stewart, G. C. 1990, MNRAS, 242, 660
- Nandra et al. (2007) Nandra, K., et al. 2007, ApJ, 660, 11
- O’Sullivan et al. (2001) O’Sullivan, E., Forbes, D. A., & Ponman, T. J. 2001, MNRAS, 342, 420
- Page et al. (2005) Page, K. L., Reeves, J. N., O’Brien, P. T., & Turner, M. J. L. 2005, MNRAS, 364, 195
- Panessa et al. (2006) Panessa, F., et al. 2006, A&A, 455, 173
- Panessa et al. (2008) Panessa, F., et al. 2008, A&A, 483, 151
- Piconcelli et al. (2005) Piconcelli, E., Jimenez-Bailon, E., Guainazzi, M., Schartel, N., Rodriguez-Pascual, P. M., & Santos-Lleo, M. 2005, A&A, 432, 15
- Pineau et al. (2011) Pineau, F.-X., Motch, C., Carrera, F., Della Ceca, R., Derriere, S., Michel, L., Schwope, A., & Watson, M. G. 2011, A&A, 527, 126
- Porquet et al. (2004) Porquet, D., Reeves, J. N., O’Brien, P., & Brinkmann, W. 2004, A&A, 422, 85
- Pounds et al. (1995) Pounds, K. A., Done, C., & Osborne, J. P. 1995, MNRAS, 277, L5
- Puchnarewicz et al. (1992) Puchnarewicz, E. M., et al. 1992, MNRAS, 256, 589
- Read & Ponman (2001) Read, A. M., & Ponman, T. J. 2001, MNRAS, 328, 127
- Reeves & Turner (2000) Reeves, J. N., & Turner, M. J. L. 2000, MNRAS, 316, 243
- Reichard et al. (2008) Reichard, T. A., Heckman, T. M., Rudnick, G., Brinchmann, J., & Kauffmann, G. 2008, ApJ, 677, 186
- Rinn et al. (2005) Rinn, A. S., Sambruna, R. M., & Gliozzi, M. 2005, ApJ, 621, 167
- Risaliti et al. (2009) Risaliti, G., Young, M., & Elvis, M. 2009, ApJ, 700, 6
- Sanchez et al. (2004) Sanchez, S. F., et al. 2004, ApJ, 641, 586
- Sani et al. (2010) Sani, E., Lutz, D., Risaliti, G., Netzer, H., Gallo, L. C., Trakhtenbrot, B., Sturm, E., & Boller, T. 2010, MNRAS, 403, 1246
- Schartmann et al. (2010) Schartmann, M., Burkert, A., Krause, M., Camenzind, M., Meisenheimer, K., & Davies, R. I. 2010,MNRAS, 403, 1801
- Schawinski et al. (2007) Schawinski, K., Thomas, D., Sarzi, M., Maraston, C., Kaviraj, S., Joo, S., Yi, S. K., & Silk, J. 2007, MNRAS, 382, 1415
- Schawinski et al. (2009) Schawinski, K., Virani, S., Simmons, B., Urry, C. M., Treister, E., Kaviraj, S., & Kushkuley, B. 2009, ApJ, 692, 19
- Shankar et al. (2009) Shankar, F., Bernardi, M., & Haiman, Z. 2009, ApJS, 694, 867
- Shemmer et al. (2006) Shemmer, O., Brandt, W. N., Netzer, H., Maiolino, R., & Kaspi, S. 2006, ApJ, 646, 29
- Shemmer et al. (2005) Shemmer, O., Brandt, W. N., Vignali, C., Schneider, D. P., Fan, X., Richards, G. T., & Strauss, M. A. 2005, ApJ, 630, 729
- Shemmer et al. (2008) Shemmer, O., et al. 2008, ApJ, 682, 81
- Schlegel et al. (1998) Schlegel, D., Finkbeiner, D. P., & Davis, M. 1998, ApJ, 500, 525
- Silverman, et al. (2008) Silverman, J. D., et al. 2008, ApJS, 679, 118
- Simard et al. (2011) Simard, L., Mendel, J. T., Patton, D. R., Ellison, S., L., & McConnachie, A. W. 2011, ApJS, 196, 11
- Singh et al. (2011) Singh, V., Shastri1, P., & Risaliti, G. 2011, A&A, 532, 84
- Spergel et al. (2003) Spergel, D. N., et al. 2003, ApJS, 148, 175
- Storchi-Bergmann et al. (2000) Storchi-Bergmann, T., Raimann, D., Bica, E. L. D., & Fraquelli, H. A. 2000, ApJ, 544, 747
- Struder et al. (2001) Struder, L., et al. 2001, A&A, 365, L18
- Sulentic et al. (2000) Sulentic, J. W., Marziani, P., & Dultzin-Hacyan, D. 2000, ARA&A, 38, 521
- Tremaine et al. (2002) Tremaine, S., Gebhardt, K., Bender, R., et al. 2002, ApJ, 574, 740
- Treister et al. (2009) Treister, E., et al. 2009,ApJ, 706, 535
- Trouille & Barger (2010) Trouille, L., & Barger, A. J. 2010, ApJ, 722, 212
- Ueda et al. (2003) Ueda, Y., Akiyama, M., Ohta, K., & Miyaji, T. 2003, ApJ, 598, 886
- Vanden Berk et al. (2001) Vanden Berk, D. E., et al. 2001, AJ, 122, 594
- Vaughan et al. (1999) Vaughan, S., Reeves, J., Warwick, R., & Edelson, R. 1999, MNRAS, 309, 113
- Veilleux & Osterbrock (1987) Veilleux, S., & Osterbrock, D. E. 1987, ApJS, 63, 295
- Vignali et al. (2005) Vignali, C., Brandt, W. N., Schneider, D. P., & Kaspi, S. 2005, AJ, 129, 2519
- Wada et al. (2009) Wada, K., Papadopoulos, P. P., & Spaans, M. 2009, ApJ, 702, 63
- Wang & Wei (2006) Wang, J., & Wei, J. Y. 2006, ApJ, 648, 158
- Wang & Wei (2008) Wang, J., & Wei, J. Y. 2008, ApJ, 679, 86
- Wang & Wei (2010) Wang, J., & Wei, J. Y. 2010, ApJ, 719, 1157
- Wang et al. (2006) Wang, J., Wei, J. Y., & He, X. T. 2006, ApJ, 638, 106
- Wang et al. (2004) Wang, J. M., Watarai, K. Y., & Mineshige, S. 2004, ApJ, 607, 107
- Wang et al. (1996) Wang, T., Brinkmann, W., & Bergeron, J. 1996, A&A, 309, 81
- Watabe et al. (2008) Watabe, Y., Kawakatu, N., & Imanishi, M. 2008, ApJ, 677, 895
- Watson et al. (2009) Watson, M. G., et al. 2009, A&A, 493, 339
- Wild et al. (2010) Wild, V., Heckman, T. M., & Charlot, S. 2010, MNRAS, 405, 933
- Wild et al. (2007) Wild, V., Kauffmann, G., Heckman, T., et al. 2007, MNRAS, 381, 543
- Williams et al. (2004) Williams, R. J., Mathur, S., & Pogge, R. W. 2004, ApJ, 610, 737
- Woo & Urry (2002) Woo, J. H., & Urry, C. M. 2002, ApJ, 579, 530
- Woo et al. (2012) Woo, J. H., Kim, J. H., Imanishi, M., & Park, D. 2012, AJ, 143,49
- Woo et al. (2010) Woo, J. H., et al. 2010, ApJ, 716, 269
- Worthey & Ottaviani (1997) Worthey, G., & Ottaviani, D. L. 1997, ApJS, 111, 377
- Xu et al. (2003) Xu, D. W., Komossa, S., Wei, J. Y., Qian, Y., & Zheng, X. Z. 2003, ApJ, 590, 73
- Zamfir et al. (2008) Zamfir, S., Sulentic, J. W., & Marziani, P. 2008, MNRAS, 387, 865
- Zdziarski et al. (1995) Zdziarski, A. A., Johnson, W. N., Done, C., Smith, D., & McNaron-Brown, K. 1995, ApJ, 438, 63
- Zdziarski et al. (2000) Zdziarski, A. A., Poutanen, J., & Johnson, W. N. 2000, ApJ, 542, 703
- Zezas et al. (2003) Zezas, A., Ward, M. J., & Murray, S. S. 2003, ApJ, 594, 31
- Zhou et al. (2005) Zhou, H. Y., Wang, T. G., Dong, X. B., Wang, J., & Lu, H. 2005, Mem. Soc. Astron. Italiana, 76, 93
- Zhou et al. (2006) Zhou, H. Y., Wang, T. G., Yuan, W. M., Lu, H. L., Dong, X. B., Wang, J. X., & Lu, Y. J. 2006, ApJS, 166, 128
- Zhou & Zhang (2010) Zhou, X. L., & Zhang, S. N. 2010, ApJ, 713, 11
- Zhou & Zhao (2010) Zhou, X. L., & Zhao, Y. H. 2010, ApJ, 720, 206
- Zycki et al. (1994) Zycki, P. T., Krolik, J. H., Zdziarski, A A., & Kallman, T. R. 1994, ApJ, 437, 597


| SDSS Name | |||||||||
|---|---|---|---|---|---|---|---|---|---|
| (1) | (2) | (3) | (4) | (5) | (6) | (7) | (8) | (9) | (10) |
| J000441.24+000711.2 | 0.108 | -0.069 | -0.255 | -1.143 | 0.608 | 1.55 | 42.8 | 40.6 | |
| J004311.60093816.0 | 0.054 | -0.145 | -0.422 | 0.052 | 1.41 | 42.3 | 40.5 | ||
| J020029.06+002846.6 | 0.174 | 0.100 | -0.094 | 0.658 | 1.29 | 42.8 | 41.0 | ||
| J024912.86081525.7 | 0.029 | -0.314 | -0.343 | -1.056 | 1.244 | 1.45 | 41.7 | 40.8 | |
| J032525.35060837.9 | 0.034 | -0.058 | -0.323 | -0.842 | 0.836 | 1.18 | 42.5 | 41.9 | |
| J082433.33+380013.1 | 0.103 | -0.521 | -0.617 | -1.772 | -0.178 | 1.14 | 42.2 | 41.0 | |
| J082510.23+375919.6 | 0.021 | 0.128 | -0.061 | -0.724 | 1.285 | 1.46 | 41.9 | 41.0 | |
| J083737.04+254750.5 | 0.079 | -0.414 | -0.502 | -0.821 | 0.108 | 1.40 | 43.0 | 41.1 | |
| J091636.53+301749.3 | 0.123 | -0.187 | -0.449 | -1.222 | 0.551 | 1.30 | 42.9 | 42.0 | |
| J091958.02+371128.5 | 0.007 | 0.076 | -0.021 | 0.646 | 1.63 | 41.8 | 39.4 | ||
| J093952.76+355358.9 | 0.137 | -0.172 | -0.241 | -0.593 | 1.173 | 1.59 | 43.2 | 42.7 | |
| J095848.67+025243.2 | 0.079 | -0.228 | -0.562 | -1.110 | 0.344 | 1.58 | 41.5 | 40.1 | |
| J095858.53+021459.1 | 0.132 | -0.090 | -0.141 | -0.695 | 0.644 | 1.45 | 42.9 | 41.6 | |
| J100035.47+052428.5 | 0.079 | -0.871 | -0.778 | -1.273 | 0.760 | 43.1 | 41.7 | ||
| J101733.20000145.2 | 0.061 | 0.062 | -0.087 | -0.707 | 0.795 | 1.66 | 43.4 | 41.5 | |
| J101830.79+000504.9 | 0.062 | -0.287 | -0.245 | 0.490 | 1.67 | 42.8 | 40.5 | ||
| J101843.13+413516.1 | 0.084 | 0.068 | 0.051 | -0.628 | 0.687 | 1.49 | 42.2 | 41.3 | |
| J102147.85+131228.1 | 0.085 | 0.037 | -0.156 | -0.750 | 0.907 | 1.54 | 43.3 | 41.6 | |
| J102217.95+212642.8 | 0.042 | -0.300 | -0.498 | -1.494 | -0.283 | 1.28 | 41.4 | 40.7 | |
| J102348.44+040553.7 | 0.099 | -0.030 | -0.248 | 0.197 | 1.35 | 42.0 | 40.3 | ||
| J102822.84+235125.7 | 0.173 | -0.294 | -0.351 | -1.086 | 0.762 | 43.4 | 42.2 | ||
| J103059.09+310255.7 | 0.178 | -0.389 | -0.242 | -0.984 | 1.193 | 47.2 | 42.7 | ||
| J103701.36+414946.2 | 0.123 | -0.273 | -0.631 | 0.244 | 1.43 | 42.1 | 40.7 | ||
| J104930.92+225752.3 | 0.033 | -0.120 | -0.179 | -0.614 | 1.133 | 1.57 | 43.2 | 41.4 | |
| J105144.24+353930.7 | 0.159 | 0.079 | -0.069 | -0.814 | 1.079 | 1.48 | 44.1 | 42.8 | |
| J110101.77+110248.9 | 0.036 | -0.120 | -0.336 | 0.971 | 43.1 | 41.4 | |||
| J110444.64+381058.9 | 0.143 | -0.282 | -0.454 | -1.410 | -0.098 | 1.26 | 42.7 | 41.0 | |
| J111443.66+525834.3 | 0.079 | -0.507 | -0.608 | -1.375 | 0.380 | 1.19 | 42.3 | 40.9 | |
| J111552.33+424330.3 | 0.101 | -0.155 | -0.463 | 0.497 | 1.46 | 42.3 | 41.1 | ||
| J113409.01+491516.3 | 0.037 | -0.281 | -0.334 | -0.882 | 1.142 | 1.64 | 42.4 | 41.2 | |
| J114612.17+202329.9 | 0.023 | 0.331 | 0.261 | -0.420 | 0.448 | 1.79 | 41.8 | 40.7 | |
| J120057.93+064823.1 | 0.036 | -0.151 | -0.270 | -0.981 | 0.596 | 1.53 | 43.4 | 41.2 | |
| J120442.10+275411.7 | 0.165 | -0.391 | -0.305 | -1.161 | 1.132 | 44.4 | 42.9 | ||
| J121049.60+392822.1 | 0.023 | -0.035 | -0.100 | -0.882 | 0.054 | 1.52 | 41.3 | 40.0 | |
| J121118.86+503652.6 | 0.102 | -0.281 | -0.381 | -1.307 | 0.684 | 1.32 | 43.4 | 41.8 | |
| J122137.93+043026.1 | 0.095 | -0.276 | -0.432 | 1.005 | 42.8 | 41.8 | |||
| J122546.72+123942.7 | 0.009 | -0.326 | -0.159 | -0.753 | 1.093 | 1.32 | 42.9 | 41.5 | |
| J122649.56+311736.3 | 0.083 | -0.026 | -0.229 | -0.783 | 0.820 | 1.57 | 42.9 | 41.5 | |
| J122934.04+134629.3 | 0.099 | 0.046 | -0.265 | -1.086 | 1.039 | 1.30 | 42.4 | 41.3 | |
| J124512.93004056.5 | 0.104 | -0.346 | -0.668 | -0.036 | 1.38 | 41.8 | 40.7 | ||
| J124828.44+083112.7 | 0.119 | -0.025 | -0.831 | 0.868 | 1.55 | 43.0 | 41.1 | ||
| J130845.69013053.9 | 0.111 | -0.502 | -0.523 | -1.152 | 0.981 | 1.28 | 42.7 | 41.6 | |
| J132525.63+073607.5 | 0.124 | 0.053 | -0.094 | 1.079 | 1.58 | 42.7 | 41.8 | ||
| J132925.36+115754.9 | 0.148 | -0.275 | -0.525 | 0.262 | 1.26 | 42.4 | 41.3 | ||
| J133217.89+291320.0 | 0.136 | -0.356 | -0.468 | 0.085 | 1.28 | 42.1 | 40.8 | ||
| J133739.87+390916.4 | 0.020 | 0.351 | -0.375 | -0.977 | 1.066 | 1.34 | 39.9 | 40.4 | |
| J134054.36+262253.8 | 0.187 | -0.036 | -0.291 | 0.562 | 1.19 | 42.8 | 41.6 | ||
| J134208.38+353915.4 | 0.003 | 0.084 | 0.000 | -0.656 | 1.045 | 1.44 | 41.2 | 39.5 | |
| J134351.06+000434.7 | 0.074 | -0.580 | -0.554 | 0.774 | 41.8 | 41.0 | |||
| J134834.94+263109.8 | 0.059 | -0.283 | -0.545 | -1.452 | 0.815 | 42.6 | 42.0 | ||
| J135553.52+383428.7 | 0.050 | -0.795 | -0.423 | -0.553 | 0.752 | 43.2 | 41.7 | ||
| J140515.58+542458.0 | 0.083 | 0.171 | -0.250 | 0.672 | 1.54 | 42.3 | 40.3 | ||
| J141314.87031227.3 | 0.006 | -0.054 | -0.074 | -0.857 | 0.973 | 1.53 | 42.8 | 41.6 | |
| J142904.60+012017.3 | 0.101 | -0.319 | -0.658 | 0.121 | 1.30 | 42.9 | 40.9 | ||
| J143450.62+033842.5 | 0.028 | -0.344 | -0.479 | -1.286 | 0.623 | 1.35 | 41.3 | 40.3 | |
| J145442.23+182937.1 | 0.116 | -0.235 | -0.471 | 0.295 | 1.48 | 42.8 | 41.5 | ||
| J150121.14+013813.4 | 0.035 | -0.032 | -0.350 | -0.984 | -0.045 | 1.38 | 41.5 | 40.8 | |
| J151106.41+054122.9 | 0.081 | -0.301 | -0.379 | -1.247 | 1.077 | 1.32 | 42.8 | 42.0 | |
| J151616.85+000804.4 | 0.092 | -0.070 | -0.210 | -1.120 | 0.542 | 1.42 | 42.6 | 41.1 | |
| J151640.21+001501.9 | 0.052 | 0.048 | 0.022 | -0.102 | 0.685 | 1.36 | 43.0 | 41.2 | |
| J151741.72+424820.1 | 0.116 | -0.366 | -0.562 | -0.004 | 1.29 | 42.7 | 41.1 | ||
| J152203.33+275100.9 | 0.075 | -0.258 | -0.496 | 0.596 | 1.33 | 42.6 | 40.6 | ||
| J153152.28+241429.7 | 0.096 | -0.100 | -0.423 | 0.197 | 1.32 | 42.8 | 40.8 | ||
| J155855.79+024833.9 | 0.046 | 0.132 | 0.013 | -0.450 | 0.799 | 1.79 | 42.5 | 41.4 | |
| J160452.45+240241.6 | 0.088 | -0.249 | -0.357 | -1.204 | 0.856 | 43.1 | 41.6 | ||
| J160534.64+323940.8 | 0.030 | -0.254 | -0.319 | -1.188 | 0.530 | 1.41 | 41.3 | 40.4 | |
| J231815.66+001540.1 | 0.030 | -0.199 | -0.323 | -1.055 | 0.434 | 1.54 | 41.7 | 40.4 |
| [O I]/H | [S II]/H | ||
|---|---|---|---|
| -0.382 | -0.332 | -0.329 | |
| Sample | [O I]/H | [S II]/H |
|---|---|---|
| sub-sample | 0.537() | 0.622() |
| Final sample | 0.659() | 0.562() |