The Kinematic Age of the Coolest T Dwarfs
Abstract
Surprisingly, current atmospheric models suggest that the coolest T dwarfs (T8.5 to T10) are young and very low mass (, , Leggett et al. 2009, 2010, 2012). Studies of population kinematics offer an independent constraint on the age of the population. We present kinematic data of a sample of 75 mid to late T dwarfs drawn from a variety of sources. We define our samples, T5.5 to T8 and T8.5 to T10, as mid and late T respectively. UKIDSS LAS kinematics were derived from our automated LAS proper motion pipeline and distance estimates derived from spectral types and photometry for the minority of sources that lack parallaxes. Our results show that the mid and late T populations do not have distinctly separate tangential velocity distributions to 95% probability. They also give an approximate mean kinematic age equal to that of a population with colour , and a spectral type late F, which corresponds to an age of about . However the median and modal ages are greater. This indicates that while model atmospheres correctly predict some trends in colour with gravity and age, reliable ages cannot yet be inferred from them. More benchmark objects are needed to anchor the models.
1 Background and Aims
Current atmospheric models suggest that the coolest T dwarfs from the UKIDSS survey are young and very low mass. For example the T8.5 dwarf ULAS 1238 has a model mass and age of and , T9 dwarfs ULAS 0034 and ULAS 1335 both have model masses and ages of and (Leggett et al. 2009, 2010), and T10 dwarf ULAS 0722 has a model mass and age of and (Leggett et al., 2012). This is surprising, theory predicts that these objects cool at a steady rate through to later types. Young, planetary mass late T dwarfs should be very rare unless the Initial Mass Function rises at planetary masses. Studies of population kinematics offer an independent test of the age of a population. We present results of a method to determine the kinematic age of mid-late T dwarfs, in an effort to test the models.
2 Our Kinematic Sample
Our sample is drawn from the UKIDSS late T dwarf sample and Dupuy & Liu (2012). Parallaxes are available from the PARSEC parallax program (Marocco et al., 2010; Andrei et al., 2011), Dupuy & Liu (2012) and Kirkpatrick et al. (2012) for 48/75 T dwarfs. Distance estimates for the remainder are derived from photometry and spectral types using the polynomial fits of J band absolute magnitude to spectral type described in Marocco et al. (2010). Proper motions are taken where given by the sources of the parallax measurements and from our bespoke UKIDSS LAS proper motion pipeline otherwise. Proper motions are also LSR corrected by us.
3 Methods
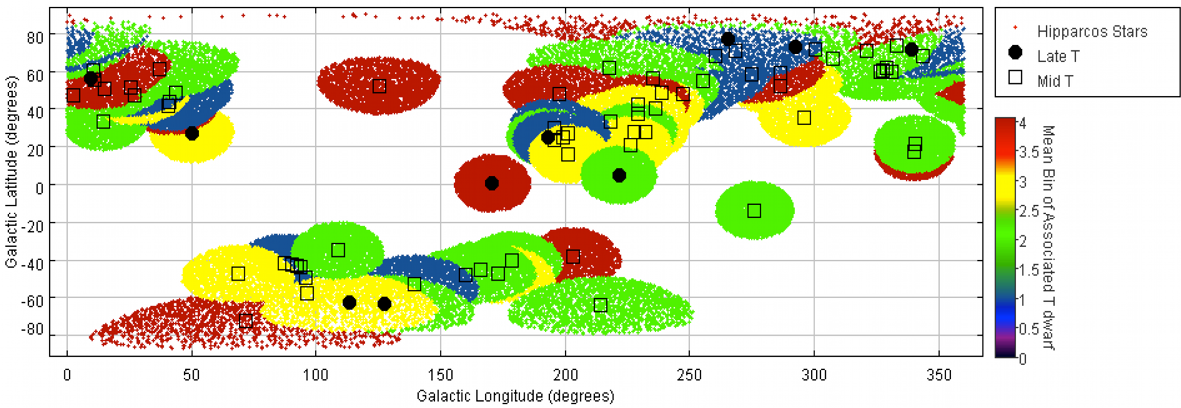
We performed two-sample K-S and Student s t tests on the total tangential velocities of mid and late T dwarf populations (totalling 64 and 11 dwarfs respectively). We then compared the RA and Dec components of Vtan for each T dwarf from our sample to the median Vtan components of Hipparcos stars within 15 degrees on the sky (see Figure 3). The purpose of the radial selection criteria was to remove possible differential contributions to Vtan based on galactic coordinates. We used only Hipparcos stars with reliable parallax and genuine B-V measurements (, ). The Hipparcos stars were separated into the 4 fairly broad B-V colour bins shown in Table 3.
| Bin | Boundaries | Typical Contents |
|---|---|---|
| 1 | O, B, A, and early F | |
| 2 | Mid F | |
| 3 | Late F and early G | |
| 4 | Mid G onwards |
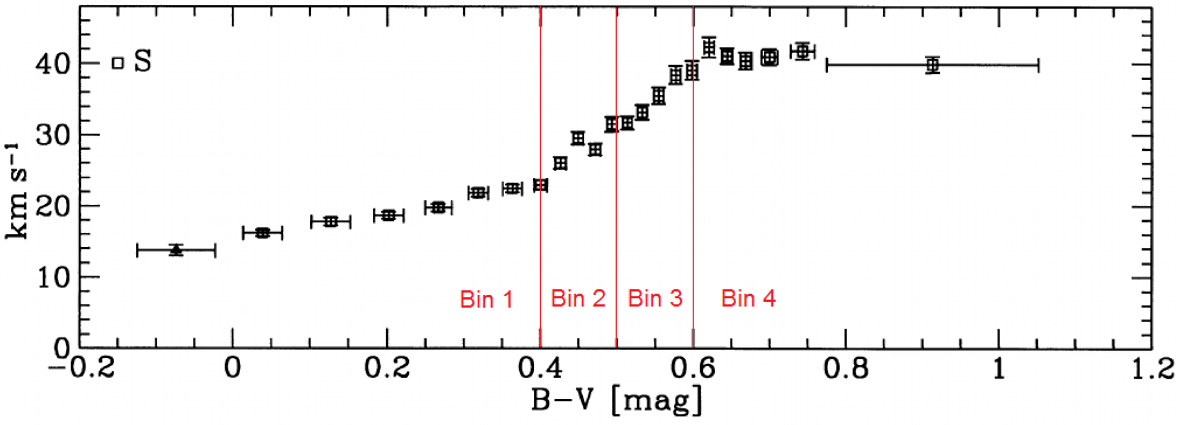
Bin 1 encompasses 0, B, A and early F type stars which have relatively small total velocity dispersions due to their young ages. Bins 2 and 3 encompasses mid F to early G type stars with total velocity dispersion increasing fairly linearly with magnitude through the bin. Bin 4 contains stars with spectral types from mid G onwards, their main sequence lifetimes are comparable to the age of the Galaxy and as such their total velocity dispersions are reasonably constant. See Figure 2. Our code then assigns a bin number to each component of tangential velocity for each T dwarf, the bin with the smallest difference in T dwarf velocity and median bin velocity being selected. The result is the mean bin number assigned across RA and Dec components of tangential velocity from each T dwarf population.
4 Results
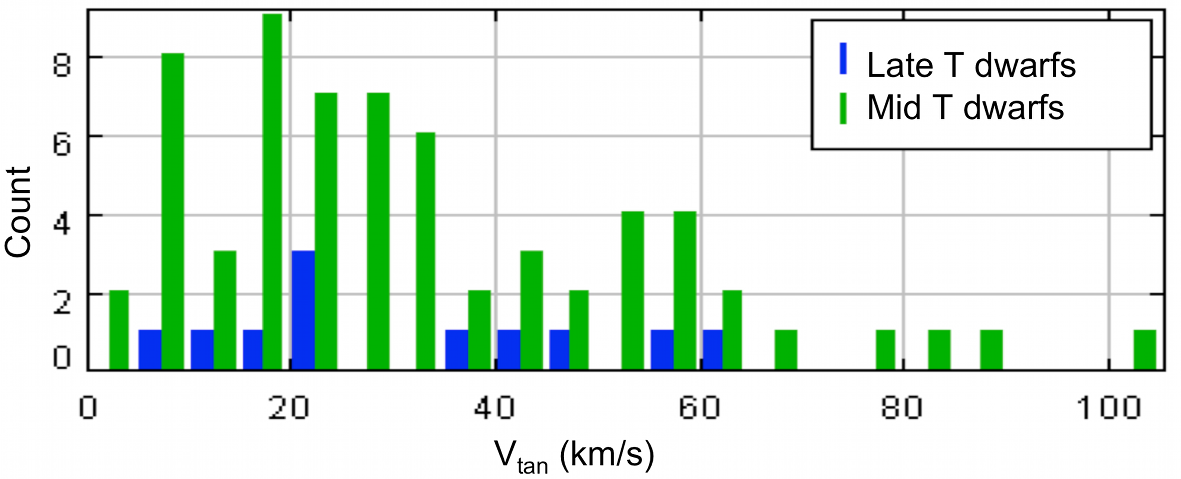
The K-S and Student s t tests indicate that there is roughly a 95% probability that the samples are drawn from the same population (K-S: 94%, t: 97%).
Results of the mid-late T dwarf to Hipparcos tangential velocity comparison give the two populations average colour bins of 2.6 and 2.9 (mid and late Ts respectively) showing that both populations have a kinematic dispersion similar to that of populations with colours of 0.51 and 0.54 (mid and late Ts respectively). It is worth noting that while the mean values of the selected bins are 2.6 and 2.9, the modal selected bin is 4 for both samples. Therefore the characteristic age estimate based on the mean bin values may be an underestimate.
5 Conclusion
Our results show that there is no difference in the distributions of Vtan of the late T and mid T dwarf populations, in contrast to what the models predict. A kinematic dispersion equal to that of a colour star suggests a total velocity dispersion of order (with no velocity weighting applied). This corresponds to a stellar age of (Binney, Dehnen & Bertelli, 2000; Fuchs et al., 2001). Median and modal ages are greater, of order . is at the high end of ages predicted by models for ULAS 0034 and ULAS 1335 and older than predicted for ULAS 1238 and ULAS 0722. Thus the average ages predicted by the evolutionary models and kinematic measurements differ. This indicates that while model atmospheres predict some trends in colour with gravity and age well, reliable ages cannot yet be inferred from them. Increasing the number of known benchmark objects is necessary to anchor the current models.
References
- Andrei et al. (2011) Andrei A. H. et al., 2011, AJ, 141, 54
- Binney, Dehnen & Bertelli (2000) Binney J., Dehnen W., Bertelli G., 2000, MNRAS, 318, 658
- Dupuy & Liu (2012) Dupuy T. J., Liu M. C., 2012, ApJ, 201, 19
- Fuchs et al. (2001) Fuchs B., Dettbarn C., Jahreiß H., Wielen R., 2001, in Astronomical Society of the Pacific Conference Series, Vol. 228, Dynamics of Star Clusters and the Milky Way, Deiters S., Fuchs B., Just A., Spurzem R., Wielen R., eds., p. 235
- Kirkpatrick et al. (2012) Kirkpatrick J. D. et al., 2012, ApJ, 753, 156
- Leggett et al. (2010) Leggett S. K. et al., 2010, ApJ, 710, 1627
- Leggett et al. (2009) Leggett S. K. et al., 2009, ApJ, 695, 1517
- Leggett et al. (2012) Leggett S. K. et al., 2012, ApJ, 748, 74
- Marocco et al. (2010) Marocco F. et al., 2010, A&A, 524, A38